Louisiana-Pacific Corporation

Louisiana-Pacific Corporation (LPX) Market Cap

Louisiana-Pacific Corporation has a market capitalization of $4.93B.

Price: $70.60

-0.69 (-0.97%)

Market Cap: 4.93B

NYSE · time unavailable

CEO: Jason Ringblom

Sector: Basic Materials

Industry: Paper, Lumber & Forest Products

IPO Date: 1980-03-17

Website: https://www.lpcorp.com

Louisiana-Pacific Corporation (LPX) - Company Information

Market Cap: 4.93B|Sector: Basic Materials

Company Profile

Louisiana-Pacific Corporation, together with its subsidiaries, manufactures and markets building products primarily for use in new home construction, repair and remodeling, and outdoor structure markets. It operates through four segments: Siding; Oriented Strand Board (OSB); Engineered Wood Products (EWP); and South America. The Siding segment offers LP SmartSide trim and siding products, LP SmartSide ExpertFinish trim and siding products, LP BuilderSeries lap siding products, and LP Outdoor Building Solutions; and engineered wood siding, trim, soffit, and fascia products. The OSB segment manufactures and distributes OSB structural panel products comprising LP TechShield radiant barriers, LP WeatherLogic air and water barriers, LP Legacy premium sub-flooring products, LP FlameBlock fire-rated sheathing products, and LP TopNotch sub-flooring products. The EWP segment provides laminated veneer lumber and other related products; and LP SolidStart I-joists, which are primarily used in residential and commercial floorings, roofing systems, and other structural applications. The South America segment manufactures and distributes OSB structural panel and siding products. This segment also distributes and sells related products for the region's transition to wood frame construction. It also offers timber and timberlands and other products and services. The company sells its products primarily to retailers, wholesalers, and homebuilding and industrial businesses in North America and South America, Asia, Australia, and Europe. Louisiana-Pacific Corporation was incorporated in 1972 and is headquartered in Nashville, Tennessee.

Analyst Sentiment

88%
Strong Buy

From 12 Active Polls

1Y Forecast: $98.50

▲ +39.5% Potential Upside

Consensus Target Metrics

Low Bound

$90

Median

$99

High Bound

$107

Average

$99

Price & Moving Averages

Loading chart...

🎯 Wall Street Analyst Intelligence Report

1-Year structural target targets, chart projections, and sentiment maps.

Average 1Y Target
$98.50
▲ +39.52% Upside
Low Target
$90.00
27% Risk
Median Target
$98.50
40% Mid
High Target
$107.00
52% Max
Consensus
Buy
12 / 24 Buys

Consensus Trend Projection

Trailing closures vs. 12-month metrics map.

Analyst Vote Distribution

Aggregate institutional coverage sentiment weights.

📊 Historical Valuation Multiples

Real-time Trailing Twelve Month (TTM) momentum side-by-side with discrete quarterly metrics.

Fiscal QuarterTTMQ1 2026Q4 2025Q3 2025Q2 2025Q1 2025Q4 2024Q3 2024Q2 2024
Period EndingTrailing 12MMar 31, 2026Dec 31, 2025Sep 30, 2025Jun 30, 2025Mar 31, 2025Dec 31, 2024Sep 30, 2024Jun 30, 2024
Market Cap ($M)4,9325,0935,6536,2196,0196,4397,2497,5225,926
Enterprise Value ($M)5,1465,3075,7626,2816,0646,5627,2897,5485,979
Price to Earnings Ratio (P/E)60.2747.15-176.66172.7427.8717.6929.2320.899.26
Price/Earnings-to-Growth Ratio (PEG)38.196.512.730.74
Price to Sales Ratio (P/S)1.938.879.979.387.978.8910.6610.427.28
Price to Book Ratio (P/B)2.862.943.273.583.463.814.344.523.57
Price to Free Cash Flow Ratio (P/FCF)-822.08-51.96-706.651036.4764.04168.5754.1233.67
Enterprise Value to Sales (EV/Sales)9.2410.169.478.039.0610.7210.457.35
Enterprise Value to EBITDA (EV/EBITDA)17.8770.75130.96110.1954.1541.5363.9351.0025.34
Debt to Equity Ratio0.740.220.230.220.220.220.230.220.22

LPX Growth Runway Model

Standard long term linear growth fade

Multi-Stage Discounted Cash Flow Sandbox

Market Price$70.60
Intrinsic Value$49.91
Market Alignment
Overvalued by 29.3%relative to calculated intrinsic value
9.00%
Exp: -7%-7%
i

Growth runway slowdown

This value provides a time window for the growth rate to decline beyond Stage 1 toward the terminal rate. Longer windows are most useful for companies with high growth starting conditions or strong competitive advantages. This option stretches out the growth rate slowdown across 5, 10, or 15-year steps. A high-growth starting condition (exceeding a 25% initial growth rate) automatically applies a curve decay to simulate realistic, rapid market saturation.
i

Terminal growth rate

With long-term inflation between 3-5%, revenue must grow by that baseline to maintain flat real-world market share. This value sets the permanent terminal growth rate to factor into the valuation beyond the growth slowdown runway toward maturity.

3-Stage Financial Runway Horizon

🧠 Perpetuity Horizon Engine (Stage 3: Post-2035)

Terminal FCF Base$0.25B
Perpetuity TV Value$4.77B
Discounted TV (PV)$2.02B
TV Weighting %52.2%
⚠️
Financial Model Disclaimer & Risk Disclosure: This interactive scenario simulator is an educational sandbox provided strictly for informational and analytical research purposes. Core historical financial statements and consensus estimates are sourced directly via Financial Modeling Prep (FMP). All downstream outputs are entirely deterministic, hypothetical projections generated by combining automated mathematical formulas (including linear interpolation and Gaussian bell-curve decay models) with user-selected variables and third-party financial data inputs. Users assume all liability for trading decisions executed based on these sandbox calculations.

📘 Full Research Report

ℹ️

AI-Generated Research: This report is for informational purposes only.

📘 LOUISIANA PACIFIC CORP (LPX) — Investment Overview

🧩 Business Model Overview

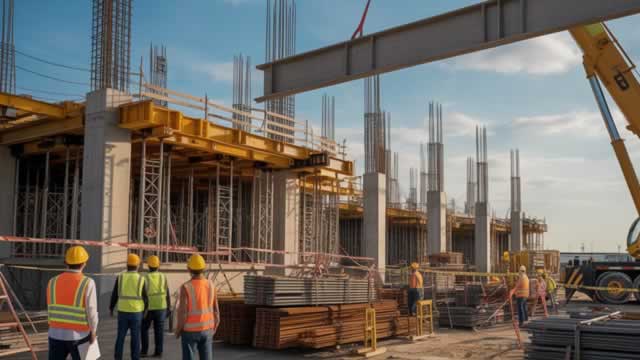
Louisiana-Pacific converts low-cost wood fiber into engineered building products—primarily oriented strand board (OSB) and related structural and exterior solutions used in residential and light commercial construction. The value chain starts with timber and wood procurement, proceeds through refining and panel production (drying, resin blending, pressing, finishing), and ends with shipment of standardized building materials that are specified by builders, distributors, and downstream manufacturers.

The business model benefits from vertical integration and a manufacturing network sized for commodity-grade volume, paired with product mix choices that can shift toward higher-value engineered outputs when market structure supports it.

💰 Revenue Streams & Monetisation Model

Revenue is primarily derived from:

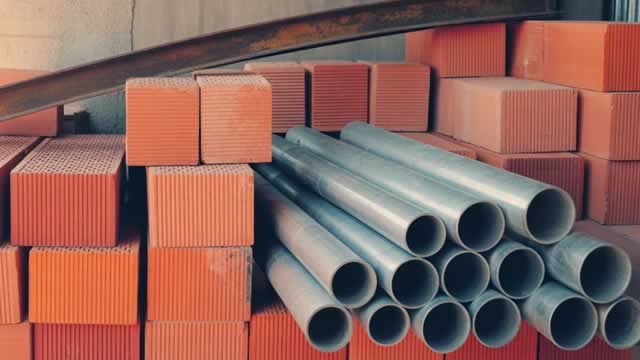
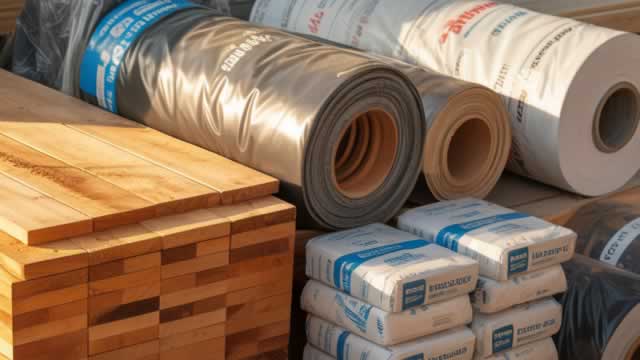
  • OSB and structural panels: largely volume-driven, with pricing that generally tracks broader panel/wood-fiber benchmarks.
  • Lumber and other wood products: typically tied to construction activity and lumber supply-demand dynamics.
  • Exterior building products (e.g., siding/trim, where applicable): typically monetized at a higher value per unit than commodity panels, with margins influenced by product complexity, resin/board costs, and distribution execution.

Monetisation is best understood through margin drivers rather than “recurring revenue.” LPX’s earnings power depends on the spread between product prices and key inputs—especially wood fiber cost, energy/utilities, and resin, alongside plant utilization and disciplined maintenance/turnaround execution. Product mix (structural vs. exterior/value-added outputs) and freight/regionally optimized shipments also materially influence operating margins.

🧠 Competitive Advantages & Market Positioning

LPX’s moat is primarily economic cost advantage supported by manufacturing scale and fiber procurement, plus specification-driven stickiness common in engineered building materials.

  • Cost advantages (fiber + manufacturing): Engineered panels are highly energy- and process-intensive, and competitive outcomes hinge on consistent throughput, yield, and input procurement. LPX’s footprint and procurement approach can translate into a favorable cost structure versus smaller or less optimally positioned producers.
  • Geographic/logistical competitiveness: Panel producers benefit from proximity to wood fiber sources and from regional distribution networks that reduce delivered costs for major building markets.
  • Specification & purchasing inertia: OSB and related products often enter projects through distributor channels and builder specifications. Switching suppliers can involve qualification and procurement friction, which can support relative demand stability when capacity is constrained.

Competitive benchmarking:

  • Georgia-Pacific (GP): A large diversified building-products supplier with a broad structural materials footprint; competes across OSB panels and engineered wood categories.
  • Weyerhaeuser: Competes through timber resources and building materials production; often emphasizes forest products integration.
  • West Fraser (and other OSB-focused peers such as Canfor): Competes through OSB and related wood products with scaled manufacturing.

Compared with these rivals, LPX’s positioning is centered on engineered panel leadership and optimized cost/fiber and manufacturing execution across its facilities, seeking to outperform through margins when industry capacity and demand dynamics allow for pricing discipline and utilization benefits.

🚀 Multi-Year Growth Drivers

Over a five- to ten-year horizon, LPX’s growth outlook is tied to structural demand for housing-related materials and the ongoing penetration of engineered wood. Key drivers include:

  • Housing construction and repair/remodel demand: A large portion of wood panel consumption is driven by residential building starts and ongoing renovations, which can be supported by demographic and affordability dynamics over the long run.
  • Engineered panel substitution: OSB and engineered solutions remain central to efficient building envelope construction, particularly where code-driven performance and construction speed matter.
  • Residential/light commercial product complexity: Building exterior requirements and regional code preferences can favor value-added panel and exterior products when manufacturers can meet specifications consistently.
  • Capacity discipline and industry structure: The sector’s operating model is capital- and maintenance-intensive; supply adjustments often occur through production cycles rather than rapid incremental entry, which can support long-run margins for best-cost producers through the cycle.

⚠ Risk Factors to Monitor

  • Commodity cyclicality: OSB, lumber, and panels remain sensitive to construction activity, housing affordability, and broader materials pricing—creating earnings volatility through the cycle.
  • Input cost and timber availability: Wood fiber costs, energy costs, and resin supply can swing operating margins; adverse changes in procurement economics or fiber supply can pressure spreads.
  • Environmental and product compliance: Building products face evolving regulations on emissions, waste handling, and environmental permitting tied to manufacturing operations.
  • Capital intensity and execution risk: Maintaining and upgrading manufacturing assets requires sustained capex and operational discipline; shutdowns or underperformance can erode cost advantages.
  • Competitive capacity additions and pricing pressure: Large peers can reallocate production and pricing when industry capacity changes, which can compress margins for all participants.

📊 Valuation & Market View

Markets typically value building-products and engineered wood producers on enterprise value versus earnings power—often using EV/EBITDA rather than revenue multiples—because results are driven by cyclical utilization, fixed-cost absorption, and input-cost spreads. Key valuation drivers include:

  • Through-the-cycle margin durability (cost leadership and stable fiber economics)
  • Utilization expectations (capacity discipline and demand strength)
  • Capital allocation credibility (maintenance of cost position and disciplined expansion)
  • Balance-sheet resilience to manage commodity downturns

Because the sector is cyclical, valuation tends to reward companies demonstrating consistent cost performance and operational throughput, while penalizing those with persistently weaker margins or higher structural downtime.

🔍 Investment Takeaway

Louisiana-Pacific is best viewed as a best-cost structural materials business where sustainable advantage comes from engineered panel manufacturing scale, fiber and logistics economics, and specification-driven purchasing inertia in OSB and related building products. The long-term opportunity rests on enduring construction demand for engineered wood and the sector’s capital intensity that can preserve pricing discipline for cost leaders through cyclical downturns. Investment quality hinges on maintaining cost leadership, managing input and compliance risks, and sustaining utilization discipline.


⚠ AI-generated — informational only. Validate using filings before investing.

📰 Market News & Coverage

15 Stories Available

Real-time institutional reporting and market updates for LPX.

zacks.com2026-06-05

Louisiana-Pacific (LPX) Down 5.6% Since Last Earnings Report: Can It Rebound?

Louisiana-Pacific (LPX) reported earnings 30 days ago. What's next for the stock?

zacks.com2026-06-05

Is Trending Stock Louisiana-Pacific Corporation (LPX) a Buy Now?

Louisiana-Pacific (LPX) has been one of the stocks most watched by Zacks.com users lately. So, it is worth exploring what lies ahead for the stock.

seekingalpha.com2026-06-04

Baron Real Estate Fund Q1 2026 Portfolio Activity

As the shares became increasingly discounted, Baron Real Estate Fund added to its long-term position, reflecting greater conviction in the company's growth trajectory. During the quarter, we reestablished a position in Public Storage Incorporated, the best-in-class self-storage REIT with a portfolio of more than 3,500 U.S. properties. We exited our position in Louisiana-Pacific Corporation (DBA LP Building Solutions) during the quarter.

businesswire.com2026-06-01

LP Building Solutions Announces Chief Financial Officer Succession Plan

NASHVILLE, Tenn.--(BUSINESS WIRE)--LP Building Solutions announced that CFO Alan Haughie plans to retire and Aaron Howald has been appointed as his successor, effective Sept. 1, 2026.

zacks.com2026-05-25

Louisiana-Pacific (LPX) Is Considered a Good Investment by Brokers: Is That True?

The recommendations of Wall Street analysts are often relied on by investors when deciding whether to buy, sell, or hold a stock. Media reports about these brokerage-firm-employed (or sell-side) analysts changing their ratings often affect a stock's price.

zacks.com2026-05-21

Louisiana-Pacific Corporation (LPX) is Attracting Investor Attention: Here is What You Should Know

Recently, Zacks.com users have been paying close attention to Louisiana-Pacific (LPX). This makes it worthwhile to examine what the stock has in store.

seekingalpha.com2026-05-16

Louisiana-Pacific: A Good Siding Business Offset By A Weak OSB Market

Louisiana-Pacific delivered strong Q1 '26 results, with Siding segment pricing power offsetting volume declines and OSB losses better than expected. Despite operational excellence and a clean balance sheet, LPX trades at 17x forward EV/EBITDA—well above peers like Owens Corning and West Fraser. H2 margins are guided lower, OSB remains a $40M EBITDA drag, and current valuation prices in a full housing recovery not yet evident in results.

marketbeat.com2026-05-11

Louisiana-Pacific Q1 Earnings Call Highlights

Louisiana-Pacific NYSE: LPX said it met its first-quarter 2026 guidance despite weaker housing conditions, softer OSB demand and commodity price pressure, with stronger-than-expected pricing in both siding and oriented strand board helping offset lower volumes.

zacks.com2026-05-08

Is It Worth Investing in Louisiana-Pacific (LPX) Based on Wall Street's Bullish Views?

The recommendations of Wall Street analysts are often relied on by investors when deciding whether to buy, sell, or hold a stock. Media reports about these brokerage-firm-employed (or sell-side) analysts changing their ratings often affect a stock's price.

seekingalpha.com2026-05-06

Louisiana-Pacific Corporation (LPX) Q1 2026 Earnings Call Transcript

Louisiana-Pacific Corporation (LPX) Q1 2026 Earnings Call Transcript

zacks.com2026-05-06

Louisiana-Pacific (LPX) Q1 Earnings and Revenues Top Estimates

Louisiana-Pacific (LPX) came out with quarterly earnings of $0.38 per share, beating the Zacks Consensus Estimate of $0.09 per share. This compares to earnings of $1.27 per share a year ago.

businesswire.com2026-05-06

LP Building Solutions Reports First Quarter 2026 Results, Updates Guidance

NASHVILLE, Tenn.--(BUSINESS WIRE)--Louisiana-Pacific Corporation reported its financial results for the three months ended March 31, 2026.

zacks.com2026-05-04

Countdown to Louisiana-Pacific (LPX) Q1 Earnings: A Look at Estimates Beyond Revenue and EPS

Evaluate the expected performance of Louisiana-Pacific (LPX) for the quarter ended March 2026, looking beyond the conventional Wall Street top-and-bottom-line estimates and examining some of its key metrics for better insight.

businesswire.com2026-05-01

LP Building Solutions Announces Quarterly Dividend

NASHVILLE, Tenn.--(BUSINESS WIRE)--Louisiana-Pacific Corporation declared a quarterly cash dividend of $0.30 per share to common stockholders of record as of May 14, 2026.

gurufocus.com2026-04-29

Louisiana-Pacific Corp (LPX) Shares Fall 4.7% -- What GF Score of 85 Tells Investors

On April 29, 2026, Louisiana-Pacific Corp (LPX) shares fell 4.7% to a current price of $72.09. The stock is trading within a 52-week range of $68.87 to $102.86,

📊 AI Financial Analysis

Powered by StockMarketInfo
Earnings Data: Q Ending 2026-03-31

"LPX reported Q1’26 revenue of $574.0M and net income of $27.0M (EPS $0.39). On a YoY basis (vs Q1’25), revenue declined -20.7% and net income declined -70.4% (from $91.0M). QoQ (vs Q4’25), revenue increased +1.2%, but net income surged from a net loss of -$8.0M to +$27.0M. Profitability remains volatile: gross margin eased to 20.0% from 27.3% in Q1’25 and improved modestly from Q4’25 (14.99%). Net margin in Q1’26 was 4.7%, up from -1.4% in Q4’25 but well below Q1’25 (12.6%). Operating income was $34.0M, reflecting a sharp QoQ rebound. Cash flow quality is mixed. Operating cash flow was -$38.0M and free cash flow was -$99.0M in Q1’26, contrasted with +$67.0M operating cash flow in Q4’25. The company paid dividends of -$21.0M and had no buybacks in the quarter. Balance sheet resilience looks reasonable for a non-bank: total assets were $2.58B, equity was stable at ~$1.73B, but cash fell to $164.0M while net debt widened to ~$205.0M. Shareholder returns appear muted: price is $76.97 with 1y_change of -8.18% (no >20% momentum)."

Revenue Growth

Caution

QoQ revenue rose +1.2% ($574.0M vs $567.0M) but YoY revenue fell -20.7% ($574.0M vs $724.0M), indicating a still-weak demand/volume backdrop.

Profitability

Caution

QoQ net income improved from -$8.0M to +$27.0M, but YoY net income dropped -70.4%. Net margin was 4.7% (vs -1.4% QoQ, 12.6% YoY), showing margins are not sustainably expanding.

Cash Flow Quality

Neutral

Q1’26 operating cash flow was -$38.0M and free cash flow -$99.0M (QoQ operating cash flow +$67.0M). Dividends of -$21.0M were paid, but the negative FCF reduces near-term cash coverage confidence.

Leverage & Balance Sheet

Fair

Equity was steady at ~$1.73B (total equity essentially flat QoQ/YoY). However cash declined sharply (to $164M) and net debt increased to ~$205M from $109M in Q4’25.

Shareholder Returns

Neutral

Price performance was negative over 1Y (-8.18%). Dividend yield is low (~0.41%). No evidence of buybacks in Q1’26, limiting total shareholder return support.

Analyst Sentiment & Valuation

Caution

Consensus target ($102) implies upside vs $76.97, but valuation multiples appear elevated/unstable given recent earnings volatility (EPS swung from -$0.11 in Q4 to +$0.39 in Q1).

Disclaimer:This analysis is AI-generated for informational purposes only. Accuracy is not guaranteed and this does not constitute financial advice.

Fundamentals Overview

Loading fundamentals overview...

LPX’s Q1 2026 showed resilient adjusted profitability despite a weak housing backdrop, with EBITDA $82M and Siding pricing strength partially offsetting OSB weakness. OSB remains the key drag: OSB pricing was 28% below the prior-year first quarter, causing a $66M revenue/EBITDA hit and culminating in a Q2 OSB EBITDA loss guidance of about $10M under current printed prices. Siding delivered 9% price growth against an 18% volume decline, helped by January list price averaging ~4–5 points plus mix and rebate refinements. Management expects Siding Q2 revenue of $435M–$445M and EBITDA of $115M–$120M, with volumes down ~10% YoY and sequential improvement through year end. Long-run leverage hinges on ExpertFinish and SmartSide share gains; ExpertFinish is expected mid-single-digit volume growth and capacity additions are underway. Guidance explicitly avoids crude oil price forecasting but incorporates cost sensitivities—manufacturing/raw materials outweigh freight, and back-half oil-based cost impacts contributed materially to the midpoint guidance reduction.

AI IconGrowth Catalysts

  • SmartSide pricing power offsetting volume declines; January list price increased pricing power with continued steady list price expectations into Q2
  • ExpertFinish (prefinished) share gains: Q1 ExpertFinish was 12% of Siding volume and 18% of Siding revenue; expected to grow mid-single digits for full-year
  • New ExpertFinish capacity ramp: Green Bay, WI line adding ~50M sq ft (~25%) is ramping; additional ~20M sq ft planned at Bath, NY later in 2026; land acquired in North Branch, MN for additional capacity
  • Underserved new construction channel penetration via enterprise builder programs: expected supply of ~100M sq ft SmartSide across 15 of the top 25 homebuilders in 2026

Business Development

  • Secured two new builder partnerships in 2026 (names not provided); enterprise programs target Southeastern and Southwestern underpenetrated markets and provide access to new market segments
  • Target supply program scale: ~100M sq ft SmartSide in total to 15 of the top 25 U.S. homebuilders
  • Analyst mentioned Sherwood Lumber East Coast partnership (management did not provide additional details in the excerpt beyond distribution/enterprise strategy)
  • Maniwaki conversion still under engineering review (no new specifics provided); management expects additional information in coming quarters

AI IconFinancial Highlights

  • Q1 adjusted EPS: $0.38; returned $21M to shareholders via dividends
  • EBITDA delivered $82M; above high end of guided range despite lower volumes and weaker macro
  • Net sales down year over year; OSB price softness drove a $66M reduction in net sales and EBITDA
  • Siding: unit volumes down 18% YoY; selling prices up 9% (primed prices +8%, ExpertFinish prices +10%); January 1 list price averaged ~4–5 points of the total increase; remaining ~4.5 points from favorable mix (~2.5 points) and rebate refinements (~2 points)
  • Siding revenue/EBITDA mechanics: for Q2, revenue reduction expected $42M but EBITDA hit only ~$8M; Siding EBITDA margin 28% vs a closer-to-26% scenario without rebates/inventory dynamics (roughly +200 bps benefited by these factors)
  • OSB: prices 28% lower vs first quarter of prior year; OSB volumes down further reduced EBITDA by ~$10M (commodity) and ~$30M (structural solutions) revenue impact stated; mill overhead and SG&A savings of $5M YoY helped offset other pressures
  • Q2 outlook: Siding revenue $435M–$445M; Siding EBITDA $115M–$120M; OSB EBITDA expected loss of about $10M
  • Full-year outlook: Siding revenue $1.4B–$1.66B; Siding EBITDA $410M–$425M; guidance reflects current OSB price weakness and depressed South America conditions (Chile uncertainty cited)

AI IconCapital Funding

  • Dividends: $21M returned to shareholders in Q1
  • Cash ended Q1 at $164M; total liquidity $900M including an undrawn revolver
  • Net operating cash outflow: $38M vs $64M inflow last year; cited drivers include ~$80M reduction in total EBITDA and a larger-than-usual buildup of log inventory
  • Strategic growth capex earmarked at ~$200M (consistent quarter over quarter); close to $100M for ExpertFinish expansion (not all from new mill; includes New York upgrades/completion); $20M–$30M for the next major Siding mill (~$130M total Siding capacity expansion; about three-quarters is ExpertFinish)

AI IconStrategy & Ops

  • Channel inventory normalization: February anticipation that elevated shed-customer inventories would drag Q1 volumes; management stated inventory is now back within seasonally normal ranges
  • Siding segment mix and rebate dynamics: shed primed mix reduced while ExpertFinish remained strong/flat; rebate refinements reflect lower-than-expected rebate payments and modestly lower rebate accrual rates (volume-related)
  • Crude oil sensitivity approach: company explicitly avoids predicting future crude oil; guidance incorporates realized near-term effects and contract pricing algorithm impacts
  • Operational mitigation: controlled OSB mill overhead and SG&A; forward logging undertaken as oil prices rose to mitigate freight exposure ahead of spring breakup; log inventory build attributed to cost mitigation and anticipation of maintenance projects

AI IconMarket Outlook

  • Siding Q2 2026 guidance: revenue $435M–$445M; EBITDA $115M–$120M; expectation of Siding volume declines YoY of about 10% in Q2 with sequential improvements through year end
  • ExpertFinish: expected to outperform; full-year ExpertFinish volume growth in the mid-single digits; managed around share gains vs competing prefinished alternatives
  • Siding price: list prices expected steady; price/mix benefit expected to moderate vs Q1 as shed mix increases after shed channel inventory normalization
  • OSB Q2 2026 guidance: EBITDA loss about $10M assuming prices remain flat from the last Friday printed level (with Southeast and Southwest drops putting OSB under EBITDA breakeven)
  • Full-year Siding: revenue and EBITDA expected $1.4B–$1.66B and $410M–$425M respectively
  • OSB full-year guidance implied: Q3 and Q4 would deliver similar results as long as current OSB prices persist in an oversupplied market

AI IconRisks & Headwinds

  • Housing/consumer confidence deterioration: order files show increasing uncertainty for back half of year; management cited eroding indicators after conflict in Iran affecting macro and demand
  • OSB demand and pricing weakness: prices under EBITDA breakeven; company does not plan to continue operating at loss levels if prices persist in an oversupplied market
  • Higher input cost volatility (crude oil): guidance includes raw material and freight sensitivities, but results are sensitive to macro and demand rather than precise crude timing
  • Chile and South America economic uncertainty: soft results included in total adjusted EBITDA guidance
  • Siding volume pressure from destocking/inventory cycles: elevated shed-customer inventories following January price increases; allocation hangover/visibility into channel inventories noted for ExpertFinish and could pressure early-period volumes
  • Freight rate increases: modest increases observed in Q1; tied to diesel response to crude disruptions

Q&A: Analyst Interest

  • Oil pricing assumption and cost pass-through: Management confirmed guidance does not assume a specific oil price trajectory; manufacturing raw-material effects are larger than freight, with ~75% of manufacturing cost impact landing in Siding due to raw-material-intensive recipes. Guidance reflects near-term observed input levels and contract algorithm pricing behavior.
  • SmartSide builder program scaling and run-rate: Management stated the cited ~100M sq ft SmartSide across 15 of the top 25 homebuilders is a 2026 landing estimate (run-rate), not a historical base. Management avoided naming builders, noting each program meets thresholds and unlocks new Southeast/Southwest markets underpenetrated.
  • Full-year Siding guidance bridge and key swing factors: Management described the guidance drop from midpoint as ~ $50M (~$35M from volume: $70M volume decline at ~50% variable margin) plus ~$15M–$20M from oil-based cost impacts concentrated more in the back half than in Q2.

Sentiment: CAUTIOUS

Note: This summary was synthesized by AI from the LPX Q1 2026 earnings transcript. Financial data is complex; please verify all metrics against official SEC filings before making investment decisions.

📋 Official Regulatory 10-K / 10-Q SEC Filings

Direct authenticated documentation links to audited SEC database reports for LPX.

SEC EDGAR Live Feed
Loading financial data and tables...
📁

SEC Filings (LPX)

© 2026 Stock Market Info — Louisiana-Pacific Corporation (LPX) Financial Profile