Mondelez International, Inc.

Mondelez International, Inc. (MDLZ) Market Cap

Mondelez International, Inc. has a market capitalization of $79.64B.

Price: $62.04

1.05 (1.72%)

Market Cap: 79.64B

NASDAQ · time unavailable

CEO: Dirk Van de Put

Sector: Consumer Defensive

Industry: Food Confectioners

IPO Date: 2001-06-13

Website: https://www.mondelezinternational.com

Mondelez International, Inc. (MDLZ) - Company Information

Market Cap: 79.64B|Sector: Consumer Defensive

Company Profile

Mondelez International, Inc., through its subsidiaries, manufactures, markets, and sells snack food and beverage products in the Latin America, North America, Asia, the Middle East, Africa, and Europe. It provides biscuits, including cookies, crackers, and salted snacks; chocolates; and gums and candies, as well as various cheese and grocery, and powdered beverage products. The company's snack brand portfolio includes Cadbury, Milka, and Toblerone chocolates; Oreo, belVita, and LU biscuits; Halls candies; Trident gums; and Tang powdered beverages. It serves supermarket chains, wholesalers, supercenters, club stores, mass merchandisers, distributors, convenience stores, gasoline stations, drug stores, value stores, and other retail food outlets through direct store delivery, company-owned and satellite warehouses, third party distributors, and other facilities, as well as through independent sales offices and agents, and e-commerce channels. The company was formerly known as Kraft Foods Inc. and changed its name to Mondelez International, Inc. in October 2012. Mondelez International, Inc. was incorporated in 2000 and is headquartered in Chicago, Illinois.

Analyst Sentiment

75%
Strong Buy

From 25 Active Polls

1Y Forecast: $67.00

▲ +8.0% Potential Upside

Consensus Target Metrics

Low Bound

$61

Median

$67

High Bound

$73

Average

$67

Price & Moving Averages

Loading chart...

🎯 Wall Street Analyst Intelligence Report

1-Year structural target targets, chart projections, and sentiment maps.

Average 1Y Target
$67.00
▲ +7.99% Upside
Low Target
$61.00
-2% Risk
Median Target
$67.00
8% Mid
High Target
$73.00
18% Max
Consensus
Buy
31 / 41 Buys

Consensus Trend Projection

Trailing closures vs. 12-month metrics map.

Analyst Vote Distribution

Aggregate institutional coverage sentiment weights.

📊 Historical Valuation Multiples

Real-time Trailing Twelve Month (TTM) momentum side-by-side with discrete quarterly metrics.

Fiscal QuarterTTMQ1 2026Q4 2025Q3 2025Q2 2025Q1 2025Q4 2024Q3 2024Q2 2024
Period EndingTrailing 12MMar 31, 2026Dec 31, 2025Sep 30, 2025Jun 30, 2025Mar 31, 2025Dec 31, 2024Sep 30, 2024Jun 30, 2024
Market Cap ($M)79,63874,29869,38781,43087,33588,27379,95398,64487,617
Enterprise Value ($M)99,73694,39689,665101,996107,336106,86796,974117,552106,463
Price to Earnings Ratio (P/E)30.6533.1726.0927.4034.0654.9011.4528.9136.45
Price/Earnings-to-Growth Ratio (PEG)3.383.242.642.80
Price to Sales Ratio (P/S)2.037.376.618.369.729.488.3210.7210.50
Price to Book Ratio (P/B)3.112.892.693.113.333.422.973.543.16
Price to Free Cash Flow Ratio (P/FCF)30.93479.3434.71194.8129111.60108.3175.8699.74192.57
Enterprise Value to Sales (EV/Sales)9.368.5410.4711.9511.4810.1012.7712.76
Enterprise Value to EBITDA (EV/EBITDA)19.4474.5667.6785.3579.80106.2347.1973.6582.08
Debt to Equity Ratio3.920.840.870.840.820.780.680.730.73

MDLZ Growth Runway Model

Standard long term linear growth fade

Multi-Stage Discounted Cash Flow Sandbox

Market Price$62.04
Intrinsic Value$47.56
Market Alignment
Overvalued by 23.3%relative to calculated intrinsic value
9.00%
Exp: 2%2%
i

Growth runway slowdown

This value provides a time window for the growth rate to decline beyond Stage 1 toward the terminal rate. Longer windows are most useful for companies with high growth starting conditions or strong competitive advantages. This option stretches out the growth rate slowdown across 5, 10, or 15-year steps. A high-growth starting condition (exceeding a 25% initial growth rate) automatically applies a curve decay to simulate realistic, rapid market saturation.
i

Terminal growth rate

With long-term inflation between 3-5%, revenue must grow by that baseline to maintain flat real-world market share. This value sets the permanent terminal growth rate to factor into the valuation beyond the growth slowdown runway toward maturity.

3-Stage Financial Runway Horizon

🧠 Perpetuity Horizon Engine (Stage 3: Post-2035)

Terminal FCF Base$5.56B
Perpetuity TV Value$104.65B
Discounted TV (PV)$44.20B
TV Weighting %58.3%
⚠️
Financial Model Disclaimer & Risk Disclosure: This interactive scenario simulator is an educational sandbox provided strictly for informational and analytical research purposes. Core historical financial statements and consensus estimates are sourced directly via Financial Modeling Prep (FMP). All downstream outputs are entirely deterministic, hypothetical projections generated by combining automated mathematical formulas (including linear interpolation and Gaussian bell-curve decay models) with user-selected variables and third-party financial data inputs. Users assume all liability for trading decisions executed based on these sandbox calculations.

📘 Full Research Report

ℹ️

AI-Generated Research: This report is for informational purposes only.

📘 MONDELEZ INTERNATIONAL INC CLASS A (MDLZ) — Investment Overview

🧩 Business Model Overview

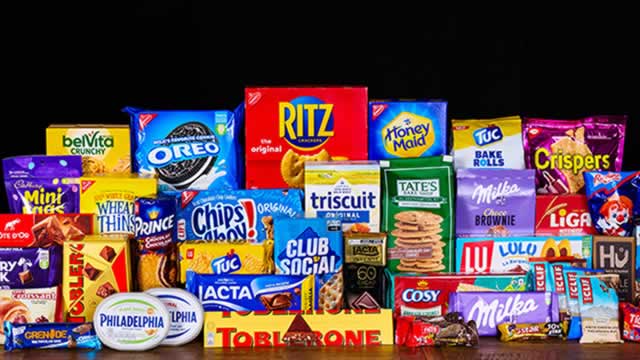
Mondelez International is a global branded snacks and confectionery company that monetizes consumer demand through a scaled end-to-end value chain: upstream sourcing of key ingredients, manufacturing and packaging across a portfolio of plants, and a sales/distribution system that places products with retailers, wholesalers, and foodservice partners. The business model is characterized by high frequency of purchase at the household level, while at the trade level the company relies on strong category relationships—price/mix management, promotional planning, and channel execution—to maintain shelf presence and secure distribution.

Value creation is driven by (i) brand and format choices that support pricing and mix, (ii) operational excellence in procurement and manufacturing, and (iii) commercial discipline in trade terms and promotional effectiveness. These elements work together to sustain cash generation across consumer cycles.

💰 Revenue Streams & Monetisation Model

Revenue is primarily transactional and tied to unit demand and pricing/mix, with monetisation coming from selling packaged goods into retail and out-of-home channels. While the stream is not contractually recurring like software, Mondelez exhibits “repeat purchase” dynamics typical of staples: consumers buy snacks regularly, and the company renews demand through assortment, pack sizes, and marketing support.

Key margin drivers include:

  • Net pricing and mix: product composition across chocolate, biscuits/cookies, gum, candy, and grocery formats influences gross margin through manufacturing complexity and pricing elasticity.
  • Commodity pass-through and cost discipline: ingredient costs (e.g., cocoa, sugar, vegetable oils) create volatility; margin resilience improves where the company can partially offset input inflation via pricing, package engineering, and procurement scale.
  • Operating leverage: fixed-cost absorption across manufacturing and network utilization can improve profitability when volume holds up.

🧠 Competitive Advantages & Market Positioning

Mondelez’s moat is primarily a combination of scale/distribution leverage and intangible assets embedded in long-established brands and product franchises. In branded snacks, switching costs are not “contractual,” but consumers develop habitual preference and retailers depend on proven demand velocity, which makes dislodging successful items operationally and commercially difficult for competitors.

Why it is hard to take share:

  • Retail execution and shelf inertia: brands with consistent trade terms, merchandising support, and predictable demand earn repeat shelf placement, limiting competitor disruption.
  • Procurement and manufacturing scale: scale supports input sourcing, formulation optimization, and production efficiency, which is difficult for smaller regional brands to replicate.
  • Brand-led consumer preference: competitors can introduce new products, but building equivalent distribution and consumer pull typically requires sustained investment and long learning cycles.

Competitive benchmarking (primary peers):

  • Nestlé (global diversified food): Mondelez competes in confectionery and biscuits/snacks but differentiates with a concentrated focus on snacks and confectionery categories.
  • Ferrero (premium confectionery): Ferrero emphasizes premium chocolate and gifting formats; Mondelez competes across broader price tiers and offers scale in mass channels.
  • Danone (nutrition focus) and/or Mars (confectionery): these peers compete for consumer occasions; Mondelez’s positioning is centered on branded snacks/confectionery breadth and scale-driven distribution.

Compared with these rivals, Mondelez’s strategic emphasis lies in scaling branded snack franchises globally while managing a large portfolio that can flex across price tiers and channel demand patterns.

🚀 Multi-Year Growth Drivers

Over a 5–10 year horizon, Mondelez’s growth outlook is supported by durable category demand and the ability to drive mix improvements and value realization within staples. Primary structural drivers include:

  • Emerging market and urbanization tailwinds: expanding consumer spending and shifting diets sustain incremental volume in snacks and confectionery.
  • Premiumization and “better-for-you” within snacks: category growth often comes from higher-quality ingredients, differentiated textures/flavors, and more functional or reduced-sugar/fat variants where demand exists.
  • Package and format innovation: smaller “on-the-go” packs, variety packs, and single-serve formats can improve accessibility and affordability trade-offs.
  • Retail channel complexity and route-to-market optimization: improved execution with modern trade, e-commerce grocery, and convenience formats can lift share where distribution and merchandising matter.
  • Capacity and footprint rationalization: disciplined capital allocation and plant/network optimization support cost efficiency and resilience through input cycles.

⚠ Risk Factors to Monitor

  • Commodity and input cost volatility: cocoa, sugar, and vegetable oil price swings can compress margins if pricing power and pass-through are insufficient.
  • Regulatory and labeling changes: shifts in sugar content regulations, health claims, import/export rules, and ingredient restrictions can alter product economics.
  • Promotional intensity and trade terms: retailer negotiating leverage can increase promotion and discounting, pressuring net pricing.
  • Execution risk in portfolio transformation: rebalancing assortments, reformulating products, and integrating acquisitions/divestitures can create temporary complexity.
  • Brand substitution and private label pressure: while private label exists in many staples categories, the structural impact depends on retailer strategies, consumer price sensitivity, and product differentiation.

📊 Valuation & Market View

Market valuation for large global consumer staples branded food companies typically reflects a mix of quality and stability rather than pure growth. Investors often anchor on:

  • Cash flow durability: recurring-like demand supports discounted cash flow frameworks and enterprise value to operating earnings.
  • Margin trajectory: the market re-rates companies based on gross margin resilience and operating leverage potential as commodity cycles normalize.
  • Price/mix and volume balance: investors focus on the ability to protect net pricing without excessive volume destruction.
  • Capital allocation discipline: sustained reinvestment, debt management, and shareholder returns influence equity risk premium and valuation multiples.

Sector multiples can compress when input cost inflation coincides with weaker pricing power, and expand when management demonstrates credible margin recovery through procurement scale and mix improvements.

🔍 Investment Takeaway

Mondelez’s long-term investment case rests on branded differentiation supported by scale-driven distribution leverage, enabling durable market participation in branded snacks and confectionery. The company’s ability to navigate commodity cycles through procurement strength, operational efficiency, and disciplined commercial execution underpins cash generation. Key investor focus should remain on margin resilience, net pricing discipline, and successful portfolio and channel execution across premium and mass price tiers.


⚠ AI-generated — informational only. Validate using filings before investing.

📰 Market News & Coverage

15 Stories Available

Real-time institutional reporting and market updates for MDLZ.

seekingalpha.com2026-06-04

Mondelez: Buying Quality While Sentiment Remains Fragile (Rating Upgrade)

Mondelez International (MDLZ) is upgraded to Buy, reflecting resilience amid macro headwinds and a valuation offering margin of safety. MDLZ delivered solid Q1 results, maintaining strong market positions and projecting $3B FCF in 2026 despite the previously anticipated cocoa price and inventory pressures. Management expects 2026 to be a weaker year compared to their long-term algorithm, with 0–2% organic net revenue growth, followed by stronger performance as macro pressures ease.

gurufocus.com2026-06-03

OREO CAKESTERS Debuts "The Soft Life," a Nationwide ASMR Pop-Up That Engages the Senses

OREO CAKESTERS Debuts "The Soft Life," a Nationwide ASMR Pop-Up That Engages the Senses PR Newswire EAST HANOVER

prnewswire.com2026-06-03

OREO CAKESTERS Debuts "The Soft Life," a Nationwide ASMR Pop-Up That Engages the Senses

Looking for things to do in NYC and beyond this summer? To celebrate the newly reformulated, softer-than-ever OREO CAKESTERS, the OREO brand is inviting fans on a free, sensory tour across the U.S., starting in New York's Meatpacking District.

zacks.com2026-05-28

Mondelez (MDLZ) Up 2% Since Last Earnings Report: Can It Continue?

Mondelez (MDLZ) reported earnings 30 days ago. What's next for the stock?

gurufocus.com2026-05-28

NEWTONS Debuts New Branding and Packaging, Introducing the Iconic Bar to a New Generation

NEWTONS Debuts New Branding and Packaging, Introducing the Iconic Bar to a New Generation PR Newswire EAST HANOV

prnewswire.com2026-05-28

NEWTONS Debuts New Branding and Packaging, Introducing the Iconic Bar to a New Generation

Updated look celebrates NEWTONS heritage while introducing a bolder, modern expression EAST HANOVER, N.J., May 28, 2026 /PRNewswire/ -- NEWTONS, the Ooey Gooey, Rich and Chewy cookie bar made with real fig, is introducing a refreshed brand identity and updated packaging design.

247wallst.com2026-05-22

Mondelez Stock Inches Toward Golden Cross as Cocoa Relief Fuels Rally

A golden cross, when the 50-day simple moving average climbs above the 200-day SMA, is one of the more closely watched technical signals on Wall Street.

zacks.com2026-05-21

Mondelez's Snacking Demand Looks Resilient Despite Spending Pressure

MDLZ posts 3% organic revenue growth in Q1 as emerging markets lead and core snack categories hold up despite cost pressures.

globenewswire.com2026-05-20

Mondelēz International Declares Regular  Quarterly Dividend of $0.50 per share

CHICAGO, May 20, 2026 (GLOBE NEWSWIRE) -- The Board of Directors of Mondelēz International, Inc. (Nasdaq: MDLZ) today declared a regular quarterly dividend of $0.50 per share of Class A common stock. This dividend is payable on July 14, 2026, to shareholders of record as of the close of business on June 30, 2026.

seekingalpha.com2026-05-20

Mondelez: Profitability Normalization Creates A Major Opportunity (Rating Upgrade)

I upgrade Mondelez (MDLZ) to a buy as profitability shows early signs of improvement and downside risk appears limited. Market sentiment is lagging behind as the overall impact on 2026 results is likely to be limited, but a medium to long-term opportunity exists. With pricing initiatives already in place, investors should also look for a potential stabilization of volumes through the rest of 2026.

gurufocus.com2026-05-19

New SOUR PATCH KIDS CHEWS are Here to Challenge the Candy Status Quo

New SOUR PATCH KIDS CHEWS are Here to Challenge the Candy Status Quo PR Newswire EAST HANOVER, N.J., May 19, 202

zacks.com2026-05-13

Mondelez International's Chocolate Growth: Can the Momentum Continue?

MDLZ's chocolate organic net revenues rise 5.5% in Q1 2026 as pricing offsets volume dips. Europe's trends improve, and new launches sell out.

prnewswire.com2026-05-13

The Zbar Brand Launches New Zbar Oat Bites and Zbar Protein Strawberries 'n Creme Flavored Snack Bars to Help Fuel Adventures

New innovations provide delicious snack time fuel to help power active kids to explore and expand their world EAST HANOVER, N.J., May 13, 2026 /PRNewswire/ -- The Zbar brand today announced the expansion of its kids snacking portfolio with the launch of Zbar Oat Bites and Zbar Protein Snack Bars in a Strawberries 'n Creme flavor.

zacks.com2026-05-12

GLP-1 Wars: Winners & Losers

With its best-in-breed GLP-1 drugs, Eli Lilly is beginning to cement itself as the dominant player in the massive GLP-1 market.

fool.com2026-05-10

XLP vs. PBJ: A Low-Cost Staples Giant Against a Concentrated Food-and-Beverage Specialist

Expense ratio, dividend yield, and portfolio breadth set these consumer staples ETFs apart-see how their strategies and holdings compare.

📊 AI Financial Analysis

Powered by StockMarketInfo
Earnings Data: Q Ending 2026-03-31

"MDLZ reported Q1 2026 revenue of $10.08B and net income of $560M, translating to EPS of $0.44. YoY, revenue grew from $9.31B (Q1’25) to $10.08B (Q1’26), up 8.2%, while net income increased from $402M to $560M (+39.3%). QoQ, revenue declined from $10.50B (Q4’25) to $10.08B (-4.0%), but net income eased only slightly from $665M to $560M (-15.8%). Profitability improved on a YoY basis: Q1’26 net margin was 5.56% vs. 4.32% in Q1’25 (margin expansion), though it softened versus Q4’25 (6.34%). Gross margin was 27.81% in Q1’26 vs. 26.09% in Q1’25, indicating better cost/revenue structure year over year. Cash flow quality remained solid but was seasonally volatile: operating cash flow was $467M and free cash flow was $155M, down from Q4’25 FCF of $2.00B, consistent with working-capital and timing effects. Shareholder returns remain a key pillar—Q1 cash flow reflects dividends of $644M, while buybacks were not recorded in this quarter. Stock performance is not supportive: the shares are down 13.9% over the past year, reducing total shareholder return momentum despite EPS power."

Revenue Growth

Positive

Revenue rose 8.2% YoY ($9.31B to $10.08B) but fell 4.0% QoQ ($10.50B to $10.08B), showing a positive annual trend with seasonal quarterly softness.

Profitability

Positive

Net margin expanded YoY to 5.56% (from 4.32%). QoQ net margin contracted vs. Q4’25 (6.34%), but operating profitability remained positive with EPS increasing to $0.44.

Cash Flow Quality

Fair

Operating cash flow of $467M and FCF of $155M were materially lower than Q4’25 (FCF $2.00B). Dividends were well supported in the quarter, but cash conversion appears less consistent quarter to quarter.

Leverage & Balance Sheet

Neutral

Total assets were $71.1B in Q1’26 vs. $71.5B in Q4’25, with equity steady at ~$25.8B. Net debt was roughly flat ($20.1B vs. $20.3B), suggesting resilience but not clear deleveraging.

Shareholder Returns

Fair

Dividend payments were evident ($644M). However, buybacks were not recorded in Q1’26 and the stock is down 13.9% over 1 year, weighing on total return momentum.

Analyst Sentiment & Valuation

Positive

Consensus price target is $66.46 vs. current price $57.25, implying upside (~16%). While trailing performance has been weak, expectations appear constructive.

Disclaimer:This analysis is AI-generated for informational purposes only. Accuracy is not guaranteed and this does not constitute financial advice.

Fundamentals Overview

Loading fundamentals overview...

MDLZ delivered a strong start in both developed and emerging markets, with Q1 emerging-market growth of +6.3% (volume/mix +0.5%) supported by robust Easter and broad category/geography strength. Developed markets improved versus expectations, including Europe chocolate share gains driven by Biscoff and Easter execution, while U.S. demand remains fragile amid low consumer confidence and value/channel shift dynamics. Financially, gross margins were down 270 bps, but management framed results around a ~$350m+ inventory phasing drag that aligned with guidance, offset by productivity and supply chain execution. Despite being ahead in Q1, management reaffirmed EPS for the year due to incremental Middle East-related cost headwinds—extra costs to produce/deliver brands and oil/packaging impacts that are partially covered yet still materialize given regulated market limitations. Outlook remains constructive, with guidance caution anchored in energy/inflation sensitivity, cocoa surplus risk, and the need to keep converting share gains into sustainable momentum (including through automation in North America biscuits).

AI IconGrowth Catalysts

  • Biscoff partnership momentum: continuing strong performance in Europe; biscuit and chocolate launches in multiple markets
  • Very strong Easter season driving share gains and category performance (Europe chocolate; Australia/NZ chocolate; emerging markets overall)
  • North America share gains in crackers led by Ritz; supportive innovations including Ritz Drizzled and Ritz Bits
  • Well-being and premium traction: Perfect Bar/protein range and Clif Builders bar (including low sugar) plus Oreo added-benefits (gluten-free in U.S.; zero added sugar in China and launched in U.S.)
  • Emerging markets category resilience and growth: India (double-digit chocolate and biscuits; Biscoff in biscuits line sold out); China mid-single digit with strong Chinese New Year; cakes & pastries in Evirth (high single digit)

Business Development

  • Biscoff partnership (continued expansion into biscuits and chocolate with Biscoff cream/crumbs; emerging market launches; chocolate range collaboration expected to keep expanding)
  • Evirth acquisition in cakes and pastries (referenced as delivering high single-digit growth; continued distribution increases)
  • Sour Patch Kids performance cited as delivering strong prospects (double-digit growth implied for the year) and Chews as an incremental innovation

AI IconFinancial Highlights

  • Emerging markets Q1 growth: +6.3% (EM is ~40% of business); volume/mix +0.5% with Argentina excluded ~1% volume growth
  • Gross margin: down 270 basis points, while management referenced inventory phasing drag headwind of ~$350m (slightly more than that); they stated expectations and guidance were aligned for that headwind
  • Leverage: excluding downsizing, volume/mix slightly positive; pricing in line with expectations; costs improving from productivity and supply chain execution
  • Middle East crisis: extra costs and a cost headwind coming out of Middle East situation; oil cost impact noted (though covered for the year) and regulated markets limiting further oil/packaging protection
  • Guidance posture: reaffirmed EPS outlook despite being ahead in Q1; rationale was to absorb incremental Middle East-related cost headwind and maintain bottom-line clarity

AI IconCapital Funding

    AI IconStrategy & Ops

    • Europe: retailer negotiations largely complete; robust Easter campaign with promotions lined up for remainder of year; reset price points in select markets showing positive effect
    • Chocolate competitive stabilization: cocoa improved; management cited no current price movement and expectation to wait for main crop implications in 2H
    • Innovation strategy: emphasized hitting right price points on core ranges, running big in-store activations, and using ‘bigger and fewer bets’ on improvement platforms plus standout innovations
    • North America biscuits modernization: ~60% of U.S. network ‘state-of-the-art’; remaining plants with high waste/productivity below expectations to be brought up to speed; shift to simpler lines where appropriate
    • Route-to-market/supply chain: plan to bring certain co-manufactured proven volume platforms in-house (save money; invest in packaging capabilities for shifting multipacks and club formats)
    • DSD network automation: described 4–5 distribution centers and 55 branches; automation/AI fulfillment centers to speed delivery to point of sale and reduce stock/cost in branches

    AI IconMarket Outlook

    • Europe/Easter and promotions: retailers ‘almost entirely done’ and remainder of year promotions lined up
    • Cocoa outlook: management cited industry coverage exceeding ~10 months; believes ~2,500 (current cocoa level referenced) better reflects supply/demand; expects another year of surplus (grinding ‘negative’ though better than anticipated)
    • 2H focus: monitoring electricity/energy impacts in Europe from Middle East conflict; management expects consumer vigilance and potential inflation-driven effects

    AI IconRisks & Headwinds

    • Middle East conflict: additional costs (extra cost to deliver brands), energy-driven inflation pressures, and downstream impacts to fertilizers/packaging/oil; limited hedging/protection in regulated markets
    • Oil cost and packaging costs: covered for the remainder of the year, but a cost headwind still expected to materialize in the remainder of the year due to regulated constraints
    • Consumer fragility in developed markets (especially Europe) and low confidence in U.S.; lower income consumers trading down to lower unit prices
    • Cocoa market uncertainty: main crop implications still pending; potential for another year of surplus given prolonged industry coverage (>10 months)
    • U.S. category remains not projected to improve meaningfully; sequential recovery framed as share gains rather than category growth

    Q&A: Analyst Interest

    • Topic: Gross margin drivers going forward after inventory phasing drag; how management reconciles Q1 results vs expectations. Management attributed the quarter’s gross margin move to ~$350m+ inventory phasing headwind, with upside from volume/mix leverage, China profitability, procurement/manufacturing execution and productivity offsets, while Middle East-related costs drive the remainder-year headwind despite coverage.
    • Topic: Why EPS guidance was reaffirmed despite being ahead in Q1, and what defines ‘swallow it’ vs upside reinvestment. Management said Middle East crisis created extra costs and oil/packaging profitability pressure (covered for year but constrained by regulated markets), so they confirmed clear EPS; if upside emerges, they intend to reinvest to sustain momentum and support strong 2027 EPS growth.
    • Topic: North America biscuits supply chain modernization plan—what changes operationally and where the growth opportunity comes from. Management described ~60% of the network state-of-the-art, but remaining plants with high waste need productivity improvements; they will simplify lines, bring co-manufactured platforms in-house to save money, invest in multipacks, and automate DSD centers/AI fulfillment to reduce stock and branch costs.

    Sentiment: MIXED

    Note: This summary was synthesized by AI from the MDLZ Q1 2026 earnings transcript. Financial data is complex; please verify all metrics against official SEC filings before making investment decisions.

    📋 Official Regulatory 10-K / 10-Q SEC Filings

    Direct authenticated documentation links to audited SEC database reports for MDLZ.

    SEC EDGAR Live Feed
    Loading financial data and tables...
    📁

    SEC Filings (MDLZ)

    © 2026 Stock Market Info — Mondelez International, Inc. (MDLZ) Financial Profile