Metallus Inc.

Metallus Inc. (MTUS) Market Cap

Metallus Inc. has a market capitalization of $818.4M.

Price: $19.66

-0.48 (-2.38%)

Market Cap: 818.40M

NYSE · time unavailable

CEO: Michael S. Williams

Sector: Basic Materials

Industry: Steel

IPO Date: 2014-06-19

Website: https://www.metallus.com

Metallus Inc. (MTUS) - Company Information

Market Cap: 818.40M|Sector: Basic Materials

Company Profile

Metallus Inc. manufactures and sells alloy steel, and carbon and micro-alloy steel products in the United States and internationally. The company offers special bar quality (SBQ) bars, seamless mechanical tubes, precision steel components, and billets that are used in gears, hubs, axles, crankshafts and motor shafts, oil country drill pipes, bits and collars, bearing races and rolling elements, bushings, fuel injectors, wind energy shafts, anti-friction bearings, artillery and mortar bodies, and other applications. It also provides custom-make precision steel components. It offers its products and services to the automotive, energy, industrial equipment, mining, construction, rail, aerospace and defense, heavy truck, agriculture, and power generation sectors. The company was formerly known as TimkenSteel Corporation and changed its name to Metallus Inc. in February 2024. Metallus Inc. was founded in 1899 and is headquartered in Canton, Ohio.

Analyst Sentiment

67%
Buy

From 2 Active Polls

Consensus Target Matrix

Data feed parsing pending...

Price & Moving Averages

Loading chart...

🎯 Wall Street Analyst Intelligence Report

1-Year structural target targets, chart projections, and sentiment maps.

Average 1Y Target
$20.64
▲ +5.00% Upside
Low Target
$14.75
-25% Risk
Median Target
$20.05
2% Mid
High Target
$24.57
25% Max
Consensus
Hold
1 / 5 Buys

Consensus Trend Projection

Trailing closures vs. 12-month metrics map.

Analyst Vote Distribution

Aggregate institutional coverage sentiment weights.

📊 Historical Valuation Multiples

Real-time Trailing Twelve Month (TTM) momentum side-by-side with discrete quarterly metrics.

Fiscal QuarterTTMQ1 2026Q4 2025Q3 2025Q2 2025Q1 2025Q4 2024Q3 2024Q2 2024
Period EndingTrailing 12MMar 31, 2026Dec 31, 2025Sep 30, 2025Jun 30, 2025Mar 31, 2025Dec 31, 2024Sep 30, 2024Jun 30, 2024
Market Cap ($M)818681716694647577599639885
Enterprise Value ($M)728591574518472412376409635
Price to Earnings Ratio (P/E)282.7031.55-12.5121.4343.73110.99-7.00-27.0848.08
Price/Earnings-to-Growth Ratio (PEG)2.0650.215.096.67-1.20
Price to Sales Ratio (P/S)0.692.212.682.272.122.062.492.813.00
Price to Book Ratio (P/B)1.201.001.041.000.940.840.870.901.20
Price to Free Cash Flow Ratio (P/FCF)-10.47-13.21-19.24-108.4838.07-8.69-460.86-19.43-152.54
Enterprise Value to Sales (EV/Sales)1.922.151.691.551.471.561.802.15
Enterprise Value to EBITDA (EV/EBITDA)11.9535.58-106.2519.4920.4524.12-36.8156.8631.42
Debt to Equity Ratio-1.490.020.020.020.020.020.020.030.03

MTUS Growth Runway Model

Standard long term linear growth fade

Multi-Stage Discounted Cash Flow Sandbox

Market Price$19.66
Intrinsic Value$19.65
Market Alignment
Overvalued by 0.1%relative to calculated intrinsic value
9.00%
Exp: -2%-2%
i

Growth runway slowdown

This value provides a time window for the growth rate to decline beyond Stage 1 toward the terminal rate. Longer windows are most useful for companies with high growth starting conditions or strong competitive advantages. This option stretches out the growth rate slowdown across 5, 10, or 15-year steps. A high-growth starting condition (exceeding a 25% initial growth rate) automatically applies a curve decay to simulate realistic, rapid market saturation.
i

Terminal growth rate

With long-term inflation between 3-5%, revenue must grow by that baseline to maintain flat real-world market share. This value sets the permanent terminal growth rate to factor into the valuation beyond the growth slowdown runway toward maturity.

3-Stage Financial Runway Horizon

🧠 Perpetuity Horizon Engine (Stage 3: Post-2035)

Terminal FCF Base$0.05B
Perpetuity TV Value$0.93B
Discounted TV (PV)$0.39B
TV Weighting %55.7%
⚠️
Financial Model Disclaimer & Risk Disclosure: This interactive scenario simulator is an educational sandbox provided strictly for informational and analytical research purposes. Core historical financial statements and consensus estimates are sourced directly via Financial Modeling Prep (FMP). All downstream outputs are entirely deterministic, hypothetical projections generated by combining automated mathematical formulas (including linear interpolation and Gaussian bell-curve decay models) with user-selected variables and third-party financial data inputs. Users assume all liability for trading decisions executed based on these sandbox calculations.

📘 Full Research Report

ℹ️

AI-Generated Research: This report is for informational purposes only.

📘 METALLUS INC (MTUS) — Investment Overview

🧩 Business Model Overview

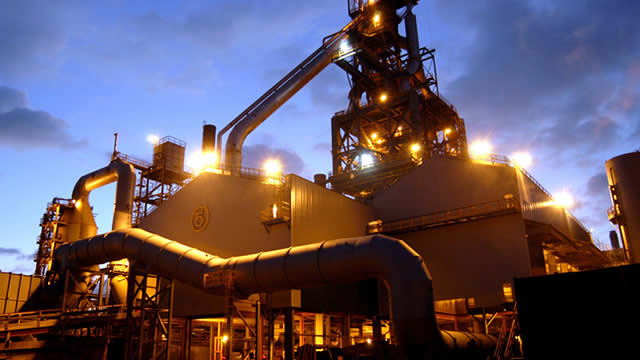
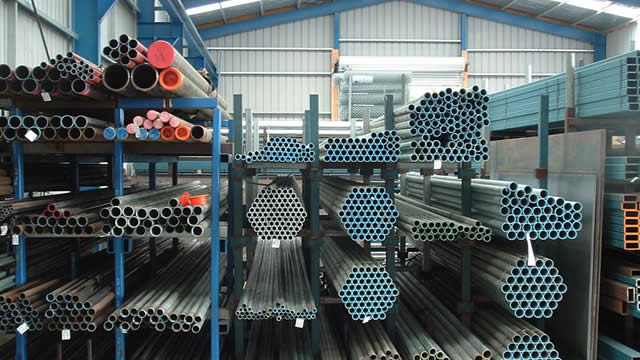
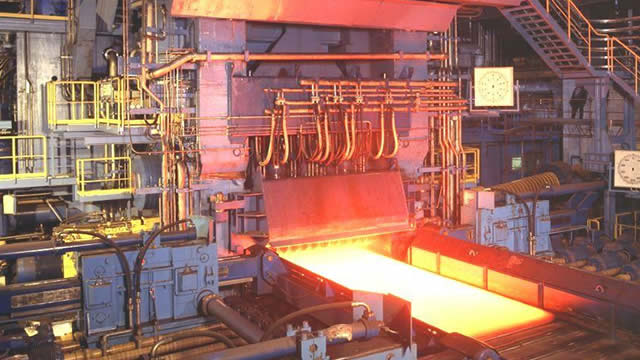
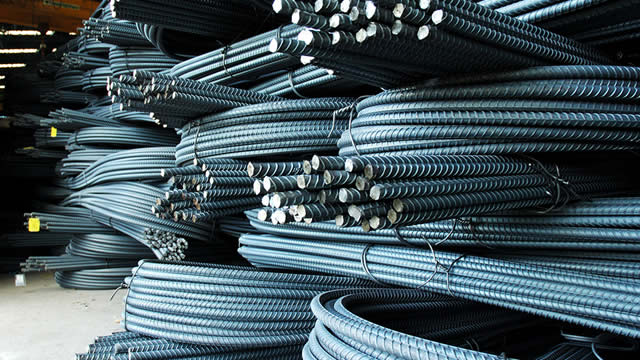
METALLUS operates in the metals recycling value chain, converting heterogeneous scrap into saleable, higher-grade inputs for steel and metals producers. The process typically includes (1) sourcing scrap from industrial generators and collection channels, (2) sorting and processing scrap into standardized specifications, and (3) selling processed material to end-market customers (e.g., mills and manufacturers) where it functions as a substitute feedstock.

The economic “engine” is geographic and operational: access to supply, efficient logistics, and processing capability determine both the quality/yield of output and the delivered cost to customers. Because scrap supply and quality are fragmented across regions, a dense network of yards and routes can materially improve feedstock economics and stabilize throughput.

💰 Revenue Streams & Monetisation Model

METALLUS’s revenue is predominantly transaction-driven, tied to volumes processed/sold and prevailing commodity conditions. Monetisation generally comes from:

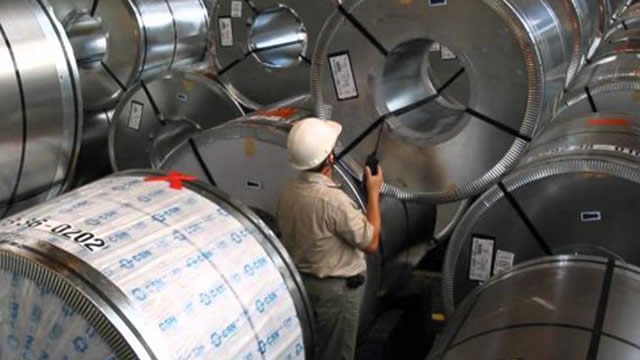
  • Sales of processed scrap/metal products: Revenue based on grade/quality and contract or spot pricing relative to end-market benchmarks.
  • Processing services: Fees embedded in the spread between purchased scrap and sold processed material, reflecting labor, equipment utilization, and processing margins.
  • Trading and specification management: Margin capture from aggregating supply, improving material classification, and meeting customer specifications reliably.

Primary margin drivers include (1) yield and out-turn rates (how much sellable, higher-grade material is produced from heterogeneous inputs), (2) operating efficiency and asset utilization (fixed-cost absorption across throughput), (3) logistics cost per ton, and (4) the relationship between scrap acquisition costs and end-market pricing for substitute feedstock. While revenue is not inherently recurring, customer and supplier relationships can be “sticky” through operational reliability, pricing mechanics, and the ability to consistently meet specs.

🧠 Competitive Advantages & Market Positioning

The moat in metals recycling is typically less about intangible brand power and more about geographic cost advantage and logistical infrastructure paired with processing know-how. METALLUS benefits from:

  • Logistical infrastructure & routing density: Proximity to scrap supply reduces inbound freight costs and improves the economics of sourcing. Efficient yard networks lower handling and turnaround costs.
  • Low-cost feedstock access: Recycling economics depend on acquiring sufficient volumes at competitive delivered costs. Scale and supplier relationships can improve access to desirable scrap streams.
  • Processing and specification capability: Sorting, shredding, and blending/processing capabilities reduce contamination risk and improve output grade, strengthening customer acceptance and contract repeatability.
  • Operational execution: Consistent quality and reliable delivery can reduce customer friction, particularly for mills that need predictable feedstock characteristics.

Competitive benchmarking:

  • Sims Metal Management (global recycler): Competes on scale and global sourcing/trading reach, with a broad footprint across regions.
  • Schnitzer Steel (U.S.-focused recycler): Strong in U.S. recycling with extensive yards and customer relationships, competing heavily on inbound logistics and conversion yields.
  • Commercial Metals Company (CMC): Operates across the recycling and steel production ecosystem, often linking scrap procurement economics directly to mill demand.

METALLUS’s positioning versus these players is centered on optimizing regional infrastructure—yard density, procurement routes, and processing capacity—to achieve favorable delivered economics for scrap input streams and to supply processed material at specifications end-markets require. Where larger or vertically integrated peers may have additional scale or downstream demand linkage, the competitive differentiator often remains the cost and reliability of converting local scrap into usable feedstock.

🚀 Multi-Year Growth Drivers

Over a 5–10 year horizon, growth is driven by structural demand for recycled metals and by recycling’s role as a flexible, lower-cost input channel:

  • Structural substitution of primary metals with recycled feedstock: Environmental and cost pressures support continued recycling penetration, particularly where scrap becomes a practical alternative to primary production.
  • Capacity rationalization in metals supply chains: Cyclical primary production and downtime dynamics often increase the relative attractiveness of dependable secondary supply.
  • Operational leverage from throughput and processing optimization: Incremental volumes can improve fixed-cost absorption in processing and logistics, provided sourcing and yields remain disciplined.
  • Quality and specification discipline: As customers tighten input requirements (grade consistency, contamination control), operators with stronger processing performance can defend margins and customer relationships.

TAM expansion for recyclers is less about “new customers” than about increasing share of the accessible scrap pool through logistics and conversion capability, while maintaining acceptable out-turn and operating discipline through commodity cycles.

⚠ Risk Factors to Monitor

  • Commodity and spread volatility: Recycling margins depend on the relationship between scrap acquisition costs and end-market metal prices. Adverse spreads can compress profitability.
  • Feedstock quality and contamination risk: Higher contamination reduces yield, can lead to customer rejections or reprocessing costs, and can increase regulatory exposure.
  • Regulatory and permitting constraints: Environmental rules governing scrap handling, emissions, and hazardous materials can raise compliance costs or limit facility operations.
  • Capital intensity and asset utilization: Maintaining and upgrading processing and logistics assets is capital demanding; profitability depends on sustaining utilization through demand fluctuations.
  • Competitive sourcing pressure: Regional competition for the same scrap streams can raise delivered acquisition costs faster than selling prices adjust.
  • Downstream demand cyclicality: Steel and metals production levels affect scrap demand; weaker industrial activity can reduce volumes and pricing.

📊 Valuation & Market View

Markets typically value metal recycling businesses on EV/EBITDA and broader cash generation metrics, adjusted for commodity cycle effects. The key valuation sensitivities tend to be:

  • Margin durability (ability to maintain processing and logistics spreads through cycles)
  • Throughput and asset utilization (operating leverage vs. fixed-cost absorption)
  • Working capital intensity (inventory and payables/receivables patterns can amplify cycle-driven cash flow swings)
  • Leverage and liquidity (recycling can be cash-flow volatile when spreads move materially)

Investors generally underwrite these companies by normalizing for the commodity cycle and assessing whether infrastructure and execution translate into sustained competitive conversion economics.

🔍 Investment Takeaway

METALLUS’s long-term investment case rests on a structural advantage common to quality recyclers: geographic access to feedstock, logistics and yard/process infrastructure, and processing capability that improves yield and specification outcomes. While earnings are inherently cyclical due to commodity spreads, the durable value proposition is operational—converting local scrap economics into reliable, spec-compliant feedstock at competitive delivered costs.


⚠ AI-generated — informational only. Validate using filings before investing.

📰 Market News & Coverage

15 Stories Available

Real-time institutional reporting and market updates for MTUS.

zacks.com2026-05-28

Metallus (MTUS) Shows Fast-paced Momentum But Is Still a Bargain Stock

Metallus (MTUS) made it through our 'Fast-Paced Momentum at a Bargain' screen and could be a great choice for investors looking for stocks that have gained strong momentum recently but are still trading at reasonable prices.

zacks.com2026-05-25

MTUS vs. NWPX: Which Stock Is the Better Value Option?

Investors looking for stocks in the Steel - Speciality sector might want to consider either Metallus (MTUS) or NWPX Infrastructure (NWPX). But which of these two companies is the best option for those looking for undervalued stocks?

marketbeat.com2026-05-12

Metallus Q1 Earnings Call Highlights

Metallus NYSE: MTUS reported higher first-quarter 2026 sales and profitability as improving demand, stronger shipment volumes and operational gains helped offset higher utility and labor costs, executives said on the company's earnings call.

zacks.com2026-05-07

MTUS vs. NWPX: Which Stock Should Value Investors Buy Now?

Investors interested in stocks from the Steel - Speciality sector have probably already heard of Metallus (MTUS) and NWPX Infrastructure (NWPX). But which of these two stocks is more attractive to value investors?

seekingalpha.com2026-05-05

Metallus Inc. (MTUS) Q1 2026 Earnings Call Transcript

Metallus Inc. (MTUS) Q1 2026 Earnings Call Transcript

zacks.com2026-05-04

Metallus (MTUS) Tops Q1 Earnings and Revenue Estimates

Metallus (MTUS) came out with quarterly earnings of $0.18 per share, beating the Zacks Consensus Estimate of $0.13 per share. This compares to earnings of $0.07 per share a year ago.

prnewswire.com2026-05-04

Metallus Announces First-Quarter 2026 Results

Net sales of $308.3 million, up 10% compared to prior-year first quarter, and net income of $5.4 million Adjusted EBITDA of $24.6 million, an increase of 39% compared to prior-year first quarter Invested $24.7 million in strategic capital expenditures and $ 4.3 million to repurchase common shares Continued year ‑ over ‑ year growth in the order book underscores stronger demand First blooms successfully reheated and rolled on new bloom reheat furnace Cash and cash equivalen ts of $104.0 million with total liquidity (1) of $374.7 million as of March 31, 2026 CANTON, Ohio, May 4, 2026 /PRNewswire/ -- Metallus (NYSE: MTUS), a leader in high-quality specialty metals, manufactured components and supply chain solutions, today reported first-quarter 2026 net sales of $308.3 million and net income of $5.4 million, or $0.13 per diluted share. On an adjusted basis(2), the first-quarter 2026 net income was $7.7 million, or $0.18 per diluted share, and adjusted EBITDA was $24.6 million.

defenseworld.net2026-04-27

Critical Review: Huadi International Group (NASDAQ:HUDI) and Metallus (NYSE:MTUS)

Metallus (NYSE: MTUS - Get Free Report) and Huadi International Group (NASDAQ: HUDI - Get Free Report) are both small-cap basic materials companies, but which is the superior stock? We will contrast the two businesses based on the strength of their risk, earnings, dividends, analyst recommendations, institutional ownership, valuation and profitability. Profitability This table compares Metallus and

defenseworld.net2026-04-17

Huadi International Group (NASDAQ:HUDI) versus Metallus (NYSE:MTUS) Financial Contrast

Huadi International Group (NASDAQ: HUDI - Get Free Report) and Metallus (NYSE: MTUS - Get Free Report) are both small-cap basic materials companies, but which is the superior stock? We will contrast the two companies based on the strength of their earnings, risk, profitability, dividends, valuation, analyst recommendations and institutional ownership. Institutional and Insider Ownership 0.2% of

prnewswire.com2026-04-14

Metallus Announces First-Quarter 2026 Earnings Webcast Details

CANTON, Ohio, April 14, 2026 /PRNewswire/ -- Metallus (NYSE: MTUS), a leader in high-quality specialty metals, manufactured components, and supply chain solutions, will release its first-quarter 2026 results on Monday, May 4, after the market closes on the New York Stock Exchange. The company will provide live Internet listening access to its conference call with the financial community scheduled for Tuesday, May 5, 2026, at 9:00 a.m.

defenseworld.net2026-04-13

Huadi International Group (NASDAQ:HUDI) and Metallus (NYSE:MTUS) Head to Head Contrast

Huadi International Group (NASDAQ: HUDI - Get Free Report) and Metallus (NYSE: MTUS - Get Free Report) are both small-cap basic materials companies, but which is the better investment? We will compare the two businesses based on the strength of their earnings, profitability, risk, analyst recommendations, dividends, valuation and institutional ownership. Risk and Volatility Huadi International Group

defenseworld.net2026-03-28

Metallus Inc. (NYSE:MTUS) Receives $24.00 Consensus PT from Analysts

Metallus Inc. (NYSE: MTUS - Get Free Report) has been assigned a consensus recommendation of "Reduce" from the five research firms that are currently covering the firm, MarketBeat Ratings reports. Two equities research analysts have rated the stock with a sell recommendation, two have given a hold recommendation and one has issued a buy recommendation on

defenseworld.net2026-03-09

American Century Companies Inc. Acquires 37,552 Shares of Metallus Inc. $MTUS

American Century Companies Inc. raised its stake in shares of Metallus Inc. (NYSE: MTUS) by 2.5% during the undefined quarter, according to its most recent filing with the SEC. The firm owned 1,539,129 shares of the company's stock after acquiring an additional 37,552 shares during the period. American Century Companies Inc. owned approximately

seekingalpha.com2026-02-25

Metallus Share Price Pullback Bring New Opportunity For Long-Term Investors

Metallus upgraded to Strong Buy with a $32/share price target, reflecting optimism on 2026 growth drivers and undervaluation. MTUS is positioned for volume and pricing tailwinds as new production ramps up, supported by robust aerospace & defense demand and DoD munitions contracts. Operational enhancements, including automation and new furnaces, are set to boost melt utilization and cash flow positive status by e2h26.

seekingalpha.com2026-02-20

Metallus Inc. (MTUS) Q4 2025 Earnings Call Transcript

Metallus Inc. (MTUS) Q4 2025 Earnings Call Transcript

📊 AI Financial Analysis

Powered by StockMarketInfo
Earnings Data: Q Ending 2026-03-31

"MTUS reported Q1’26 revenue of $308.3M and net income of $5.4M (EPS $0.13). Revenue grew +10.0% YoY (vs. $280.5M in Q1’25) and expanded +15.3% QoQ (vs. $267.3M in Q4’25). Net income swung to profit: +303.4% YoY (vs. $1.3M in Q1’25) and turned positive QoQ from a loss of $(14.3)M in Q4’25. Profitability improved sequentially: net margin rose to 1.75% from -5.35% in Q4’25 and up from 0.46% in Q1’25, while gross margin also expanded (8.14% vs. 2.25% in Q4’25). Cash flow quality remains volatile. Operating cash flow was -$26.9M in Q1’26 and free cash flow was -$51.6M, despite positive earnings—suggesting working-capital or non-cash swings. Balance sheet resilience is a relative strength: equity is stable at ~$683M, leverage is low with net debt of -$90.8M (net cash position), and liquidity eased but remains adequate (cash $104.0M; current ratio ~1.73). Total shareholder return tailwind is strong given price momentum: MTUS is up 41.57% over the past year (no dividend shown; buybacks not reported). Analyst valuation inputs were unavailable (no price target provided), so the score weighs momentum and fundamentals improvement more than target upside."

Revenue Growth

Good

Revenue +10.0% YoY and +15.3% QoQ in Q1’26, indicating accelerating top-line momentum after a softer Q4’25.

Profitability

Positive

Net income turned positive QoQ (from -$14.3M to +$5.4M) and improved YoY (+303%). Net margin rose to 1.75% from -5.35% in Q4’25, though margins are still below Q3’25 levels.

Cash Flow Quality

Caution

Despite earnings, operating cash flow was -$26.9M and free cash flow -$51.6M in Q1’26, highlighting inconsistency vs prior quarters.

Leverage & Balance Sheet

Positive

Low leverage with net cash improving vs Q4’25 (net debt -$90.8M vs -$141.8M). Total assets steady around ~$1.14B and equity stable near ~$683M.

Shareholder Returns

Strong

Strong 1-year price momentum: +41.57% 1y_change. No dividend; buybacks not indicated in cash flow this quarter.

Analyst Sentiment & Valuation

Caution

No analyst price target was provided; valuation signals (e.g., earnings/FCF multiples) are less reliable due to cash-flow volatility.

Disclaimer:This analysis is AI-generated for informational purposes only. Accuracy is not guaranteed and this does not constitute financial advice.

Fundamentals Overview

Loading fundamentals overview...

MTUS’s Q1 2026 results show improving demand visibility and execution leverage: net sales rose 10% to $308.3M and adjusted EBITDA increased 39% to $24.6M, driven by higher shipments, better price/mix, improved raw material spreads, and better fixed-cost absorption despite higher utilities and union cost step-up. Operationally, the planned shutdown investments are translating into higher melt utilization and a major capacity/quality step-up: the new bloom reheat furnace demonstrated ~150 tons/hour vs ~100 on legacy assets, with full operational timing expected early-to-mid Q3 (reheat) and late Q3 (roller). Lead times pushed into late Q3, and management reiterated order book growth (40%+, ~90k tons YoY) as the basis for continued 2026 momentum. Guidance is modest: Q2 shipments low single-digit sequential growth and modestly higher adjusted EBITDA. Key watch items are execution around expanding lead times, energy market volatility, and ongoing timing/variability for A&D ramp-up.

AI IconGrowth Catalysts

  • Order book grew year over year by 40%+ (about 90k more tons vs prior year) supporting steady demand and inventory positioning to service late-Q2 to Q3 shipments
  • Planned shutdown investments raised melt utilization sequentially and year over year, improving production volume and cost absorption
  • New bloom reheat furnace and roller furnaces: demonstrated ~150 tons/hour run rate vs ~100 tons/hour legacy with improved temperature uniformity; fully operational expected early-to-mid Q3 (reheat) and late Q3 (roller)
  • U.S. primary-steel competitiveness supported by Section 232 tariffs; 50% tariff on imported primary steel remains in place

Business Development

  • Awarded a contract to begin producing tubing for new rocket motors for advanced weapon systems (defense supply chain, new entrant; confidentiality limits naming)
  • Won two additional automotive programs with existing customers during the quarter (light truck/SUV transmission programs; additional emerging platforms)

AI IconFinancial Highlights

  • Net sales: $308.3M in Q1 2026, up $27.8M (+10%) year over year, primarily from higher shipments across most end markets
  • Adjusted EBITDA: $24.6M, up +$6.9M (+39%) year over year
  • Profit drivers: higher shipments, better price/mix, higher raw material spread, and improved fixed-cost leverage on higher production volume; partially offset by higher utility cost and a partial quarter of increased costs from ratified union contract
  • Net income: $5.4M ($0.13 diluted EPS); adjusted net income $7.7M ($0.18 adjusted diluted EPS)
  • Lead times expanded into late Q3 for VARs and seamless mechanical tubing, signaling demand strength
  • Q2 2026 outlook: shipments expected modestly higher sequentially in low single digits; adjusted EBITDA expected modestly higher sequentially and year over year

AI IconCapital Funding

  • Share repurchases: ~277k shares for $4.3M in Q1 2026
  • Remaining authorization: $85.4M at end of March 2026
  • Cash & equivalents: $104M at 03/31/2026
  • Total liquidity: $375M at 03/31/2026; no outstanding borrowings
  • Government funding: $5.9M received in Q1 and $9.5M received in April; additional ~$2M expected in 2026 tied to final milestone; nearly $100M total funding agreement supporting U.S. Army munitions production
  • Pension contributions: $19.8M required in Q1 2026; additional ~$5.0M in April; expected ~$5.0M remaining in 2026; required pension contributions expected to decrease by nearly 60% vs 2025

AI IconStrategy & Ops

  • Expanded operational system improvements into additional reliability and throughput areas; institutionalized systems to identify issues faster and drive accountability
  • Safety management system maturing toward leading indicators: stronger proactive reporting, increased near-miss identification, and targeted capability building in cranes/rigging/LOTO/machine guarding
  • Sequential utilization improvement expected in Q2 supported by strong order book
  • Manufacturing cost expected to improve sequentially by ~$2M in Q2, netting out the full-quarter run-rate cost increase from ratified union contract

AI IconMarket Outlook

  • Defense: near-term $250M annualized run-rate revenue expectation referenced; management expects variability lumpy by quarter but remains confident in fundamentals
  • Q2 2026: shipments modestly higher sequentially (low single digits %); average melt utilization rate expected to increase sequentially; price actions gradual with greater impact in 2H 2026
  • Full-year 2026 adjusted effective income tax rate expected at 27–30%
  • Price actions announced through first four months of 2026: bar pricing +$120/ton across two actions (phased by customer promise dates); tube pricing averaging ~+$100/ton across product mix for new/business not under annual price agreements (~30% of annual volume)

AI IconRisks & Headwinds

  • Lead times expanding into late Q3 indicates demand strength but can create execution risk if operating cadence slips
  • Energy end market remains cautious; producers seeking greater confidence in long-term oil prices before materially increasing investment
  • Geopolitical conflict and global uncertainty contribute to energy market volatility
  • Automotive demand is steady, but tariff changes could affect broader market behavior (management did not indicate meaningful negative impact in discussion of electrical costs/contract specifics)
  • Union contract-driven cost increases (partially offset by Q2 cost absorption and higher utilization); utilities cost increased vs favorable prior-year electricity contract

Q&A: Analyst Interest

  • Inventory/working-capital build: Management said Q1 inventory is built to align with the order book demand into Q2 given lead times extending to mid- to late-Q3. They emphasized year-over-year order book growth (40%+, ~90k tons) and said it reflects timing, not slower end markets, and is aligned to ship on time.
  • Union contract and the ~$2M manufacturing improvement: Management clarified the ~$2M sequential manufacturing cost improvement is net of the full-quarter run-rate cost increase from the ratified union contract. John explicitly described it as an all-in increase offsetting the wages, so the net benefit remains positive after the labor cost step-up.
  • A&D/Army munitions timing and the $250M run-rate: Management acknowledged the facility timeline could be lumpy due to downstream supply chain and ramp-up, but they reaffirmed confidence in hitting the $250M annualized run-rate for the year. They cited ramping throughput at other facilities, current shell production levels rising toward 100k/month, and offsetting ramp gaps via other weapon system applications.

Sentiment: MIXED

Note: This summary was synthesized by AI from the MTUS Q1 2026 earnings transcript. Financial data is complex; please verify all metrics against official SEC filings before making investment decisions.

📋 Official Regulatory 10-K / 10-Q SEC Filings

Direct authenticated documentation links to audited SEC database reports for MTUS.

SEC EDGAR Live Feed
Loading financial data and tables...
📁

SEC Filings (MTUS)

© 2026 Stock Market Info — Metallus Inc. (MTUS) Financial Profile