Quanex Building Products Corporation

Quanex Building Products Corporation (NX) Market Cap

Quanex Building Products Corporation has a market capitalization of $708.4M.

Price: $15.42

-2.39 (-13.42%)

Market Cap: 708.37M

NYSE · time unavailable

CEO: George L. Wilson

Sector: Industrials

Industry: Construction

IPO Date: 1980-03-17

Website: https://www.quanex.com

Quanex Building Products Corporation (NX) - Company Information

Market Cap: 708.37M|Sector: Industrials

Company Profile

Quanex Building Products Corporation, together with its subsidiaries, provides components for the fenestration industry in the United States, Europe, Canada, Asia, and internationally. The company operates through three segments: North American Fenestration, European Fenestration, and North American Cabinet Components. It offers flexible insulating glass spacers, extruded vinyl profiles, window and door screens, and precision-formed metal and wood products, as well as cabinet doors and other components for original equipment manufacturers (OEMs) in the kitchen and bathroom cabinet industry. The company also provides various non-fenestration components and products, including solar panel sealants, trim moldings, vinyl decking, fencing, water retention barriers, and conservatory roof components. It sells its products to OEMs in the building products industry through sales representatives, direct sales force, distributors, and independent sales agents. The company was founded in 1927 and is based in Houston, Texas.

Analyst Sentiment

83%
Strong Buy

From 2 Active Polls

Consensus Target Matrix

Data feed parsing pending...

Price & Moving Averages

Loading chart...

🎯 Wall Street Analyst Intelligence Report

1-Year structural target targets, chart projections, and sentiment maps.

Average 1Y Target
$16.19
▲ +5.00% Upside
Low Target
$11.56
-25% Risk
Median Target
$15.73
2% Mid
High Target
$19.27
25% Max
Consensus
Hold
4 / 10 Buys

Consensus Trend Projection

Trailing closures vs. 12-month metrics map.

Analyst Vote Distribution

Aggregate institutional coverage sentiment weights.

📊 Historical Valuation Multiples

Real-time Trailing Twelve Month (TTM) momentum side-by-side with discrete quarterly metrics.

Fiscal QuarterTTMQ2 2026Q1 2026Q4 2025Q3 2025Q2 2025Q1 2025Q4 2024Q3 2024
Period EndingTrailing 12MApr 30, 2026Jan 31, 2026Oct 31, 2025Jul 31, 2025Apr 30, 2025Jan 31, 2025Oct 31, 2024Jul 31, 2024
Market Cap ($M)7089078516479047649871,3661,098
Enterprise Value ($M)1,5341,7331,6811,4241,7131,6281,8172,1611,124
Price to Earnings Ratio (P/E)-2.8120.84-52.268.26-0.829.31-16.58-24.5410.83
Price/Earnings-to-Growth Ratio (PEG)1.60-0.090.71-0.322.04
Price to Sales Ratio (P/S)0.381.962.081.321.821.692.472.783.92
Price to Book Ratio (P/B)0.961.251.170.891.260.761.021.351.85
Price to Free Cash Flow Ratio (P/FCF)7.94114.89-27.019.7119.5656.28-40.91-167.1927.36
Enterprise Value to Sales (EV/Sales)3.754.112.913.463.604.544.394.01
Enterprise Value to EBITDA (EV/EBITDA)-16.7139.9662.0419.30-7.2627.1695.6978.6325.62
Debt to Equity Ratio-8.991.221.221.181.220.930.910.880.20

NX Growth Runway Model

Standard long term linear growth fade

Multi-Stage Discounted Cash Flow Sandbox

Market Price$15.42
Intrinsic Value$15.43
Market Alignment
Undervalued by 0.0%relative to calculated intrinsic value
9.00%
Exp: 16%16%
i

Growth runway slowdown

This value provides a time window for the growth rate to decline beyond Stage 1 toward the terminal rate. Longer windows are most useful for companies with high growth starting conditions or strong competitive advantages. This option stretches out the growth rate slowdown across 5, 10, or 15-year steps. A high-growth starting condition (exceeding a 25% initial growth rate) automatically applies a curve decay to simulate realistic, rapid market saturation.
i

Terminal growth rate

With long-term inflation between 3-5%, revenue must grow by that baseline to maintain flat real-world market share. This value sets the permanent terminal growth rate to factor into the valuation beyond the growth slowdown runway toward maturity.

3-Stage Financial Runway Horizon

🧠 Perpetuity Horizon Engine (Stage 3: Post-2035)

Terminal FCF Base$0.17B
Perpetuity TV Value$3.17B
Discounted TV (PV)$1.34B
TV Weighting %65.4%
⚠️
Financial Model Disclaimer & Risk Disclosure: This interactive scenario simulator is an educational sandbox provided strictly for informational and analytical research purposes. Core historical financial statements and consensus estimates are sourced directly via Financial Modeling Prep (FMP). All downstream outputs are entirely deterministic, hypothetical projections generated by combining automated mathematical formulas (including linear interpolation and Gaussian bell-curve decay models) with user-selected variables and third-party financial data inputs. Users assume all liability for trading decisions executed based on these sandbox calculations.

📘 Full Research Report

ℹ️

AI-Generated Research: This report is for informational purposes only.

📘 QUANEX BUILDING PRODUCTS CORP (NX) — Investment Overview

🧩 Business Model Overview

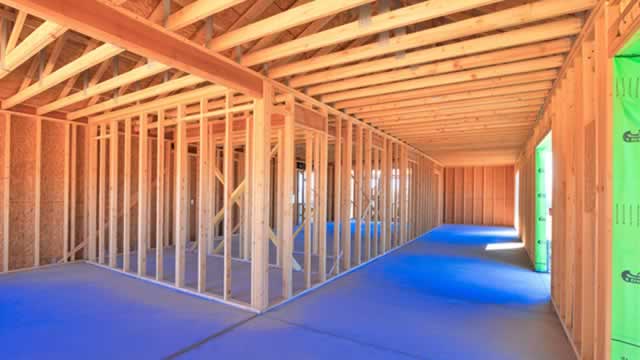
Quanex Building Products supplies engineered components used in the building envelope—most notably insulating glass and window/door systems. The value chain is largely B2B: Quanex manufactures and distributes specialized glazing and related building components to window and glass fabricators, who then incorporate the products into finished windows/doors sold to builders and the replacement market. Customer demand is driven by construction activity and by energy-efficiency requirements (thermal performance, condensation control, and durability). Quanex’s practical “how it works” is a repeatable industrial workflow: qualification with glazing/window manufacturers, production at scale to meet quality/specifications, and delivery of component volumes tied to customer production schedules.

💰 Revenue Streams & Monetisation Model

Revenue is primarily transactional, tied to component shipments rather than long-duration subscriptions. However, monetisation has an element of durability because glazing components are re-ordered as long as designs remain qualified and performance requirements are met. Key monetisation/margin drivers typically include:
  • Mix of higher-value engineered components within building envelope offerings.
  • Factory utilization and operating leverage (margin sensitivity to production volumes and fixed-cost absorption).
  • Material and conversion efficiency across aluminum/metal components, polymers, and sealants/related inputs.
  • Customer program stickiness through ongoing qualification and replacement of production runs.
While end-market volume is cyclical, the company’s ability to sustain margins depends on maintaining manufacturing quality, meeting tight tolerance/spec requirements, and managing working capital through stable customer purchasing patterns.

🧠 Competitive Advantages & Market Positioning

Quanex’s competitive position is best understood as an engineering + qualification moat rather than pure brand power. Moat characteristics:
  • Switching Costs (Process & Qualification): Glazing and window components typically require qualification, technical documentation, and performance validation. Once a component is designed into a customer’s system, technical re-approval and re-tooling create friction to switch suppliers.
  • Cost Advantages (Manufacturing Execution): Component-level manufacturing favors efficient processes, yield discipline, and scale purchasing—factors that reduce unit cost and support competitiveness when construction volumes soften.
  • Intangible Assets (Technical Know-How): Engineering experience in thermal performance, durability, and compatibility across systems helps sustain product acceptance with fabricators and downstream specifiers.
Competitive benchmarking (insulating glass spacer systems and related building envelope components):
  • Edgetech (glazing spacer systems and thermal edge solutions)
  • Warm Edge (thermal spacer systems used in insulated glass)
  • Laird Thermal Systems (thermal spacer systems and related insulating glass components)
Positioning vs. rivals: While competitors overlap in thermal/insulating-glazing components, Quanex’s market position is strengthened when customers standardize on its engineered components across ongoing fabrication programs. The competitive contest is therefore less about one-off product introductions and more about qualification continuity, manufacturing reliability, and total system performance for window and glass fabricators.

🚀 Multi-Year Growth Drivers

Over a 5–10 year horizon, Quanex’s addressable market expands primarily through energy-efficiency and envelope performance trends, supported by retrofit dynamics. Primary growth drivers:
  • Energy-efficiency building codes and compliance upgrades: Increased emphasis on thermal performance and condensation control supports sustained demand for insulating-glazing solutions and related components.
  • Residential replacement and retrofit: Window/door replacements are driven by aging housing stock and utility-cost sensitivity, providing a steadier demand base than new construction alone.
  • Non-residential envelope modernization: Commercial building upgrades to improve efficiency and occupant comfort support volumes for glazing component suppliers.
  • Systems-level integration: Fabricators increasingly favor engineered components that reduce complexity, improve performance outcomes, and support faster approvals.
TAM expansion is therefore driven by both regulatory/standards tailwinds and the long-lived nature of building envelope assets, where replacement cycles create recurring opportunities.

⚠ Risk Factors to Monitor

Key structural and operational risks include:
  • Construction and housing cyclicality: Component volumes typically correlate with housing starts and commercial construction activity; downturns can pressure utilization and margins.
  • Material input volatility: Costs for metals and polymer-related inputs can swing, requiring effective pass-through mechanisms and inventory management.
  • Customer concentration and program risk: Revenue can be exposed if major customers change designs, consolidate suppliers, or reduce production schedules.
  • Quality and specification compliance: Building envelope components must meet performance expectations; failures can lead to warranty/claims, operational disruption, or loss of qualified status.
  • Capacity and fixed-cost leverage: Underutilization can impair profitability; maintaining disciplined capital allocation is critical.

📊 Valuation & Market View

This sector is commonly valued using EV/EBITDA and earnings-based metrics because profitability is influenced by utilization and operating leverage. Market participants generally emphasize:
  • Margin durability through the cycle (quality, mix, and cost control).
  • Evidence of demand stabilization via retrofit/replacement exposure.
  • Cash conversion and working capital discipline (inventory and receivables management).
  • Ability to manage input cost swings without eroding customer relationships or competitiveness.
Drivers that typically move valuation include normalized earnings power, sustainability of engineering-led differentiation, and confidence in the company’s ability to avoid material quality/qualification disruptions.

🔍 Investment Takeaway

Quanex Building Products presents a long-term investment thesis centered on engineering-led switching costs and qualification stickiness in insulating-glazing and building envelope components. Growth prospects are supported by energy-efficiency standards and replacement/retrofit cycles, while downside risk is tied to construction cyclicality, material volatility, and maintaining operational quality. The investment case is strongest when evaluating the company as a specialized component supplier where technical acceptance and manufacturing execution provide resilience against purely price-based competition.

⚠ AI-generated — informational only. Validate using filings before investing.

📰 Market News & Coverage

15 Stories Available

Real-time institutional reporting and market updates for NX.

seekingalpha.com2026-06-05

Quanex Building Products Corporation (NX) Q2 2026 Earnings Call Transcript

Quanex Building Products Corporation (NX) Q2 2026 Earnings Call Transcript

marketbeat.com2026-06-05

Quanex Building Products Q2 Earnings Call Highlights

Quanex Building Products NYSE: NX reported a modest increase in fiscal second-quarter revenue but sharply lower earnings, as inflation in raw materials, freight and logistics weighed on margins and led the company to withhold reaffirmation of its prior full-year outlook.

zacks.com2026-06-04

Quanex Building Products (NX) Tops Q2 Earnings and Revenue Estimates

Quanex Building Products (NX) came out with quarterly earnings of $0.25 per share, beating the Zacks Consensus Estimate of $0.22 per share. This compares to earnings of $0.6 per share a year ago.

globenewswire.com2026-06-04

Quanex Building Products Announces Second Quarter 2026 Results

Net Sales Growth of ~2% Year-Over-Year Volumes Tracking Normal Seasonality Patterns Price vs Cost Imbalance Being Addressed Executing on Working Capital Management

globenewswire.com2026-05-28

Quanex Building Products Declares Quarterly Dividend

HOUSTON, May 28, 2026 (GLOBE NEWSWIRE) -- Quanex Building Products Corporation (NYSE:NX) (“Quanex” or the “Company”) today announced that its Board of Directors declared a quarterly cash dividend of $0.08 per share on the Company's common stock, payable June 30, 2026, to shareholders of record on June 15, 2026.

zacks.com2026-05-28

Analysts Estimate Quanex Building Products (NX) to Report a Decline in Earnings: What to Look Out for

Quanex (NX) doesn't possess the right combination of the two key ingredients for a likely earnings beat in its upcoming report. Get prepared with the key expectations.

globenewswire.com2026-05-21

Quanex Building Products Announces Second Quarter 2026 Earnings Release and Conference Call Schedule

HOUSTON, May 21, 2026 (GLOBE NEWSWIRE) -- Quanex Building Products Corporation (NYSE: NX) (“Quanex” or the “Company”) today announced plans to release its second quarter 2026 results on Thursday, June 4, 2026, after trading closes on the New York Stock Exchange.

globenewswire.com2026-05-21

Quanex Building Products Announces Second Quarter 2026 Earnings Release and Conference Call Schedule

HOUSTON, May 21, 2026 (GLOBE NEWSWIRE) -- Quanex Building Products Corporation (NYSE: NX) ("Quanex" or the "Company") today announced plans to release its second quarter 2026 results on Thursday, June 4, 2026, after trading closes on the New York Stock Exchange.

businesswire.com2026-04-06

Quanex Names Chad Collins as President, Hardware Solutions

HOUSTON--(BUSINESS WIRE)--Quanex Building Products Corporation announced the appointment of Chad Collins to President, Hardware Solutions.

seekingalpha.com2026-03-20

Quanex Building Products: Expect Outperformance To Keep Building

Quanex Building Products remains a 'strong buy' due to its diversified model, long-term catalysts, and exceptionally low valuation versus peers. NX's revenue mix is 60% repair/remodel and 40% new construction, with significant North American and EMEA exposure, supporting resilience amid market volatility. Recent financials show mixed results: modest revenue growth, pressured margins, and segment-specific volume softness offset by price increases and operational initiatives.

fool.com2026-03-11

Investor Opens $32 Million Position in Quanex Building Products Amid $4 Million Quarterly Loss

Angelo Gordon & Co. acquired 2,054,770 shares of NX in the fourth quarter. The quarter-end position value increased by $31.60 million as a result.

defenseworld.net2026-03-08

Quanex Building Products (NYSE:NX) Shares Down 7.2% – Should You Sell?

Quanex Building Products Corporation (NYSE: NX - Get Free Report)'s stock price dropped 7.2% during trading on Friday. The company traded as low as $16.85 and last traded at $17.44. Approximately 211,962 shares traded hands during trading, a decline of 62% from the average daily volume of 559,209 shares. The stock had previously closed at

seekingalpha.com2026-03-06

Quanex Building Products Corporation (NX) Q1 2026 Earnings Call Transcript

Quanex Building Products Corporation (NX) Q1 2026 Earnings Call Transcript

zacks.com2026-03-05

Quanex Building Products (NX) Reports Q1 Loss, Beats Revenue Estimates

Quanex Building Products (NX) came out with a quarterly loss of $0.01 per share versus the Zacks Consensus Estimate of a loss of $0.05. This compares to earnings of $0.19 per share a year ago.

globenewswire.com2026-03-05

Quanex Building Products Announces First Quarter 2026 Results and Provides Full Year 2026 Guidance

Net Sales Growth of ~2% Year-Over-Year Healthy Balance Sheet and Strong Liquidity Well Positioned to Capitalize on Pent-Up Demand

📊 AI Financial Analysis

Powered by StockMarketInfo
Earnings Data: Q Ending 2026-04-30

"Headline (2026 Q2, ended 2026-04-30): Revenue $462.4M; Net Income $10.9M (EPS $0.07). YoY: Revenue +2.2% vs 2025 Q2 ($452.5M); Net Income decreased ~-46.9% vs 2025 Q2 ($20.5M). QoQ: Revenue +13.0% vs 2026 Q1 ($409.1M); Net Income swung from -$4.1M to +$10.9M. Profitability improved QoQ: operating income rose to $18.7M and net margin recovered to 2.35% from -1.00% in Q1, but YoY margins appear lower versus the stronger 2025 Q2 period (net margin 4.53%). Cash flow quality remains uneven: operating cash flow was $18.9M and free cash flow was $7.9M in Q2, a sharp improvement from negative OCF/FCF in Q1, supported by working-capital inflows. Balance sheet resilience looks stable: equity was $727M, essentially flat QoQ (+~0.4%), while leverage remains elevated with total debt $889M and net debt ~$826M. Shareholder returns look strong on price momentum: NX is up ~28.1% over the last 1 year, alongside a modest dividend yield (~0.40%). There were no buybacks shown in the quarter, so capital returns appear primarily driven by market re-rating rather than aggressive repurchases."

Revenue Growth

Positive

Revenue increased +13.0% QoQ (from $409.1M to $462.4M) and +2.2% YoY (vs $452.5M), indicating stabilization with intermittent momentum.

Profitability

Neutral

Net income improved materially QoQ (-$4.1M to +$10.9M) with net margin expanding to 2.35%, but YoY net income fell ~-46.9% and margins trail 2025 Q2 (net margin 4.53%).

Cash Flow Quality

Fair

Q2 operating cash flow turned positive ($18.9M) and free cash flow was $7.9M, recovering from Q1, but the level remains modest versus the volatility seen across the prior quarters.

Leverage & Balance Sheet

Fair

Equity is stable QoQ (~$727M), but leverage remains high with total debt ~$889M and net debt ~$826M; liquidity is acceptable (current ratio ~2.28) but interest coverage is weak in Q2 (as reflected by ratios).

Shareholder Returns

Good

Strong capital appreciation: 1-year price change +28.07% (well above +20% threshold). Dividend yield is modest (~0.40%); no repurchases are indicated in the quarter.

Analyst Sentiment & Valuation

Positive

Dividend yield is low but positive; valuation metrics show a reasonable market-to-book (~1.25). No analyst price target is provided, limiting sentiment assessment.

Disclaimer:This analysis is AI-generated for informational purposes only. Accuracy is not guaranteed and this does not constitute financial advice.

Fundamentals Overview

Loading fundamentals overview...

So what: NX delivered a weak earnings quarter driven by inflation and timing effects rather than demand collapse. Q2 revenue rose 2.2% YoY to $462M, but volumes declined ~3% and pricing/FX only partially offset tariff pass-through (~1%) and FX (~2.5%). Gross margin fell 350 bps as raw materials, packaging, and logistics costs spiked—especially in Hardware Solutions where inventory and legacy make-to-stock pricing caps magnified index-lag pressure. Adjusted EPS and EBITDA fell sharply (adjusted EPS $0.25 vs $0.63; adjusted EBITDA $44.2M vs $63.1M), reflecting reduced operating leverage from lower volumes plus tariff/inflation costs. Management is not reaffirming FY26, but provided Q3 guardrails: revenue flat to +1%, and adjusted EBITDA margin flat to +25 bps, assuming no further inflation beyond already-triggered index increases. The near-term playbook centers on closing the price/cost gap, accelerating make-to-order, and driving working-capital and inventory improvements to support 2H cash generation and debt reduction.

AI IconGrowth Catalysts

  • Targeted price increases to close the 'price cap cost gap' in Q3 (mid-single-digit to low teens %), tailored by product line
  • Accelerate transition from make-to-stock to make-to-order for window and door hardware during Q3
  • Execute on the '20 initiative' in the North American window and door hardware business
  • Improve working capital to generate more free cash flow in the second half of 2026

Business Development

  • New President for Hardware Solutions appointed in April (Chad Collins); Bob Daniels retiring end of year

AI IconFinancial Highlights

  • Net sales $462M (+2.2% YoY vs $453M); pricing +1.5%, volume -3% (consolidated), tariff pass-through benefit ~1%, foreign exchange translation benefit ~2.5%
  • Gross margin declined 350 bps YoY in Q2, driven by sharp increases in raw materials and logistics costs; hardware solutions impacted most due to make-to-stock window/door hardware legacy model and highest inventory levels
  • Reported net income $3.4M / $0.07 diluted EPS vs $20.5M / $0.44 prior-year quarter; adjusted net income $11.3M / $0.25 vs $29.1M / $0.63
  • Adjusted EBITDA $44.2M vs $63.1M; decline attributed to reduced operating leverage from lower volumes plus tariff-related costs and inflationary pressures tied to Middle East-driven transport and raw material cost spikes
  • Effective tax rate ~24% excluding discrete items (as expected)
  • Q3 guidance: revenue flat to +1% YoY; adjusted EBITDA margin flat to +25 bps; estimated tax rate ~24%

AI IconCapital Funding

  • Operating cash flow $18.9M vs $28.5M prior-year quarter; free cash flow $7.9M vs $13.6M
  • Liquidity $329M at 04/30/2026: $63.7M cash plus availability under senior secured revolver due 2029 (net of letters of credit)
  • Leverage: net debt / LTM adjusted EBITDA 3.1x; company expects to exit 2026 with a lower net leverage ratio via cash generation and debt repayment in 2H
  • No quantified buyback amount provided; management prioritized paying down debt first, with opportunistic repurchases evaluated based on relative attractiveness

AI IconStrategy & Ops

  • Q3 operational priorities: closing the price cap cost gap across all product lines, accelerating make-to-order transition for window/door hardware, executing '20 initiative', improving working capital, and generating more free cash flow
  • Index pricing timing: quarterly review of index-based raw materials (lag described as ~90 days up to ~2 days depending on commodity/customer contract); management assumes current price increases have 'triggered were gone' and assumes stable pricing / no incremental inflation for Q3 outlook
  • Segment cost drivers (named commodities): Hardware—aluminum, zinc, stainless steel, plastic resins; Extruded—butyl rubber, silicone compounds, carbon black, desiccants, PVC resins; Custom—EPDM, carbon black, oils, aluminum, plastic resins, certain hardwoods; cross-segment packaging (plastic/paper) and freight/logistics
  • Inventory/cash focus: management cited meaningful inventory improvements expected to continue, supporting 2H cash flow

AI IconMarket Outlook

  • Company not reaffirming FY 2026 guidance; cited reduced visibility from geopolitics/consumer confidence/interest rates/tariffs and increased inflation since March
  • Q3 2026 expectations: revenue flat to +1%; adjusted EBITDA margin flat to +25 bps; tax rate ~24%

AI IconRisks & Headwinds

  • Housing recovery likely gradual; weak consumer confidence below historical norms; mortgage rates above 6% and lock-in effect limiting mobility; geopolitical uncertainty
  • Gross margin pressure: 350 bps YoY decline from rapid raw material and logistics inflation plus tariff-related costs
  • Index pricing lag creates temporary earnings pressure when inflation spikes before quarterly index triggers; lack of macro/geopolitical visibility keeps company in a 'chase mode'
  • Transportation cost increases from Middle East-related fuel/energy and surcharges; international logistics disruptions (e.g., Straits of Hormuz constraint for GCC supply chain) increase time/cost
  • Lower volumes (consolidated -3% YoY; hardware segment -5% YoY; extruded -4% YoY; custom segment mix: revenue -6.6% YoY despite volume +1%) reduce operating leverage

Q&A: Analyst Interest

  • Index pass-through timing: Management explained quarterly reviews of index-based raw materials, causing either lagged benefit or temporary pressure until the next trigger. They stated Q3 outlook assumes stable pricing after triggered increases, but emphasized ongoing geopolitical/macro uncertainty limits forecasting visibility.
  • EBITDA seasonality and margin direction: Management affirmed a similar trajectory to last year where Q4 EBITDA margin improved vs Q3. They linked improvement to price increases stepping in during Q3, generating full benefit in Q4, and normal seasonality where Q3 ramps and Q4 is strongest.
  • Debt vs buybacks and cash generation: Management said priority is paying down debt first, with buyback evaluation secondary and dependent on price attractiveness versus debt paydown math. They reiterated the expectation to generate most cash in 2H, contingent on inflation, volumes, and continued inventory reductions.

Sentiment: CAUTIOUS

Note: This summary was synthesized by AI from the NX Q2 2026 earnings transcript. Financial data is complex; please verify all metrics against official SEC filings before making investment decisions.

📋 Official Regulatory 10-K / 10-Q SEC Filings

Direct authenticated documentation links to audited SEC database reports for NX.

SEC EDGAR Live Feed
Loading financial data and tables...
📁

SEC Filings (NX)

© 2026 Stock Market Info — Quanex Building Products Corporation (NX) Financial Profile