Pure Cycle Corporation

Pure Cycle Corporation (PCYO) Market Cap

Pure Cycle Corporation has a market capitalization of $252.6M.

Price: $10.48

0.16 (1.55%)

Market Cap: 252.61M

NASDAQ · time unavailable

CEO: Mark W. Harding

Sector: Utilities

Industry: Regulated Water

IPO Date: 1994-04-13

Website: https://www.purecyclewater.com

Pure Cycle Corporation (PCYO) - Company Information

Market Cap: 252.61M|Sector: Utilities

Company Profile

Pure Cycle Corporation designs, constructs, operates, and maintains water and wastewater systems in the Denver metropolitan area and Colorado Front Range in the United States. It operates in two segments, Wholesale Water and Wastewater Services, and Land Development. The company engages in the wholesale water production, storage, treatment, and distribution systems; wastewater collection and treatment systems; development of master-planned community; and oil and gas leasing business. It serves domestic, commercial, and industrial customers in the Denver metropolitan region. Pure Cycle Corporation was founded in 1976 and is based in Watkins, Colorado.

Analyst Sentiment

50%
Hold

From 0 Active Polls

Consensus Target Matrix

Data feed parsing pending...

Price & Moving Averages

Loading chart...

🎯 Wall Street Analyst Intelligence Report

1-Year structural target targets, chart projections, and sentiment maps.

Average 1Y Target
$11.00
▲ +5.00% Upside
Low Target
$7.86
-25% Risk
Median Target
$10.69
2% Mid
High Target
$13.10
25% Max
Consensus
Buy
1 / 1 Buys

Consensus Trend Projection

Trailing closures vs. 12-month metrics map.

Analyst Vote Distribution

Aggregate institutional coverage sentiment weights.

📊 Historical Valuation Multiples

Real-time Trailing Twelve Month (TTM) momentum side-by-side with discrete quarterly metrics.

Fiscal QuarterTTMQ1 2026Q4 2025Q3 2025Q2 2025Q1 2025Q4 2024Q3 2024Q2 2024
Period EndingTrailing 12MFeb 28, 2026Nov 30, 2025Aug 31, 2025May 31, 2025Feb 28, 2025Nov 30, 2024Aug 31, 2024May 31, 2024
Market Cap ($M)253255269243256280350256224
Enterprise Value ($M)256258260228248270338241211
Price to Earnings Ratio (P/E)18.0057.6414.749.9528.3386.5622.239.7119.82
Price/Earnings-to-Growth Ratio (PEG)0.080.990.150.14
Price to Sales Ratio (P/S)8.2449.2929.4721.7149.7470.1160.8520.4229.46
Price to Book Ratio (P/B)1.701.711.831.701.872.082.621.981.82
Price to Free Cash Flow Ratio (P/FCF)-2275.76-56.47-238.4534.48-167.88-199.50-806.46130.36378.40
Enterprise Value to Sales (EV/Sales)49.9028.4720.3648.2867.6658.7619.2227.71
Enterprise Value to EBITDA (EV/EBITDA)12.75314.9138.8825.5668.40150.0057.8525.5446.60
Debt to Equity Ratio0.160.050.050.050.050.050.050.050.06

PCYO Growth Runway Model

Standard long term linear growth fade

Multi-Stage Discounted Cash Flow Sandbox

Market Price$10.48
Intrinsic Value$10.47
Market Alignment
Overvalued by 0.1%relative to calculated intrinsic value
9.00%
Exp: 21%21%
i

Growth runway slowdown

This value provides a time window for the growth rate to decline beyond Stage 1 toward the terminal rate. Longer windows are most useful for companies with high growth starting conditions or strong competitive advantages. This option stretches out the growth rate slowdown across 5, 10, or 15-year steps. A high-growth starting condition (exceeding a 25% initial growth rate) automatically applies a curve decay to simulate realistic, rapid market saturation.
i

Terminal growth rate

With long-term inflation between 3-5%, revenue must grow by that baseline to maintain flat real-world market share. This value sets the permanent terminal growth rate to factor into the valuation beyond the growth slowdown runway toward maturity.

3-Stage Financial Runway Horizon

🧠 Perpetuity Horizon Engine (Stage 3: Post-2035)

Terminal FCF Base$0.03B
Perpetuity TV Value$0.53B
Discounted TV (PV)$0.22B
TV Weighting %67.7%
⚠️
Financial Model Disclaimer & Risk Disclosure: This interactive scenario simulator is an educational sandbox provided strictly for informational and analytical research purposes. Core historical financial statements and consensus estimates are sourced directly via Financial Modeling Prep (FMP). All downstream outputs are entirely deterministic, hypothetical projections generated by combining automated mathematical formulas (including linear interpolation and Gaussian bell-curve decay models) with user-selected variables and third-party financial data inputs. Users assume all liability for trading decisions executed based on these sandbox calculations.

📘 Full Research Report

ℹ️

AI-Generated Research: This report is for informational purposes only.

📘 PURE CYCLE CORP (PCYO) — Investment Overview

🧩 Business Model Overview

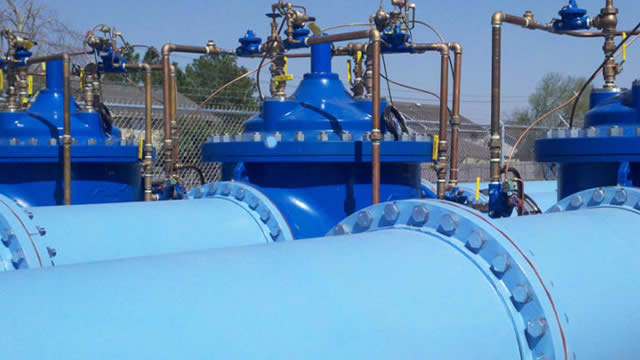
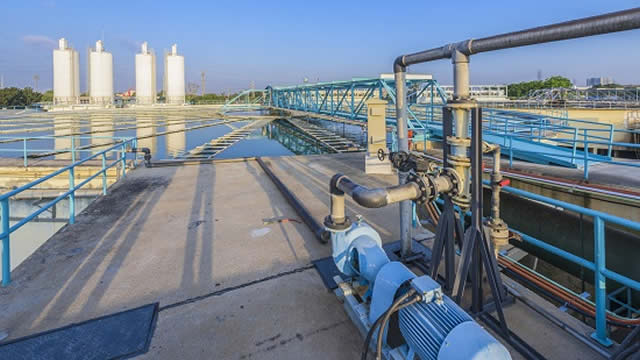
PURE CYCLE CORP operates and services water treatment and recycling systems that convert difficult-to-handle water streams into usable resources for industrial and upstream customers. The core “how it works” is a build-and-operate model: the company develops treatment capacity, connects it to the local water supply and logistics network (field-to-plant flows and disposal/reuse pathways), and then monetizes the treated outputs through customer service agreements and per-volume processing arrangements.

In practical terms, the value chain centers on (1) sourcing and receiving incoming water, (2) applying treatment technology to meet reuse or discharge specifications, and (3) managing downstream compliance and logistics so customers avoid the cost and operational friction of hauling, disposal, or meeting evolving water-handling requirements independently. This structure tends to create operational stickiness because customers value reliable treatment performance, predictable scheduling, and minimized trucking and handling.

💰 Revenue Streams & Monetisation Model

Revenue is primarily generated from processing volumes (transactional, tied to throughput) and from service structures that can include contracted commitments for capacity or continued treatment usage. Margin drivers typically include:

  • Utilization of installed treatment assets: spreading fixed operating costs over higher throughput improves unit economics.
  • Feedstock quality and treatment efficiency: variability in salinity, solids, and contaminants can affect chemical and maintenance needs.
  • Operating cost control: membrane/filtration performance, downtime avoidance, and waste-stream handling efficiency influence gross margin.
  • Logistics economics: reducing truck-based hauling and shortening transport distances supports customer economics and supports contract renewals.

Overall monetisation can be viewed as a combination of volume-linked cash flows and service stability that depends on local demand for reuse/disposal capacity and the durability of customer agreements.

🧠 Competitive Advantages & Market Positioning

PURE CYCLE’s defensibility is best understood through geographic cost advantage and infrastructure-based switching frictions rather than proprietary technology alone. Competitors can often match high-level treatment methods, but replicating PURE CYCLE’s local operating footprint is harder because water logistics are location-specific, permitting and interconnection are time-consuming, and customer operations benefit from a proven, nearby treatment partner.

  • Geographic cost advantage (low delivered cost): by situating treatment assets near production areas and the relevant reuse/disposal endpoints, the company can reduce hauling and handling costs versus long-distance transportation to centralized disposal or treatment facilities.
  • Logistical infrastructure moat: physical connections, plant siting, and established operating procedures create practical barriers to rapid “switching.” Building new capacity to serve the same customers involves permitting, civil work, and commissioning timelines.
  • Regulatory and operating know-how: compliance capability and operational track record can reduce customer risk when meeting disposal/reuse specifications.

COMPETITIVE BENCHMARKING

Primary competitors in the broader North American water treatment/reuse ecosystem include:

  • AquaVenture Holdings (water reuse/desalination solutions, often focused on advanced treatment and brine management)
  • Veolia and/or SUEZ (integrated environmental services and water technology capabilities)
  • Clean Harbors (environmental services with strong disposal and waste management offerings)

PURE CYCLE’s positioning differs in emphasis: the company tends to focus on localized, operationally integrated recycling/processing capacity that aligns with nearby water logistics and reuse/disposal needs. By contrast, larger diversified environmental firms may compete across broader end-markets and often rely more on service breadth or disposal-centric models, while technology-heavy peers may compete more on treatment solutions and less on the same localized infrastructure economics.

🚀 Multi-Year Growth Drivers

Over a 5–10 year horizon, growth prospects are primarily supported by structural demand drivers rather than cyclical “share games” alone:

  • Produced water volumes and reuse requirements: sustained upstream activity drives ongoing water handling needs, while reuse and disposal mandates increasingly favor treatment solutions that can meet tighter specifications.
  • Regulatory pressure and compliance costs: evolving environmental requirements can make centralized disposal or on-site compliance more expensive, increasing demand for capable local treatment capacity.
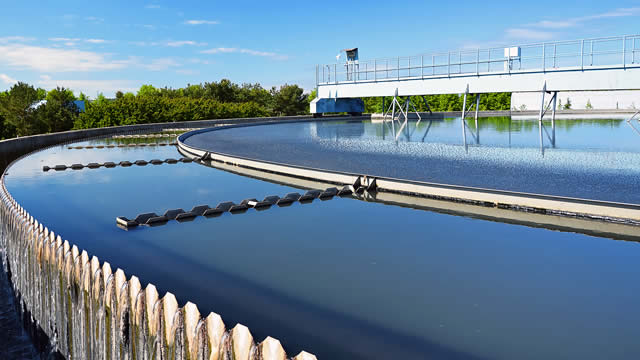
  • Water scarcity and sustainability economics: beneficial reuse of treated water can reduce reliance on fresh water sources and improve customer operating economics.
  • Infrastructure scaling and network effects within a geography: once a treatment footprint is established, incremental expansions in the same basin can leverage local learnings, staffing, and logistics routing.

Total addressable market expansion is linked to both (1) the number of producing locations that require managed water treatment and (2) the share of those volumes that transition from trucking/disposal toward reuse-aligned processing.

⚠ Risk Factors to Monitor

  • Capital intensity and execution risk: expanding treatment capacity requires timely permitting, construction, commissioning, and integration with customer logistics.
  • Counterparty demand tied to upstream activity: changes in drilling and completion activity can impact throughput and utilization.
  • Operational and technology performance: treatment systems face challenges such as membrane fouling, scaling, and variability in incoming water characteristics that can raise operating costs.
  • Regulatory and permitting uncertainty: changes in discharge/reuse standards, permitting constraints, and environmental compliance obligations can affect economics.
  • Competition and pricing pressure: new entrants or expansions by existing providers can increase competition in specific basins, impacting contract pricing and utilization.

📊 Valuation & Market View

Water treatment and environmental services are commonly valued using EV/EBITDA and DCF-style cash flow frameworks that emphasize asset utilization, contract durability, and compliance-driven barriers. In some cases, P/S is used for early-stage or capacity-expansion phases, but the valuation quality typically improves as investors gain visibility into throughput, margins, and contract terms.

Key valuation drivers generally include:

  • Normalized utilization of installed assets
  • Operating margin sustainability given feedstock variability and maintenance cycles
  • Contract structure (volume commitments vs. spot-like processing)
  • Capital efficiency of incremental capacity additions
  • Balance sheet and leverage affecting flexibility to fund growth through downturns

🔍 Investment Takeaway

PURE CYCLE’s long-term investment case is anchored in localized infrastructure economics—geographic cost advantage, established treatment footprints, and compliance/operations know-how—that can create durable customer reliance. The primary swing factors remain utilization, unit economics under variable feedstock conditions, and execution of capacity expansion within regulated markets.


⚠ AI-generated — informational only. Validate using filings before investing.

📰 Market News & Coverage

15 Stories Available

Real-time institutional reporting and market updates for PCYO.

gurufocus.com2026-04-10

Pure Cycle Corp (PCYO) Stock Down 5.3% -- Now Undervalued? GF Score: 78/100

On April 10, 2026, Pure Cycle Corp (PCYO) shares experienced a decline of 5.3%, bringing the current price to $11.23. This movement comes after an overall posit

seekingalpha.com2026-04-09

Pure Cycle Corporation (PCYO) Q2 2026 Earnings Call Transcript

Pure Cycle Corporation (PCYO) Q2 2026 Earnings Call Transcript

globenewswire.com2026-04-08

Pure Cycle Announces Financial Results For the Three and Six Months Ended February 28, 2026

DENVER, April 08, 2026 (GLOBE NEWSWIRE) -- Pure Cycle Corporation (NASDAQ Capital Market: PCYO) (“Pure Cycle”, “we”, “us” or “our”) announced its financial results for the three and six months ended February 28, 2026. Pure Cycle reported $1.1 million and $5.7 million of net income for the three and six months ended February 28, 2026, respectively, marking the twenty-seventh consecutive fiscal quarter with positive net income. Pure Cycle reported $0.05 and $0.23 of earnings per fully diluted common share for the three and six months ended February 28, 2026, up from $0.03 and $0.20 in the same periods in 2025. By partnering with our national home builder customers, we deliver finished lots on an annual cadence that allows for steady absorption while navigating cyclical housing industry trends. A mild winter in the Denver area allowed us to capitalize on favorable conditions and advance our lot development schedule at Sky Ranch, which accelerated our revenue recognition during the period.

globenewswire.com2026-03-30

Pure Cycle Corporation Announces Dates for Q2 2026 Earnings Presentation

DENVER, March 30, 2026 (GLOBE NEWSWIRE) -- Pure Cycle Corporation (NASDAQ: PCYO) will release financial results for the three and six months ended February 28, 2026, on Wednesday, April 8, 2026, and hold an earnings presentation on Thursday, April 9, 2026, to discuss the results. For an interactive experience, including the ability to ask questions and view the slide presentation, please register and join the event via the link below. See below for event details.

seekingalpha.com2026-01-28

Pure Cycle Regains Momentum From Oil And Gas And A Clearer Strategy

Pure Cycle Corporation is rated 'Buy', as operational momentum returns from oil & gas and housing tailwinds. PCYO's revised strategy prioritizes land acquisition and rental housing, accelerating monetization of its water portfolio, and recurring revenues. Improved oil & gas drilling activity and declining mortgage rates are set to boost both water usage and housing demand in Sky Ranch.

globenewswire.com2026-01-15

Pure Cycle Corporation Appoints Daniel J. Roller to its Board of Directors

DENVER, Jan. 15, 2026 (GLOBE NEWSWIRE) -- Pure Cycle Corporation (NASDAQ Capital Market: PCYO) (“Pure Cycle”, “we”, “us” or “our”) announced that a new independent director, Daniel J. Roller, was appointed to its Board of Directors (the “Board”), effective January 14, 2026, expanding the Board from 7 to 8 directors. This appointment, made in cooperation with Maran Capital Management, LLC (“Maran”), which beneficially owns approximately 14.7% of Pure Cycle's common shares, further strengthens the Board and adds new skillsets and capabilities. In connection with this appointment, the Board will form a Strategy and Capital Allocation Committee, to be chaired by Mr. Roller.

seekingalpha.com2026-01-08

Pure Cycle Corporation (PCYO) Q1 2026 Earnings Call Transcript

Pure Cycle Corporation (PCYO) Q1 2026 Earnings Call Transcript

globenewswire.com2026-01-07

Pure Cycle Announces Financial Results for the Three Months Ended November 30, 2025

DENVER, Jan. 07, 2026 (GLOBE NEWSWIRE) -- Pure Cycle Corporation (NASDAQ Capital Market: PCYO) (“Pure Cycle”, “we”, “us” or “our”) announced its financial results for the three months ended November 30, 2025. Pure Cycle reported $4.5 million of net income for the three months ended November 30, 2025, which is a 16% increase in net income from the same period in 2024 and marks the twenty-sixth consecutive fiscal quarter with positive net income. Pure Cycle reported $0.19 of earnings per fully diluted common share, which is up from $0.16 in the same period in 2024, a 19% increase. Pure Cycle continues to see demand for entry level lots at our Sky Ranch Master Planned Community despite national headwinds in homebuilding. By partnering with our national home builders, we deliver finished lots on an annual cadence that allows for steady absorption while navigating cyclical housing industry trends.

defenseworld.net2026-01-06

Pure Cycle (NASDAQ:PCYO) Stock Passes Below 200 Day Moving Average – Here’s Why

Pure Cycle Corporation (NASDAQ: PCYO - Get Free Report) shares crossed below its two hundred day moving average during trading on Monday. The stock has a two hundred day moving average of $10.80 and traded as low as $10.77. Pure Cycle shares last traded at $10.82, with a volume of 37,907 shares traded. Analyst Ratings

seekingalpha.com2025-11-13

Pure Cycle Corporation (PCYO) Q4 2025 Earnings Call Transcript

Pure Cycle Corporation ( PCYO ) Q4 2025 Earnings Call November 13, 2025 8:30 AM EST Company Participants Marc Spezialy - VP, CFO & Principal Accounting Officer Mark Harding - President, CEO, Principal Executive Officer & Director Conference Call Participants Greg Vennett Presentation Marc Spezialy VP, CFO & Principal Accounting Officer Okay. Good morning, everyone, and welcome to Pure Cycle's Year End Investor Presentation.

globenewswire.com2025-11-12

Pure Cycle Announces Financial Results For the Year Ended August 31, 2025

DENVER, Nov. 12, 2025 (GLOBE NEWSWIRE) -- Pure Cycle Corporation (NASDAQ Capital Market: PCYO) announced its financial results for the year ended August 31, 2025. Pure Cycle reported $13.1 million of net income for the year ended August 31, 2025, which is a 13% increase in net income from 2024 and marks our eighth consecutive year and twenty-fifth consecutive fiscal quarter with positive net income. Pure Cycle reported $0.54 of earnings per fully diluted common share, which is up from $0.48 in 2024, a 12.5% increase. Pure Cycle continues to see demand for entry level lots at our Sky Ranch Master Planned Community. By partnering with our national homebuilders, we deliver finished lots on an annual cadence that allows for steady absorption while navigating ongoing housing industry headwinds. In the fourth quarter we completed the delivery of finished lots in Phase 2C, and our national homebuilder partners have already begun construction. Additionally, we are finishing the utility work and moving into road work in Phase 2D. We expect to complete Phase 2D in fiscal 2026. Pure Cycle continues to diversify our land development segment by partnering with two national homebuilders in Phase 2D who are new to the Sky Ranch Community. Finally, we have started platting our next 148 lots in Phase 2E. We expect to have lots in Phase 2E completed in fiscal 2027 but will pace construction to match builder absorptions. Pure Cycle continues to drive income from our resource rich asset base and in the year ended August 31, 2025, we reported an increase in our royalty income from our oil and gas mineral interest by 738%, as six wells were completed at Sky Ranch in 2024 that began producing during this fiscal year.

globenewswire.com2025-11-05

Pure Cycle Corporation Announces Dates for Year End 2025 Earnings Presentation

DENVER, Nov. 05, 2025 (GLOBE NEWSWIRE) -- Pure Cycle Corporation (NASDAQ: PCYO) will release financial results for the year ended August 31, 2025, on Wednesday, November 12, 2025, and hold an earnings presentation on Thursday, November 13, 2025, to discuss the results. For an interactive experience, including the ability to ask questions and view the slide presentation, please register and join the event via the link below. See below for event details.

seekingalpha.com2025-07-10

Pure Cycle Corporation (PCYO) Q3 2025 Earnings Call Transcript

Pure Cycle Corporation (NASDAQ:PCYO ) Q3 2025 Earnings Conference Call July 10, 2025 8:30 AM ET Company Participants Marc Stephen Spezialy - VP, CFO & Principal Accounting Officer Mark W. Harding - President, CEO, Principal Executive Officer & Director Conference Call Participants Elliot Knight - Unidentified Company Marc Stephen Spezialy Good morning, everybody, and welcome to Pure Cycle Corporation's third quarter earnings call.

accessnewswire.com2025-07-09

Pure Cycle Announces Financial Results For the Three and Nine Months Ended May 31, 2025

DENVER, CO / ACCESS Newswire / July 9, 2025 / Pure Cycle Corporation (NASDAQ Capital Market:PCYO) announced its financial results for the three and nine months ended May 31, 2025. Pure Cycle reported $2.3M of net income for the three months ended May 31, 2025, which marks our twenty-fourth consecutive fiscal quarter with positive net income.

accessnewswire.com2025-06-30

Pure Cycle Corporation Announces Dates for Q3 2025 Earnings Presentation

DENVER, CO / ACCESS Newswire / June 30, 2025 / Pure Cycle Corporation (NASDAQ:PCYO) will release financial results for the three and nine months ended May 31, 2025, on Wednesday, July 9, 2025, and hold an earnings presentation on Thursday, July 10, 2025, to discuss the results. For an interactive experience, including the ability to ask questions and view the slide presentation, please register and join the event via the link below.

📊 AI Financial Analysis

Powered by StockMarketInfo
Earnings Data: Q Ending 2026-02-28

"Headline (latest quarter, 2026-02-28): Revenue $5.17M and Net Income $1.11M (EPS $0.05). QoQ revenue fell sharply from $9.14M to $5.17M (-43.4%), while net income dropped from $4.57M to $1.11M (-75.8%). Net margin contracted to ~21.4% (from ~50.0% in 2025-11-30), indicating profitability has weakened materially. Over the 4-quarter window, results appear highly volatile: revenue ranged from ~$5.14M (2025-05-31) to ~$11.20M (2025-08-31) and back down to ~$5.17M (2026-02-28). Net income followed the same swings (from ~$2.26M to ~$6.11M, then down to ~$1.11M). Cash flow quality deteriorated in the most recent quarter: free cash flow (FCF) was negative at -$4.51M, versus -$1.13M prior, suggesting less operating cash conversion. Balance sheet resilience looks decent on equity (~$148.7M, slightly up vs prior), but leverage worsened: net debt moved from a net-cash position (-$9.13M) to net debt of ~$3.16M. Shareholder returns are modest: price performance is +12.37% over 1 year, with no dividends or buybacks indicated."

Revenue Growth

Neutral

QoQ revenue declined from $9.14M to $5.17M (-43.4%). Over the 4 quarters revenue was volatile (peaked at ~$11.20M in 2025-08-31, then fell back). YoY growth for the same quarter last year is not available from the provided dataset.

Profitability

Neutral

Net margin contracted to ~21.4% from ~50.0% QoQ, and net income fell -75.8% QoQ (from $4.57M to $1.11M). EPS also dropped to $0.05 from $0.19. No YoY comparison available due to missing same-quarter-last-year data.

Cash Flow Quality

Neutral

FCF turned/continued negative at -$4.51M (vs -$1.13M prior). Prior quarter (2025-08-31) had strong positive FCF (~$7.05M), indicating cash generation is inconsistent.

Leverage & Balance Sheet

Fair

Equity is relatively stable (~$142.7M to ~$148.7M). Assets slightly declined QoQ (168.1M -> 166.6M). Net debt worsened materially, moving from net cash (-$9.13M) to net debt (+$3.16M).

Shareholder Returns

Caution

1-year price change is +12.37% (below the >20% threshold). No dividends or buybacks are indicated, so total shareholder return is primarily price-driven.

Analyst Sentiment & Valuation

Neutral

Trailing P/E is elevated in the latest quarter (57.6), up vs 14.7 (2025-11-30) and ~10.0 (2025-08-31), consistent with declining earnings power. No analyst price target data provided.

Disclaimer:This analysis is AI-generated for informational purposes only. Accuracy is not guaranteed and this does not constitute financial advice.

Fundamentals Overview

Loading fundamentals overview...

Pure Cycle reported strong Q2 and YTD execution, driven mainly by faster lot deliveries enabled by a mild winter and continued supportive demand from national homebuilders. Net income rose ~36% YoY to ~EPS $0.05, and management is ~50% through full-year guidance by mid-year (about $14.3M revenue vs ~$30M guided; profit ~$9M vs ~$19M). The key operational swing factor is timing: margins were described as “moderated” by investments/advancements ahead of contract delivery, but management expects normalization later in 2026. Outlook is constructive for industrial water because oil & gas operators moved from permitting last year into drilling/fracking this year, supported by multi-year water delivery contracts and preferential pricing. However, the call also highlighted external uncertainty: Colorado’s inconsistent incentive policy for data centers and potential power-availability constraints, plus political pressure on corporate rental ownership leading to a reduction in planned rental unit growth (from ~90 to ~60). Interchange execution slipped modestly to a 2027 start / 2028 completion path.

AI IconGrowth Catalysts

  • Mild winter enabling earlier lot 'punch out' and Q2 catch-up on development timing
  • Land development phases: Phase II delivery progress (Phase II 228 lots ~95% complete; Phase IID ~80% complete)
  • Industrial water growth tied to oil & gas permitting/drilling ramp (operators moved from permitting last year to drilling/fracking this year)
  • Customer growth via water connection fee revenue (onetime homebuilder tap/connection charges)
  • Single-family rental units: 19 homes completed and fully rented; continued rentals demand and pace through August

Business Development

  • National Heritage Academy (also referenced as 'Terrific Partners') as charter school operator for Sky Ranch K-12 campus
  • Homebuilder customer base: Lennar, D.R. Horton, KB/Taylor Morrison, Challenger, Pulte (list as named in transcript)
  • Colorado data center / industrial prospects being pitched; Colorado discussed as having competing incentive/disincentive bills (no named companies)
  • Arapahoe County involvement in interchange permitting administration (1601 process jurisdiction)

AI IconFinancial Highlights

  • Q2 net income: ~over $1.0M and EPS ~$0.05 (stated up ~36% year over year, driven mostly by land; also water and single-family rentals)
  • YTD (first 6 months) revenue ~$5.1M and gross profit ~$2.8M, driven by percent-completion lot deliveries
  • Progress vs guidance: ~50% of full-year revenue guidance achieved by mid-year; ~$14.3M total revenue vs close to ~$30M guidance; profit ~$9M vs ~$19M guidance
  • Full-year EPS guidance reiterated: $0.43 to $0.52
  • Margin pressure described as 'moderated' from investments/advancements in lot deliveries slightly ahead of contract delivery; management expects normalization later in 2026
  • Industrial water outlook: expects stronger 2026 year due to prior-year permitting timing and oil price supporting rig activity

AI IconCapital Funding

  • Reinvest and repurchase shares mentioned; no dollar amount provided in transcript
  • No explicit buyback authorization size or debt/cash runway numbers provided in transcript

AI IconStrategy & Ops

  • Land development operating cadence maintained despite mild winter benefits; pace expected to normalize later in 2026
  • Phase II: grading contractors mobilizing 'this month' for ~160 lots targeting delivery in summer 2027
  • Phase IIE (across from the school): described as infill with much infrastructure already in place; referenced as ~another $14M in lot revenues, $4.3M in tap fees, and ~$240M recurring revenue from customer counts
  • Single-family rentals realignment: slowed growth due to political/legal scrutiny of corporate ownership; reduced planned build lots from ~90 to ~60 units
  • Single-family rental units: 19 homes completed to date, fully rented; management aiming for 100% occupancy as units come online

AI IconMarket Outlook

  • Interchange 1601 permit timeline: management expects submission readiness 'sometime this June'; final design through end of year; funding/bonding in place; construction start in 2027 and completion in 2028 (slipped vs prior 'late 2027' expectation)
  • Management reiterated 2026 gross revenue guidance range: ~$26M to $30M
  • Management expects incremental upside from (1) lot delivery timing and (2) industrial water/ oil & gas activity strength

AI IconRisks & Headwinds

  • Colorado policy uncertainty for data centers: described as 'dysfunctional' with competing incentive and disincentive bills; risk elements include inconsistent tax incentive regime and difficulty adding power capacity (particularly gas turbine-based power)
  • Seasonal water supply risk: management characterizes a 'challenged year' for some providers due to dryness; PCYO claims stronger positioning but highlights customer/industry seasonality
  • Interest-rate sensitivity/volatility risk in home sales demand: mitigation noted via builder mortgage buydown incentives targeting ~4.99% (management says rate changes may have less direct impact due to incentive structure)
  • Regulatory/political pressure on corporate home ownership drove rental segment growth slowdown

Sentiment: MIXED

Note: This summary was synthesized by AI from the PCYO Q2 2026 earnings transcript. Financial data is complex; please verify all metrics against official SEC filings before making investment decisions.

📋 Official Regulatory 10-K / 10-Q SEC Filings

Direct authenticated documentation links to audited SEC database reports for PCYO.

SEC EDGAR Live Feed
Loading financial data and tables...
📁

SEC Filings (PCYO)

© 2026 Stock Market Info — Pure Cycle Corporation (PCYO) Financial Profile