Preformed Line Products Company

Preformed Line Products Company (PLPC) Market Cap

Preformed Line Products Company has a market capitalization of $1.77B.

Price: $363.02

-13.28 (-3.53%)

Market Cap: 1.77B

NASDAQ · time unavailable

CEO: Dennis F. McKenna

Sector: Industrials

Industry: Electrical Equipment & Parts

IPO Date: 1999-04-28

Website: https://www.preformed.com

Preformed Line Products Company (PLPC) - Company Information

Market Cap: 1.77B|Sector: Industrials

Company Profile

Preformed Line Products Company, together with its subsidiaries, designs and manufactures products and systems that are used in the construction and maintenance of overhead, ground-mounted, and underground networks for the energy, telecommunication, cable operator, information, and other industries. The company offers formed wire products to support, protect, terminate, and secure power conductor and communication cables, as well as to control cable dynamics; and hardware products to support and protect transmission conductors, spacers, spacer-dampers, stockbridge dampers, corona suppression devices, and various compression fittings for dead-end applications. It also provides protective closures to protect fixed line communication networks, such as copper cable or fiber optic cable from moisture, environmental hazards, and other contaminants; and hardware assemblies, pole line hardware, resale products, underground connectors, solar hardware systems, guy markers, tree guards, fiber optic cable markers, pedestal markers, and urethane products that are used by energy, renewable energy, communications, cable, and special industries for various applications. The company serves public and private energy utilities and communication companies, cable operators, financial institutions, governmental agencies, contractors and subcontractors, distributors, and value-added resellers in the Americas, Europe, the Middle East, Africa, and the Asia-Pacific. It markets its products through a direct sales force, as well as through manufacturing representatives. The company was incorporated in 1947 and is headquartered in Mayfield, Ohio.

Analyst Sentiment

35%
Underperform

From 1 Active Polls

1Y Forecast: $275.00

▼ -24.2% Potential Upside

Consensus Target Metrics

Low Bound

$275

Median

$275

High Bound

$275

Average

$275

Price & Moving Averages

Loading chart...

🎯 Wall Street Analyst Intelligence Report

1-Year structural target targets, chart projections, and sentiment maps.

Average 1Y Target
$275.00
▼ -24.25% Upside
Low Target
$275.00
-24% Risk
Median Target
$275.00
-24% Mid
High Target
$275.00
-24% Max
Consensus
Buy
1 / 1 Buys

Consensus Trend Projection

Trailing closures vs. 12-month metrics map.

Analyst Vote Distribution

Aggregate institutional coverage sentiment weights.

📊 Historical Valuation Multiples

Real-time Trailing Twelve Month (TTM) momentum side-by-side with discrete quarterly metrics.

Fiscal QuarterTTMQ1 2026Q4 2025Q3 2025Q2 2025Q1 2025Q4 2024Q3 2024Q2 2024
Period EndingTrailing 12MMar 31, 2026Dec 31, 2025Sep 30, 2025Jun 30, 2025Mar 31, 2025Dec 31, 2024Sep 30, 2024Jun 30, 2024
Market Cap ($M)1,7741,3281,017966788690626628597
Enterprise Value ($M)1,7471,301981940768679605624597
Price to Earnings Ratio (P/E)51.9431.5530.1391.9715.5114.9914.9720.4515.94
Price/Earnings-to-Growth Ratio (PEG)17.2418.381.091.093.44
Price to Sales Ratio (P/S)2.557.545.875.424.654.653.744.274.30
Price to Book Ratio (P/B)3.762.812.142.071.711.581.481.461.43
Price to Free Cash Flow Ratio (P/FCF)51.12-336.6286.23116.1542.49-129.7430.33108.4424.31
Enterprise Value to Sales (EV/Sales)7.385.675.284.534.573.624.254.30
Enterprise Value to EBITDA (EV/EBITDA)27.5694.8454.84110.9232.9434.9026.8139.7836.13
Debt to Equity Ratio-0.430.090.100.100.100.100.090.100.11

PLPC Growth Runway Model

Standard long term linear growth fade

Multi-Stage Discounted Cash Flow Sandbox

Market Price$363.02
Intrinsic Value$206.67
Market Alignment
Overvalued by 43.1%relative to calculated intrinsic value
9.00%
Exp: 7%7%
i

Growth runway slowdown

This value provides a time window for the growth rate to decline beyond Stage 1 toward the terminal rate. Longer windows are most useful for companies with high growth starting conditions or strong competitive advantages. This option stretches out the growth rate slowdown across 5, 10, or 15-year steps. A high-growth starting condition (exceeding a 25% initial growth rate) automatically applies a curve decay to simulate realistic, rapid market saturation.
i

Terminal growth rate

With long-term inflation between 3-5%, revenue must grow by that baseline to maintain flat real-world market share. This value sets the permanent terminal growth rate to factor into the valuation beyond the growth slowdown runway toward maturity.

3-Stage Financial Runway Horizon

🧠 Perpetuity Horizon Engine (Stage 3: Post-2035)

Terminal FCF Base$0.04B
Perpetuity TV Value$0.79B
Discounted TV (PV)$0.33B
TV Weighting %61.9%
⚠️
Financial Model Disclaimer & Risk Disclosure: This interactive scenario simulator is an educational sandbox provided strictly for informational and analytical research purposes. Core historical financial statements and consensus estimates are sourced directly via Financial Modeling Prep (FMP). All downstream outputs are entirely deterministic, hypothetical projections generated by combining automated mathematical formulas (including linear interpolation and Gaussian bell-curve decay models) with user-selected variables and third-party financial data inputs. Users assume all liability for trading decisions executed based on these sandbox calculations.

📘 Full Research Report

ℹ️

AI-Generated Research: This report is for informational purposes only.

📘 PREFORMED LINE PRODUCTS (PLPC) — Investment Overview

🧩 Business Model Overview

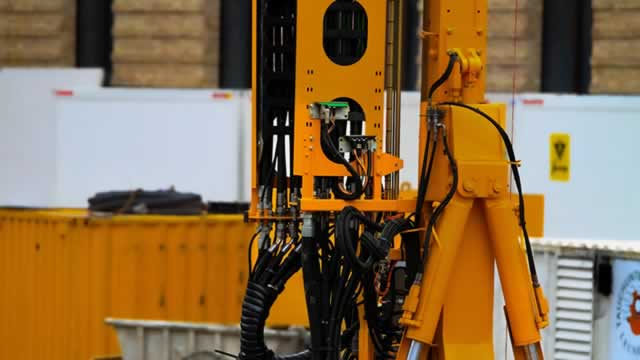
PREFORMED LINE PRODUCTS supplies mission-critical components used to build, maintain, and upgrade electric grid infrastructure. The company’s products are embedded in utility work flows—primarily as cable accessories, grounding, splicing, and related line hardware that contractors and utilities install during new construction and system hardening.

From a value-chain perspective, PLPC’s manufacturing capability is only one part of the equation. The practical “how it works” is that utilities and electrical contractors specify and qualify hardware for safety, reliability, and installation efficiency. Once qualified, product selection tends to persist across projects because engineers, contractors, and procurement teams develop repeatable installation practices around approved components.

💰 Revenue Streams & Monetisation Model

Revenue is predominantly product-driven: PLPC sells manufactured electrical line hardware to utility end markets through distributor and contractor channels, with monetisation tied to the volume of grid maintenance and capital spending cycles. The business is not a pure “subscription” model, but it behaves like an installed-base replacement and repeat-supply business because maintenance programs and storm restoration generate recurring demand for standardized hardware.

Key margin drivers include:

  • Product mix and specification positioning: more technical, higher-value accessories and line hardware generally support better gross margins.
  • Manufacturing efficiency: scale, yield, and process discipline affect unit economics.
  • Input cost pass-through: exposure to metals and resins is managed through pricing strategies, purchasing leverage, and routing of demand through higher-value formulations.
  • Working capital intensity: distributor/contractor inventory cycles and lead-time dynamics influence cash conversion.

🧠 Competitive Advantages & Market Positioning

PLPC’s moat is primarily driven by switching costs and technical qualification barriers, supported by intangible assets in engineering know-how and application-specific product development.

  • Switching costs (qualification + installation standardization): utilities and contractor ecosystems prefer qualified products to reduce safety risk and installation variability. After qualification, procurement teams face friction—engineering review, testing/approval timelines, and jobsite retraining—before migrating to substitutes.
  • Technical and compliance focus: products must meet stringent electrical standards and safety requirements. Competitors can enter, but scaling share requires engineering credibility, proven performance, and supply reliability.
  • Product breadth within a specialized category: a wide range of compatible hardware improves “specification convenience,” strengthening placement during project bid cycles.

Competitive benchmarking:

  • Hubbell (Utility Solutions) — broader electrification exposure and wider system-level offerings; PLPC’s emphasis is more concentrated on line hardware and installation-focused accessories.
  • nVent (including ERICO) — strong grounding and protection presence with overlap in safety-critical electrical components; PLPC competes by focusing on specialized preformed line applications and contractor workflow integration.
  • ABB / ERICO ecosystem — electrical infrastructure hardware with significant reach into utility and industrial channels; PLPC differentiates through targeted product families and qualification-driven procurement relationships.

Overall, rivals often differ by breadth (electrification suites) or geographic/distribution scale, while PLPC’s positioning benefits from category depth and the practical stickiness of qualified utility hardware.

🚀 Multi-Year Growth Drivers

Over a 5–10 year horizon, PLPC’s demand profile is linked to durable grid capex and maintenance activity. Structural growth drivers include:

  • Grid modernization and reliability upgrades: aging assets and reliability mandates increase spending on maintenance, replacements, and hardening.
  • Resilience and storm restoration: extreme weather and utility reliability frameworks sustain replacement demand for overhead distribution components and grounding-related hardware.
  • Renewables integration and infrastructure buildout: interconnection and transmission/distribution upgrades require supporting line hardware and safe system operation.
  • Standards-driven procurement: as electrical safety and performance expectations evolve, utilities refresh approved component sets, which can support share retention for qualified suppliers.

⚠ Risk Factors to Monitor

  • Customer spending cyclicality: utility and contractor budgets can shift with regulatory pacing and macroeconomic conditions, affecting project volumes.
  • Commodity and input cost volatility: metals and other materials can pressure gross margins if pricing does not fully offset cost changes.
  • Qualification and specifications timing: the sales cycle depends on approvals and engineering review; delays can slow conversion of pipeline activity.
  • Operational execution and capacity: demand can require reliable lead times and consistent quality; disruptions can affect qualification status and distributor confidence.
  • Competitive pricing and substitution risk: larger competitors may leverage breadth and distribution to pressure margins; ongoing differentiation and service reliability are required.

📊 Valuation & Market View

The market typically values PLPC and peer industrial electrification component suppliers using EV/EBITDA and P/E-style frameworks, with gross margin durability, cash conversion, and volume resilience influencing the multiple more than near-term growth alone. For investors, key valuation sensitivities generally include:

  • Quality of earnings: margin stability through pricing and input cost management.
  • Working capital discipline: distributor inventory and receivables management.
  • Evidence of specification stickiness: sustained share in qualified hardware and repeat orders.

In this sector, the premium (when it exists) is usually earned through repeatability of demand, pricing power under qualification-driven procurement, and durable execution across cycles.

🔍 Investment Takeaway

PLPC offers a compelling long-term setup in specialized utility line hardware, where qualification-driven switching costs and engineering/compliance barriers reduce the risk of sustained share loss. The investment case rests on the durability of grid reliability spending, the likelihood of repeat replacement demand, and the company’s ability to protect margins through mix, manufacturing efficiency, and disciplined pricing—despite cyclical variation in project timing.


⚠ AI-generated — informational only. Validate using filings before investing.

📰 Market News & Coverage

15 Stories Available

Real-time institutional reporting and market updates for PLPC.

zacks.com2026-05-30

2 Small Cap Power Plays With Data Center Optionality

PLPC and ACFN are two small caps in the power space.

gurufocus.com2026-05-22

Preformed Line Products Co (PLPC) Stock Up 4.9% but GF Value Says Overvalued -- GF Score: 80/100

On May 22, 2026, Preformed Line Products Co (PLPC) shares rose 4.9% today, reflecting a strong performance amidst a backdrop of significant gains over the past

fool.com2026-05-08

This Fund Cashed Out of Preformed Line Products Amid a 150% Stock Surge

Preformed Line Products designs and manufactures network hardware for utilities and telecoms across global infrastructure markets.

prnewswire.com2026-05-05

PLP EXPANDS GLOBAL SUBSTATION PORTFOLIO WITH ACQUISITION OF DELTA STAR CONETORES ELÉTRICOS LTDA

CLEVELAND, May 5, 2026 /PRNewswire/ -- Preformed Line Products Company (Nasdaq: PLPC), a global leader in the design and manufacture of innovative solutions for the energy and communications industries, today announced the acquisition of Delta Star Conetores Eletricos Ltda., a Brazil-based manufacturer specializing in high-voltage (HV) and extra-high-voltage (EHV) substation connectors.

zacks.com2026-05-04

Preformed Line Products Q1 Earnings Fall Y/Y, Sales Rise 19%

PLPC posts strong y/y sales growth in Q1, but higher costs and a tax charge lead to a decline in earnings.

prnewswire.com2026-04-29

PREFORMED LINE PRODUCTS ANNOUNCES FIRST QUARTER 2026 FINANCIAL RESULTS

CLEVELAND, April 29, 2026 /PRNewswire/ -- Preformed Line Products Company (NASDAQ: PLPC) today reported financial results for its first quarter of 2026. Q1 2026 highlights: Quarterly net sales of $176.3 million, an increase of 19% from Q1 2025.

gurufocus.com2026-04-24

Is Preformed Line Products Co (PLPC) Overvalued After 6.9% Rally? GF Value Says Overvalued

On April 24, 2026, Preformed Line Products Co (PLPC) shares rose 6.9%, bringing the current price to $351.17. The stock has experienced significant price perfor

defenseworld.net2026-03-28

Analyzing American Battery Technology (NASDAQ:ABAT) and Preformed Line Products (NASDAQ:PLPC)

Preformed Line Products (NASDAQ: PLPC - Get Free Report) and American Battery Technology (NASDAQ: ABAT - Get Free Report) are both small-cap computer and technology companies, but which is the superior business? We will contrast the two companies based on the strength of their valuation, analyst recommendations, earnings, risk, institutional ownership, profitability and dividends. Profitability This table

seekingalpha.com2026-03-23

Preformed Line Products: Still A Strong Buy For Exposure To Grid Restructuring

Preformed Line Products remains a prime beneficiary of U.S. grid modernization and AI data center power demand. Q4 net sales grew 4% year-over-year, with the order backlog surging 22%, validating sustained demand for PLPC's transmission components. Gross margin compressed to 29.8% in Q4, in line with expectations, as tariff-driven costs are pushed through accounting methods before the recovery begins.

prnewswire.com2026-03-18

PREFORMED LINE PRODUCTS ANNOUNCES QUARTERLY DIVIDEND

CLEVELAND, March 18, 2026 /PRNewswire/ -- The Board of Directors of Preformed Line Products (Nasdaq: PLPC) on March 13, 2026, declared a regular quarterly dividend in the amount of $0.21 per share on the Company's common shares, payable April 20, 2026, to shareholders of record at the close of business on April 1, 2026. ABOUT PLP PLP protects the world's most critical connections by creating stronger and more reliable networks.

zacks.com2026-03-11

Preformed Line Products Q4 Earnings Fall, Sales Rise 4% Y/Y

PLPC posts higher y/y sales but lower earnings in Q4 as tariffs and rising input costs pressure margins despite strong demand in energy and communications markets.

prnewswire.com2026-03-04

PREFORMED LINE PRODUCTS ANNOUNCES FOURTH QUARTER AND FULL YEAR 2025 FINANCIAL RESULTS

CLEVELAND, March 4, 2026 /PRNewswire/ -- Preformed Line Products Company (NASDAQ: PLPC) today reported financial results for its fourth quarter of 2025 and full year ended December 31, 2025. Q4/Full Year 2025 highlights: Quarterly net sales of $173.1 million, an increase of 4% from Q4 2024 Annual net sales growth of 13% from 2024, totaling $669.3 million Full year diluted EPS of $7.14; adjusted full year diluted EPS of $8.70, a 16% increase from 2024 Backlog increased 22% to $232.8 million, reflecting robust demand in core markets Quarterly dividend increased 5% to $0.21 per share Net sales in the fourth quarter of 2025 were $173.1 million compared to $167.1 million in the fourth quarter of 2024, a 4% increase.

seekingalpha.com2026-02-20

Preformed Line Products Company's Epic Run Is Almost Over

Preformed Line Products Company remains a soft 'Buy' as rapid revenue and cash flow growth outpace the S&P 500. PLPC's U.S. and Americas segments are driving expansion, fueled by BEAD program funding and a strategic acquisition in Brazil. Despite fair valuation multiples, PLPC trades at a discount to peers, supporting continued upside potential.

defenseworld.net2026-02-18

Preformed Line Products Company $PLPC Shares Sold by Denali Advisors LLC

Denali Advisors LLC lessened its holdings in Preformed Line Products Company (NASDAQ: PLPC) by 72.0% during the undefined quarter, according to the company in its most recent 13F filing with the Securities and Exchange Commission. The fund owned 1,724 shares of the technology company's stock after selling 4,441 shares during the period. Denali

defenseworld.net2026-01-25

SG Americas Securities LLC Purchases Shares of 2,380 Preformed Line Products Company $PLPC

SG Americas Securities LLC acquired a new position in Preformed Line Products Company (NASDAQ: PLPC) in the third quarter, according to its most recent filing with the Securities and Exchange Commission. The institutional investor acquired 2,380 shares of the technology company's stock, valued at approximately $467,000. Several other institutional investors have also recently

📊 AI Financial Analysis

Powered by StockMarketInfo
Earnings Data: Q Ending 2026-03-31

"PLPC delivered Q1’26 revenue of $176.3M and net income of $10.5M (EPS $2.15). Revenue grew 1.8% QoQ (vs. $173.1M in Q4’25) and rose 18.7% YoY (vs. $148.5M in Q1’25). Net income increased 24.7% QoQ (vs. $8.4M) and jumped 8.7% YoY (vs. $11.5M in Q1’25). Profitability improved sequentially: gross margin expanded to 31.3% from 29.8% in Q4’25, and net margin rose to 6.0% from 4.9%. Over the last four quarters, operating income and net margin show a more constructive path than the weak Q3’25 print, with Q1’26 sustaining higher margins and stronger profitability. Cash flow quality was mixed: operating cash flow was $6.0M in Q1’26 and free cash flow was -$3.9M, with cash down $14.0M during the quarter. The company continues to return capital via buybacks ($0.7M repurchased) and dividends ($1.1M), while maintaining a strong balance sheet (total assets $661.8M; equity $473.5M) and low leverage (net debt remains negative). Total shareholder returns appear strong given momentum: the stock is up ~127% over the last year, which materially supports the “total return” score, despite near-term FCF softness. Analyst consensus price target is $275 vs. current ~$318.6, implying the stock trades above the consensus valuation."

Revenue Growth

Good

Q1’26 revenue $176.3M grew 1.8% QoQ and 18.7% YoY, indicating solid YoY momentum despite modest sequential growth.

Profitability

Positive

Net income $10.5M up 24.7% QoQ and 8.7% YoY. Net margin improved to 5.97% in Q1’26 from 4.87% in Q4’25; gross margin also expanded (31.3% vs. 29.8%).

Cash Flow Quality

Caution

Operating cash flow was $6.0M in Q1’26 (down vs. $21.9M in Q4’25), and free cash flow was -$3.9M; dividends and buybacks continued though near-term FCF weakened.

Leverage & Balance Sheet

Good

Balance sheet remains resilient: total assets $661.8M; equity ~$473.5M. Net debt is negative (-$63.9M), and leverage ratios remain very low.

Shareholder Returns

Strong

Strong capital appreciation: 1Y change +127%. Cash returns continued (dividends $1.1M; small buyback), but FCF softness tempers sustainability confidence.

Analyst Sentiment & Valuation

Neutral

Consensus target $275 is below the current price (~$318.6), suggesting the stock is trading above analyst expectations/valuation in the near term.

Disclaimer:This analysis is AI-generated for informational purposes only. Accuracy is not guaranteed and this does not constitute financial advice.

Fundamentals Overview

Loading fundamentals overview...

📋 Official Regulatory 10-K / 10-Q SEC Filings

Direct authenticated documentation links to audited SEC database reports for PLPC.

SEC EDGAR Live Feed
Loading financial data and tables...
📁

SEC Filings (PLPC)

© 2026 Stock Market Info — Preformed Line Products Company (PLPC) Financial Profile