Papa John's International, Inc.

Papa John's International, Inc. (PZZA) Market Cap

Papa John's International, Inc. has a market capitalization of $983.8M.

Price: $29.90

-0.33 (-1.09%)

Market Cap: 983.77M

NASDAQ · time unavailable

CEO: Todd Allan Penegor

Sector: Consumer Cyclical

Industry: Restaurants

IPO Date: 1993-06-08

Website: https://www.papajohns.ca

Papa John's International, Inc. (PZZA) - Company Information

Market Cap: 983.77M|Sector: Consumer Cyclical

Company Profile

Papa John's International, Inc. is a global pizza chain that manages and grants franchises for its Papa John's branded delivery and take-out restaurants across the United States and internationally. The company's operations are divided into four primary segments: company-owned restaurants within the U.S., commissary services for North America, North American franchising, and its international ventures. Beyond its core model, Papa John's also runs dine-in and delivery establishments in various international markets. By December 26, 2021, the Papa John's network spanned 5,650 locations across 50 different countries and territories, comprising 600 directly owned by the company and 5,050 operating as franchises. Established in 1984, the company's corporate headquarters are located in Louisville, Kentucky.

Analyst Sentiment

56%
Buy

From 15 Active Polls

1Y Forecast: $37.00

▲ +23.7% Potential Upside

Consensus Target Metrics

Low Bound

$32

Median

$37

High Bound

$42

Average

$37

Price & Moving Averages

Loading chart...

🎯 Wall Street Analyst Intelligence Report

1-Year structural target targets, chart projections, and sentiment maps.

Average 1Y Target
$37.00
▲ +23.75% Upside
Low Target
$32.00
7% Risk
Median Target
$37.00
24% Mid
High Target
$42.00
40% Max
Consensus
Buy
18 / 32 Buys

Consensus Trend Projection

Trailing closures vs. 12-month metrics map.

Analyst Vote Distribution

Aggregate institutional coverage sentiment weights.

📊 Historical Valuation Multiples

Real-time Trailing Twelve Month (TTM) momentum side-by-side with discrete quarterly metrics.

Fiscal QuarterTTMQ1 2026Q4 2025Q3 2025Q2 2025Q1 2025Q4 2024Q3 2024Q2 2024
Period EndingTrailing 12MMar 29, 2026Dec 28, 2025Sep 28, 2025Jun 29, 2025Mar 30, 2025Dec 31, 2024Sep 29, 2024Jun 30, 2024
Market Cap ($M)9841,0671,2921,5761,6081,3471,3451,7641,505
Enterprise Value ($M)1,8971,9802,3482,4872,5412,2872,2792,7062,441
Price to Earnings Ratio (P/E)35.6038.5646.8185.5743.7036.6822.8210.5231.06
Price/Earnings-to-Growth Ratio (PEG)20.864.83
Price to Sales Ratio (P/S)0.492.232.593.103.042.602.533.482.96
Price to Book Ratio (P/B)-2.19-2.38-2.90-3.59-3.72-3.12-3.13-4.09-3.26
Price to Free Cash Flow Ratio (P/FCF)27.40-169.43220.0583.4092.2270.4853.40-458.29108.46
Enterprise Value to Sales (EV/Sales)4.144.714.894.804.414.295.344.81
Enterprise Value to EBITDA (EV/EBITDA)7.9451.4620.2560.5458.6554.0549.1032.8153.28
Debt to Equity Ratio3.83-2.12-2.46-2.16-2.24-2.28-2.26-2.23-2.08

📘 Full Research Report

ℹ️

AI-Generated Research: This report is for informational purposes only.

📘 PAPA JOHNS INTERNATIONAL INC (PZZA) — Investment Overview

🧩 Business Model Overview

Papa Johns operates primarily through a franchising model, where franchisees own and operate the stores while the franchisor provides brand standards, operating systems, training, and in many cases centralized supply and technology platforms. The economic structure is designed so that the franchisor participates in franchisee performance through royalties and related fees, while avoiding much of the direct capital burden of owning restaurants. This creates a system-level value chain: (1) consumer demand drives store sales at the franchise level, (2) those sales generate recurring franchisor economics through contractually defined revenue streams, and (3) the franchisor can influence quality and efficiency through standardized processes and supplier/technology relationships.

💰 Revenue Streams & Monetisation Model

Revenue is principally driven by franchisor economics rather than restaurant-level food sales. Key monetisation channels typically include:
  • Royalties tied to franchise sales, providing a recurring “take-rate” on system performance.
  • Franchise and related fees (e.g., initial and renewal fees), which add episodic but potentially recurring cash flows as the store base expands.
  • Advertising fund contributions, where the franchisor participates in centrally managed brand-building spend (the economics depend on the fund’s structure and how it flows to campaigns).
  • Supply-chain and technology-related revenue, where centralized procurement and digital ordering tools can improve unit economics and raise system-wide compliance—often with incremental margin.
Margin drivers are largely “system-sales levered”: royalty economics tend to scale with franchise performance, while corporate-level costs are comparatively constrained versus an owned-and-operated restaurant base. The strongest structural profit contribution generally comes from the combination of stable royalty rates, mix shifts that raise average ticket and frequency, and procurement/operational programs that protect franchisee profitability (supporting long-run store viability and renewals).

🧠 Competitive Advantages & Market Positioning

Papa Johns competes in a mature, fragmented U.S. pizza market where winning depends on service convenience, product consistency, and operational execution across delivery and carryout. The moat is not “hard” switching costs for consumers; instead, it is primarily a system-level operating and franchising advantage supported by standardized execution and network-scale procurement. Primary moat elements:
  • Franchise system economics & contractual stickiness: franchise agreements, training, brand standards, and compliance requirements create durable relationships between the franchisor and store operators.
  • Cost and execution advantage through scale: centralized or preferred sourcing, standardized food and preparation systems, and operating discipline can reduce waste and variability for franchisees.
  • Intangible assets: trademarks and proprietary operating know-how are defensible in practice through brand guidelines, menu/IP continuity, and system-level processes (competitors can imitate formats, but replicating a mature operating system across a network is harder).
  • Digital ordering ecosystem (data/operational learning): ordering channels and loyalty/personalization programs can improve conversion and frequency, supporting the system’s demand stability.
Competitive benchmarking (industry focus versus peers):
  • Domino’s Pizza: Domino’s scales aggressively on delivery logistics and a highly optimized digital funnel. Domino’s strength is operational execution paired with technology-led ordering.
  • Pizza Hut (Yum Brands): Pizza Hut competes through national brand scale and menu breadth, often emphasizing dine-in recovery and promotional intensity.
  • Little Caesars: Little Caesars tends to compete more directly on price-value positioning and simpler menu economics.
Positioning contrast: Papa Johns’ differentiation leans more heavily on franchised system-level execution—standardized product quality, operating systems, and cost discipline—rather than a pure price-led model. Versus Domino’s, the central challenge is sustaining delivery/digital efficiency and conversion; versus Pizza Hut and Little Caesars, the strategic focus is protecting unit economics while maintaining demand quality.

🚀 Multi-Year Growth Drivers

Over a 5–10 year horizon, growth is supported by structural demand trends and the scaling mechanics of a franchising-led model:
  • Delivery and carryout mix: convenience remains a durable driver in away-from-home food consumption, benefiting brands with repeatable operations.
  • Digital ordering expansion: growth in app/web ordering can increase ordering frequency, reduce friction, and support personalization and loyalty strategies.
  • Menu and value architecture: disciplined innovation (limited-time offers, optimized core menu, and targeted bundles) can improve average check and frequency without requiring broad structural changes to store operations.
  • Franchise network expansion: the long-run addressable market benefits from continued store placement, especially in markets where brand standards and supply/tech enable scalable performance.
  • Unit economics improvements: ongoing optimization in labor scheduling, preparation systems, and waste control can raise franchisee profitability—supporting store stability and reducing churn.
TAM expansion is tied less to category growth alone and more to gaining share within a growing convenience-led consumption pattern, while maintaining franchisee viability.

⚠ Risk Factors to Monitor

  • Food and labor inflation: commodity and wage pressures can compress franchisee margins, potentially leading to slower growth, store closures, or reduced compliance/quality.
  • Promotional intensity and pricing pressure: the pizza category often cycles through competitive promotions; persistent price competition can pressure system sales and royalty economics.
  • Franchisee concentration and credit health: franchise performance depends on operator economics and local market conditions; deterioration can impact renewals and long-term system growth.
  • Brand perception and quality execution: food quality consistency is central to customer retention; quality issues can carry reputational risk and raise marketing costs.
  • Technology/distribution disruption: competitors may outperform in delivery logistics, digital conversion, and loyalty engagement; losing that advantage can reduce demand stability.
  • Regulatory and compliance changes: labor regulations, nutrition/labeling rules, and franchise disclosure requirements can alter operating costs and constraints.

📊 Valuation & Market View

Markets typically value franchisors like Papa Johns using a blend of EV/EBITDA and P/S (reflecting system sales and asset-light economics), with additional emphasis on metrics tied to franchised performance. Value is most sensitive to:
  • System sales trends (royalty base growth, frequency and average ticket dynamics).
  • Store count trajectory (net unit growth, franchise renewals, and reinvestment cadence).
  • Franchisor margin durability (royalty/mix stability, corporate cost discipline, and technology/supply contributions).
  • Franchisee health (credit conditions, labor/food pass-through ability, and store survival rates).
As the business remains heavily linked to franchise performance rather than owned asset base, investor focus tends to cluster around predictable cash-flow drivers and resilience through commodity and labor cycles.

🔍 Investment Takeaway

Papa Johns offers an evergreen franchising-led investment profile in a convenience-driven category. The primary investment case rests on system-level stickiness via franchise economics and brand/operator standards, supported by scale-derived cost and execution advantages and a digital ordering ecosystem that supports repeat demand. The central debate is whether competitive delivery/digital capabilities and promotional discipline can preserve system sales quality and franchisee viability across a full cycle.


⚠ AI-generated — informational only. Validate using filings before investing.

📰 Market News & Coverage

15 Stories Available

Real-time institutional reporting and market updates for PZZA.

247wallst.com2026-07-24

These 4 Stocks Fit the Ideal LBO Target Profile Right Now

In private equity, pulling a public company off the market requires an alignment of the stars.

proactiveinvestors.com2026-07-14

Ora Banda boosts Davyhurst gold resources by 75% as reserves more than double

Ora Banda Mining Ltd (ASX:OBM, OTC:ESGFF) has delivered a major expansion of its Davyhurst Gold Project inventory, lifting mineral resources by 75% to 3.69...

proactiveinvestors.com2026-07-14

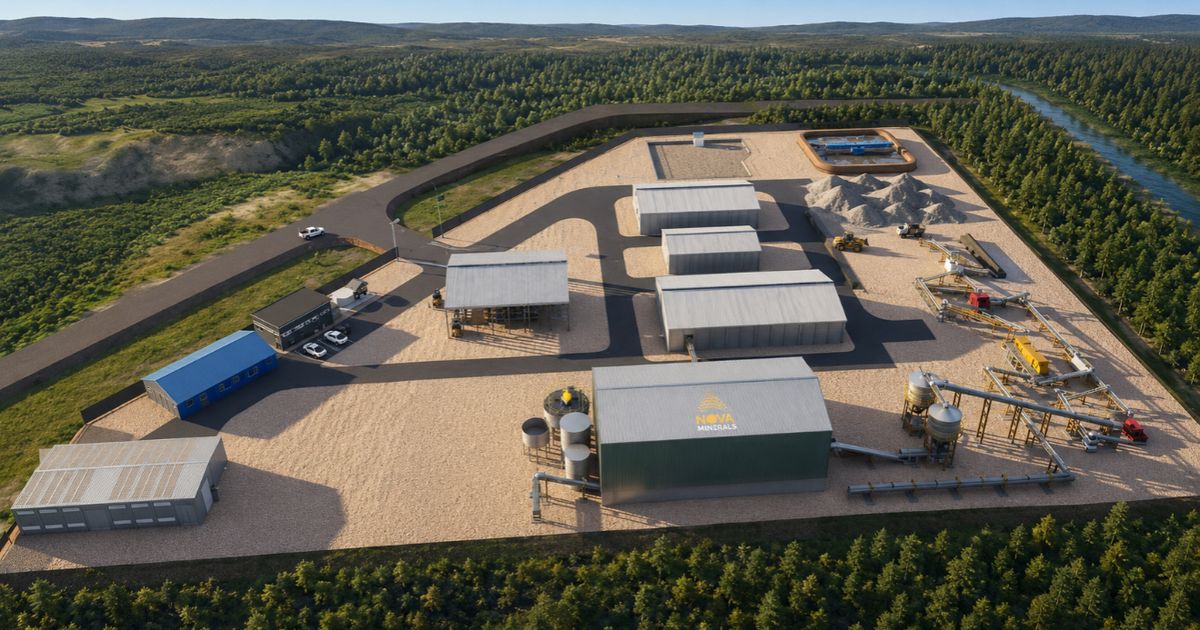
Nova Minerals completes design of Alaska antimony pilot plant, construction set to begin

Nova Minerals Corp (ASX:NVA, NYSE-A:NVA, FRA:QM30) has completed engineering and design work for its fully funded Estelle antimony pilot processing plant in...

proactiveinvestors.com2026-07-14

Alkane Resources extends high-grade gold-antimony mineralisation at Brunswick South

Alkane Resources Ltd (ASX:ALK, OTC:ALKEF) extended high-grade gold and antimony mineralisation at the Brunswick South deposit, strengthening its potential...

proactiveinvestors.com2026-07-14

Small Cap Watch: biotech, gold and critical minerals explorers deliver key milestones

The S&P/ASX Small Ordinaries Index (ASX:XSO) slipped 25.1 points, or 0.74%, to 3,367.6, extending its five-day decline to 1.68% as weakness across the...

proactiveinvestors.com2026-07-13

Papa John's downgraded on turnaround concerns, lower forecasts

Papa John's International Inc (NASDAQ:PZZA) was downgraded to 'Underperform' from 'Neutral' by Bank of America, with analysts citing the company's chief financial officer's departure, persistent competitive pressures and a less optimistic outlook for same-store sales growth (SSSG). The brokerage lowered its price objective to $34 from $42, in line with current levels, and reduced its earnings forecasts, writing that former CFO Ravi Thanawala's departure "suggests rapid SSSG turn unlikely.

proactiveinvestors.com2026-07-13

Wall Street closes lower as chip selloff and oil surge weigh on markets

4:15pm: Big bank earnings up tomorrow US stocks kicked off the week on a weaker note Monday as rising tensions between the United States and Iran rattled...

proactiveinvestors.com2026-07-13

Papa John's downgraded on turnaround concerns, lower forecasts

Papa John's International Inc (NASDAQ:PZZA) was downgraded to 'Underperform' from 'Neutral' by Bank of America, with analysts citing the company's chief...

benzinga.com2026-07-13

This Papa John's Analyst Turns Bearish; Here Are Top 5 Downgrades For Monday

Top Wall Street analysts changed their outlook on these top names. For a complete view of all analyst rating changes, including upgrades, downgrades and initiations, please see our analyst ratings page.

247wallst.com2026-07-13

Here Are Monday's Best Wall Street Analyst Research Calls: Atmos Energy, Best Buy, Biogen, Capital One, Costco, Disney, Papa John's International, Shopify, and More

Futures are trading lower as we get ready for the start of second-quarter earnings this week, after a solid winning week on Wall Street.

benzinga.com2026-06-30

Papa John's Stock Slips On CFO Surprise Exit

Papa John's International, Inc. (NASDAQ:PZZA) shares slipped in after-hours trading following news that Chief Financial Officer Ravi Thanawala will step down, effective immediately.

businesswire.com2026-06-30

Papa Johns Announces CFO Transition

LOUISVILLE, Ky.--(BUSINESS WIRE)--Papa Johns announces CFO transition.

businesswire.com2026-06-30

Papa Johns to Report Second Quarter 2026 Results on August 6, 2026

LOUISVILLE, Ky.--(BUSINESS WIRE)--Papa Johns announces Q2 earnings call details.

globenewswire.com2026-06-16

Kamloops Student-Athlete Awarded $25,000 Champions of Tomorrow Scholarship at Memorial Cup

EDMONTON, Alberta, June 16, 2026 (GLOBE NEWSWIRE) -- Papa Johns Canada and the Canadian Hockey League (CHL) proudly announced Griffin Seafoot of Kamloops, British Columbia, as the recipient of the Champions of Tomorrow Scholarship during the championship game of the 2026 Memorial Cup presented by Kubota on May 31. Seafoot was honoured on ice and awarded the $25,000 scholarship.

foxbusiness.com2026-06-11

Papa Johns shuts down dozens of locations across 17 states as fast-food competition intensifies

Papa Johns follows through on plans to close 300 stores, targeting franchise-owned locations generating less than $600,000 in annual sales by 2027.

📊 AI Financial Analysis

Powered by StockMarketInfo
Earnings Data: Q Ending 2026-03-29

"PZZA reported Q1 2026 revenue of $478.6M and net income of $15.2M (EPS $0.21). On a YoY basis, revenue declined (vs. $518.3M in Q1 2025; ~-7.6% YoY) while net income improved (vs. $9.2M; ~+65% YoY). QoQ, revenue fell (vs. $498.2M in Q4 2025; ~-3.9% QoQ) and net income also rose (vs. $7.1M; ~+115% QoQ). Margins improved meaningfully: gross margin expanded to ~28.8% from ~29.3% in Q1 2025 (slightly down) but rose versus Q4 2025 (~15.5%), while net margin improved to ~3.2% from ~1.4% in Q4 2025. Operating income grew to $20.8M (margin ~4.3%). Cash flow quality appears mixed but directionally okay: operating cash flow was only $7.2M in the quarter, resulting in negative free cash flow of about -$6.2M after capex. Importantly, dividends remain material relative to earnings/cash generation (dividends paid ~$15.3M in Q1). Balance sheet shows weak equity (reported total stockholders’ equity of about -$437M) with elevated total liabilities; despite that, liquidity (cash ~$39M) increased slightly QoQ. Total shareholder return is supported by price momentum: the stock is up ~+20.7% over 1 year, and dividend yield is ~1.4%. Analyst targets (consensus ~$39.33) imply upside versus the current ~$37.46 price."

Revenue Growth

Caution

Revenue declined ~-7.6% YoY (Q1 2026 vs Q1 2025) and ~-3.9% QoQ (vs Q4 2025), indicating contracting top-line momentum.

Profitability

Positive

Net income improved ~+65% YoY and ~+115% QoQ. Net margin rose to ~3.2% from ~1.4% in Q4 2025, reflecting margin expansion despite modest YoY revenue decline.

Cash Flow Quality

Neutral

Operating cash flow was $7.2M with free cash flow of about -$6.2M in Q1, while dividends remained large (~$15.3M). Cash generation in the quarter looks insufficient to fully fund returns without relying on operating fluctuations.

Leverage & Balance Sheet

Caution

Balance sheet equity is negative (total stockholders’ equity ~- $437M) with high leverage indicated by negative equity ratios and large liabilities. Liquidity improved slightly vs Q4.

Shareholder Returns

Positive

1Y price momentum is strong (+20.7%) and dividend yield is ~1.4%. However, buybacks are not evident in the cash flow (repurchases 0), so support comes mainly from price and dividends.

Analyst Sentiment & Valuation

Neutral

Consensus price target (~$39.33) is above the current ~$37.46, suggesting modest upside. Valuation multiples in the provided ratios appear elevated, but the 1Y move boosts sentiment.

Disclaimer:This analysis is AI-generated for informational purposes only. Accuracy is not guaranteed and this does not constitute financial advice.

Fundamentals Overview

Loading fundamentals overview...

Papa John’s Q1 2026 shows resilient 4-wall performance in company-owned restaurants (+140 bps to 11.9% margin) while North America overall remains pressured by transactions, not check. Consolidated revenue fell 8% and adjusted EBITDA dropped ~$2M to ~$48M as lower sales/volumes and supply-chain food cost increases more than offset international strength. Management is leaning on a transformation plan with quantified targets: at least 160 bps 4-wall EBITDA improvement by 2028 from supply chain productivity, and 200 bps medium-term store profitability gains. They closed 44 of 300 underperforming locations and highlighted a 400 bps operational execution gap they plan to close via coaching/incentives. The growth playbook is innovation + simplified operations: Pan Pizza, oven-toasted sandwiches, Cheesy Garlic Bread sides, and a major Disney/Pixar Toy Story 5 activation tied to June 19. Guidance stays conservative: North America comps down 2% to 4% with reliance on a 3-year stack model amid heavy promotional competition.

AI IconGrowth Catalysts

  • Pan Pizza (launched end of January) repurchase rates; plan to drive trial/awareness in North America and expand to priority international markets
  • Oven-toasted sandwiches (launched end of March) integrated into Papa Pairings; contributing to sales expansion and already exceeding Papadias without complicating makeline
  • Cheesy Garlic Bread side (introduced April) designed to be a strong add-on to drive higher ticket and expand non-pizza sales
  • Toy Story 5 theatrical collaboration (June 19) driving Toy Story-themed in-app game earnings (Papa Rewards) and new Toy Story 5 personal pizzas; planned activation via custom packaging and Pixar spot
  • U.K. Artisanal Salerno pizza launch last month to attract new customers with a lighter, thinner, premium pizza positioning

Business Development

  • Global collaboration with Disney/Pixar for Toy Story 5 (theatrical release June 19); includes custom animated spot by Pixar Animation Studios and collectible for customers at participating international restaurants
  • Retail distribution for Papa John’s garlic sauce across 7,500 points at Walmart, Kroger, Albertsons, Safeway and other leading retailers (summer launch)
  • Google Cloud partnership to transform digital ordering using Google’s Food AI; includes agentic ordering and deal application for Papa Rewards members
  • Reinstated U.S. advertising co-ops: 50% of the U.S. restaurant system supported by local co-ops across 50+ markets
  • Franchise reconfiguration: refranchising 85 corporate restaurants completed in Q4 2025; ongoing negotiations to refranchise 29 restaurants in the Southeast expected to close in Q3 2026

AI IconFinancial Highlights

  • International comparable sales: +3.6% global comps improvement trend; six consecutive quarters of positive international comps
  • U.K. comp acceleration to +11% from +7% in Q4; Middle East +9%; Asia Pacific +5% (supported by Korea strength, product innovation, holiday demand)
  • North America comp: down mid-single digits (orders pressured by lower new customer acquisition); pizzas volumes flat YoY excluding 2 weather-impacted weeks; pies per order +5%
  • Consolidated revenue: $479M, down 8%; domestic company-owned revenue down $31M (85 corporate restaurants refranchised) and commissary revenue down $18M (food cost deflation partially offset by pricing)
  • Consolidated adjusted EBITDA: ~$48M, down $2M; margin pressure from lower sales/QCC volumes (North America) and increased supply chain food costs, partially offset by improved international performance and cost reductions
  • North America commissary adjusted EBITDA margin: 5%, down 230 bps; reflects franchisee food cost subsidies and increased food costs to be covered by later pricing, plus lower volume
  • Domestic company-owned restaurants: 4-wall EBITDA $16.6M; 4-wall margin 11.9%, up 140 bps
  • Supply chain productivity captured: $7M benefits in Q1, equivalent to ~20 bps of 4-wall margin improvement (CFO also cited 24 bps captured to date through Q1)
  • Free cash flow: outflow of $6M vs prior-year cash inflow of $19M (lower net income and normalized incentive payments related to enterprise transformation plan)
  • Weather impact sizing: just under 40 bps impact to Q1 comp drag per management in Q&A

AI IconCapital Funding

  • Total available liquidity: ~$498M; covenant leverage ratio: 3.3x
  • Operating cash flow: $7M provided; free cash flow: $(6)M for Q1
  • No buyback amount disclosed in the provided transcript

AI IconStrategy & Ops

  • Transformation/4-wall margin roadmap: at least 200 bps store-level profitability improvement over medium term; specifically 160 bps 4-wall EBITDA improvement by 2028 through supply chain productivity
  • Q1 supply chain productivity progress: 24 bps margin improvement captured to date (CFO) and ~$7M benefits (~20 bps) recognized
  • Restaurant portfolio optimization: closed 44 of 300 identified locations in Q1; target sites described as decade-old franchise units with AUVs below $600k, primarily generating negative EBITDA
  • Operational coaching initiative: addressing a 400 bps gap between comparable sales performance of lowest vs highest quintile operational scores; plan franchise coaching + financial incentives
  • Technology/automation: to-the-door delivery tracking made brand standard across U.S. system
  • Digital ordering: rolled out advanced voice and group ordering; agentic ordering applies best deals and enables high-speed/seamless reordering for Papa Rewards members
  • New POS pilot: PAR POS piloted in first restaurant in April; integrates inventory, makeline operations, and labor inventory into a single platform; designed to minimize implementation expense via existing hardware

AI IconMarket Outlook

  • 2026 global system-wide sales: flat to low single-digit declines
  • 2026 North America comparable sales: down 2% to 4%
  • April North America comps: trending slightly worse than Q1 YoY, but consistent with Q1 on a 3-year stack
  • North America quarterly comps: expected relatively consistent for remainder of year on a 3-year stack
  • 2026 international comparable sales: increase 2% to 4%
  • Toy Story 5 activation timing: June 19 (theatrical release) with related product/marketing rollout
  • Refranchising: negotiations to refranchise 29 restaurants in the Southeast; expected close in Q3 2026

AI IconRisks & Headwinds

  • North America transaction pressure: declining orders driven by lower new customer acquisition; also small transaction loss (orders with one or no pizzas) while multi-pie orders continue to grow
  • Overall promotional QSR marketplace: industry-wide promotional pressure with some competitors aggressive on price; management noted the challenge of managing consumer value without compressing margins
  • Order leakage in size and limited compelling side price point (management referenced need for sides relevance; guidance reflects current state)
  • Cost headwinds: supply chain food cost increases in Q1 (covered by pricing in subsequent quarters) and franchisee food cost subsidies contributing to commissary margin decline
  • Macro sensitivity: cautious consumer environment; discretionary income impacts referenced via gas prices

Q&A: Analyst Interest

  • Topic: Same-store sales guidance derisking and why a 3-year stack is used: Management said lapping becomes easier in the back half, but they modeled how the business normalizes after “choppiness” from prior years. They cited Q1/early Q2 consistency and increasing promotional/aggregator pressure mid-2025 as the basis for the 3-year approach.
  • Topic: New product categories and complexity risk (sandwiches/pan vs personal pies): Management emphasized operational excellence and “one pass” oven builds. Pan and sandwiches are designed for recalibration and simplified handheld/ciabatta processes. They removed Papadias/Papa Bites—described as major “rhythm breakers”—to keep execution complexity low, including for Toy Story 5 8-inch pizzas.
  • Topic: Decompose North America comp drag into check vs traffic; weather normalization: Management stated check was effectively flat in Q1 and Q2-to-date. The drag came from transactions—especially single-pie/zero-pie orders—while multi-pie orders grew. Weather impact was just under 40 bps; they advised building on the 3-year stack rather than isolating quarter weather effects.

Sentiment: CAUTIOUS

Note: This summary was synthesized by AI from the PZZA Q1 2026 earnings transcript. Financial data is complex; please verify all metrics against official SEC filings before making investment decisions.

📋 Official Regulatory 10-K / 10-Q SEC Filings

Direct authenticated documentation links to audited SEC database reports for PZZA.

SEC EDGAR Live Feed
Loading financial data and tables...
📁

SEC Filings (PZZA)

© 2026 Stock Market Info — Papa John's International, Inc. (PZZA) Financial Profile