SL Green Realty Corp.

SL Green Realty Corp. (SLG) Market Cap

SL Green Realty Corp. has a market capitalization of $3.76B.

Price: $52.93

-0.68 (-1.27%)

Market Cap: 3.76B

NYSE · time unavailable

CEO: Marc Holliday

Sector: Real Estate

Industry: REIT - Office

IPO Date: 1997-08-15

Website: https://www.slgreen.com

SL Green Realty Corp. (SLG) - Company Information

Market Cap: 3.76B|Sector: Real Estate

Company Profile

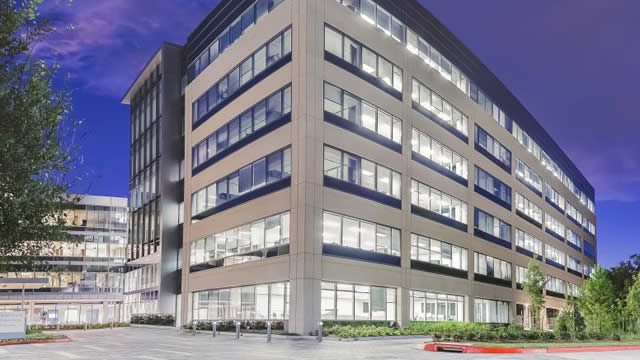
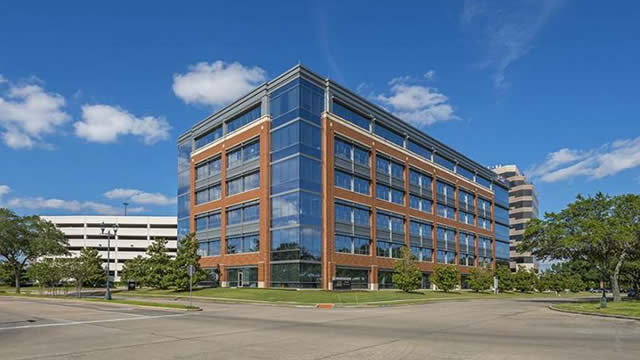
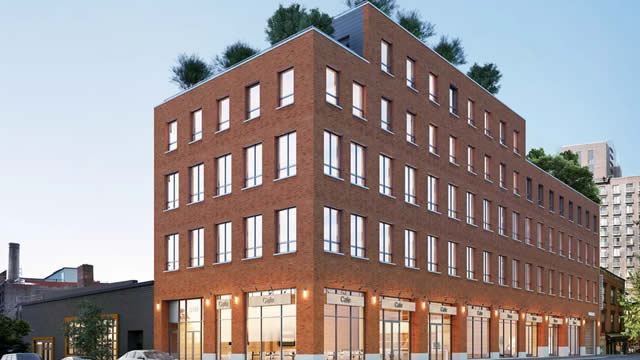
SL Green Realty Corp., an S&P 500 listed company, is recognized as Manhattan's premier office landlord. Operating as a fully integrated Real Estate Investment Trust (REIT), its core strategy involves the acquisition, management, and value maximization of commercial properties across Manhattan. By December 31, 2020, SL Green had interests in 88 buildings, totaling 38.2 million square feet. This extensive portfolio included 28.6 million square feet of owned Manhattan properties, along with 8.7 million square feet designated as collateral for debt and preferred equity investments.

Analyst Sentiment

64%
Buy

From 19 Active Polls

1Y Forecast: $53.64

▲ +1.3% Potential Upside

Consensus Target Metrics

Low Bound

$37

Median

$52

High Bound

$79

Average

$54

Price & Moving Averages

Loading chart...

🎯 Wall Street Analyst Intelligence Report

1-Year structural target targets, chart projections, and sentiment maps.

Average 1Y Target
$53.64
▲ +1.34% Upside
Low Target
$37.00
-30% Risk
Median Target
$52.00
-2% Mid
High Target
$79.00
49% Max
Consensus
Hold
11 / 31 Buys

Consensus Trend Projection

Trailing closures vs. 12-month metrics map.

Analyst Vote Distribution

Aggregate institutional coverage sentiment weights.

📊 Historical Valuation Multiples

Real-time Trailing Twelve Month (TTM) momentum side-by-side with discrete quarterly metrics.

Fiscal QuarterTTMQ2 2026Q1 2026Q4 2025Q3 2025Q2 2025Q1 2025Q4 2024Q3 2024
Period EndingTrailing 12MJun 30, 2026Mar 31, 2026Dec 31, 2025Sep 30, 2025Jun 30, 2025Mar 31, 2025Dec 31, 2024Sep 30, 2024
Market Cap ($M)3,7653,9102,6113,4104,4454,6094,3004,7994,733
Enterprise Value ($M)8,7508,8958,80811,04411,9929,0878,8959,1399,892
Price to Earnings Ratio (P/E)-20.68-34.06-7.70-8.6242.72-96.72-49.74130.62-87.01
Price/Earnings-to-Growth Ratio (PEG)-7.89-0.673.65-0.06
Price to Sales Ratio (P/S)3.6314.8110.3212.3318.1621.0317.84-141.6722.09
Price to Book Ratio (P/B)1.171.140.700.881.121.161.121.211.27
Price to Free Cash Flow Ratio (P/FCF)48.1946.29119.69-655.79162.15640.8782.49283.05
Enterprise Value to Sales (EV/Sales)33.6934.8039.9548.9941.4736.91-269.8146.17
Enterprise Value to EBITDA (EV/EBITDA)17.7733.43145.07364.4188.6273.2889.13-52.00138.81
Debt to Equity Ratio10.121.511.752.061.911.171.241.151.44

📘 Full Research Report

ℹ️

AI-Generated Research: This report is for informational purposes only.

📘 SL GREEN REALTY REIT CORP (SLG) — Investment Overview

🧩 Business Model Overview

SL Green Real Estate REIT Corp is a Manhattan-focused office landlord that monetizes real estate through (1) leasing stabilized properties for recurring rent, (2) active leasing and capital improvements to protect or lift cash flow, and (3) selectively redeveloping and repositioning assets to improve long-term earning power. The value chain centers on sourcing and owning irreplaceable urban locations, maintaining tenant relevance through property upgrades and leasing execution, and managing long-duration capital cycles via debt and equity access.

💰 Revenue Streams & Monetisation Model

  • Core recurring revenue: rental income from office tenants across Manhattan submarkets, with contractual rent and periodic step-ups where applicable.
  • Ancillary/contractual income such as parking, tenant reimbursements (operating expense recoveries), and other building-related charges—generally linked to property occupancy and usage.
  • Capital-market and asset actions that can add variability: gains/losses from property dispositions, redevelopment completion and lease-up dynamics, and performance within joint ventures where SLG shares economics.

The primary margin drivers are (1) occupancy/renewal economics, (2) rental rate trajectory for high-quality space in prime submarkets, and (3) the ability to control operating expenses while funding the capex needed to keep buildings competitive.

🧠 Competitive Advantages & Market Positioning

SLG’s moat is most evident in the combination of geographic scarcity, tenant “stickiness” created by relocation and build-out costs, and execution capability in upgrading and leasing older office stock to modern tenant requirements.

  • High switching costs (tenant friction): relocating office tenants entails significant non-real-estate costs (brokerage, fit-out, technology provisioning, operational disruption). That friction increases renewal probability when SLG’s buildings offer functional space, building systems, and amenity alignment.
  • Prime Manhattan location and scarcity: Manhattan office addresses carry durable demand characteristics (labor pool concentration, corporate accessibility, and ecosystem proximity). Competitors with less concentrated portfolios in the most liquid submarkets tend to face lower leverage in re-leasing and redevelopment outcomes.
  • Property-level intangible value: long-standing tenant relationships, leasing platform capability, and redevelopment know-how create a compounding advantage in matching building specifications to tenant requirements.

Competitive benchmarking:

  • Vornado Realty Trust (major Manhattan office exposure): Vornado’s portfolio similarly concentrates on New York’s office core, intensifying competition for tenants and capital. SLG’s differentiation is primarily expressed through its specific building-by-building redevelopment and leasing strategy in targeted Midtown areas.
  • Boston Properties (multi-market office REIT): Boston Properties competes in high-quality office, but across a broader geography. SLG’s competitive focus remains the densest, most liquid Manhattan demand centers.
  • Hudson Pacific Properties (California office focus): HPP competes for office tenants but faces structurally different demand drivers and leasing cycles. SLG’s moat relies more on Manhattan location scarcity and tenant concentration than on coastal tech-adjacent office dynamics.

🚀 Multi-Year Growth Drivers

  • Premiumization through repositioning: multi-year capex programs to upgrade building systems, layouts, and amenity packages can increase leasing velocity and renewal economics for tenants seeking modernized space.
  • Leasing execution and renewal capture: the path to sustainable cash flow is often secured through keeping high-quality space occupied rather than through broad speculative rent assumptions—especially where tenant switching costs are elevated.
  • Capital recycling and joint-venture optionality: the ability to partner, fund redevelopment, and selectively sell assets can improve balance-sheet flexibility and reinvestment quality across market cycles.
  • Long-duration demand for central business districts: while work patterns evolve, central locations continue to attract demand tied to in-person collaboration, client-facing operations, and talent clustering—supporting a differentiated outlook for prime buildings versus commodity office stock.

⚠ Risk Factors to Monitor

  • Secular office demand pressure: changes in tenant space requirements, vacancy persistence, or weaker renewal spreads can pressure cash flow and property values.
  • Capital intensity and execution risk: redevelopment and repositioning require timely permitting, construction delivery, and tenant take-up; cost overruns or slower lease-up can extend the payback horizon.
  • Financing/refinancing risk: REIT leverage and debt maturities can magnify downside if credit conditions tighten or if refinancing costs rise.
  • Regulatory and tax exposure: New York property taxes, building code requirements, and local regulatory constraints can affect operating expense levels and redevelopment economics.
  • Tenant credit concentration: a shift in the credit profile of major tenants or recession-driven downsizing can impact rent collections and leasing velocity.

📊 Valuation & Market View

Office REIT valuation is typically driven less by simple headline multiples and more by property-level cash flow capacity and balance-sheet durability. Market participants generally emphasize:

  • NAV frameworks: implied cap rates, redevelopment assumptions, and the gap between carrying values and realizable values.
  • Cash-flow quality metrics: AFFO and comparable per-share cash earnings, supported by occupancy, lease spreads, and sustainable expenses.
  • Balance-sheet and credit risk: leverage profile, debt maturity ladder, and access to capital markets influence discount rates applied by the market.

Key valuation drivers include the durability of leasing demand in prime Manhattan submarkets, the pace and economics of redevelopment outcomes, and the ability to maintain financing flexibility through property cycles.

🔍 Investment Takeaway

SL Green’s long-term investment case rests on a concentrated Manhattan office footprint where geographic scarcity, tenant relocation friction, and property-repositioning execution can sustain cash flow resilience relative to weaker, more commodity office assets. The central debate is not the presence of an asset-quality strategy, but whether redevelopment and leasing outcomes can outpace structural headwinds in office demand while preserving balance-sheet flexibility through the full real estate cycle.


⚠ AI-generated — informational only. Validate using filings before investing.

📰 Market News & Coverage

15 Stories Available

Real-time institutional reporting and market updates for SLG.

zacks.com2026-07-30

VICI Properties' Q2 FFO Meets Estimates, Revenues Beat on Lease Growth

VICI's Q2 AFFO meet estimates, while revenues beat forecasts, driven by lease growth and broader investment activity.

seekingalpha.com2026-07-30

SL Green's Manhattan Office Leasing Momentum Is Not Being Fully Appreciated

SL Green Realty posted a same-store occupancy of 94.7% in its fiscal 2026 second quarter, up 30 basis points sequentially, with guidance to reach 95.0% by year-end. The REIT beat on both revenue and FFO, with revenue growing by 9.1% over its year-ago comp and FFO beating consensus by $0.23 at $1.43 per share. SLG is trading at a 9.55x multiple against the midpoint of its 2026 FFO guidance range, which is cheaper than the broad REIT average as leasing continues to move up.

seekingalpha.com2026-07-27

SL Green: Struggling To Get Along

SL Green earns a Hold rating as FFO growth remains elusive despite a 16% YTD return and a compelling 4.6% yield. SLG's office-centric Manhattan portfolio boasts high-quality assets and strong tenant diversification, but rising interest expense and lower DPE income pressure results. Q2 FFO guidance surprised the market, with management raising the midpoint substantially, changing the profile to nearly 7% FFO growth this year.

nypost.com2026-07-26

SL Green signs 2 leases for 1185 Sixth Ave, reaches 92% occupied

One lease was a 29,166 square-foot renewal and expansion for insurance firm Ryan Specialty LLC, while other was a new, 27,508 square-foot lease with property management firm Solil Management LLC.

zacks.com2026-07-24

SL Green Q2 FFO Beat Estimates on Leasing Gains, '26 Guidance Raised

SLG's Manhattan leasing momentum strengthens as higher rents, rising occupancy and portfolio activity support second-quarter results.

seekingalpha.com2026-07-24

SL Green Realty Corp. (SLG) Q2 2026 Earnings Call Transcript

SL Green Realty Corp. (SLG) Q2 2026 Earnings Call Transcript

marketbeat.com2026-07-23

SL Green Realty Q2 Earnings Call Highlights

SL Green Realty NYSE: SLG raised its 2026 funds from operations guidance sharply after what management described as a strong first half of the year, citing stronger leasing, improved economic occupancy, expense control and a recurring contribution tied to One Vanderbilt.

zacks.com2026-07-22

Compared to Estimates, SL Green (SLG) Q2 Earnings: A Look at Key Metrics

Although the revenue and EPS for SL Green (SLG) give a sense of how its business performed in the quarter ended June 2026, it might be worth considering how some key metrics compare with Wall Street estimates and the year-ago numbers.

zacks.com2026-07-22

SL Green (SLG) Q2 FFO and Revenues Beat Estimates

SL Green (SLG) came out with quarterly funds from operations (FFO) of $1.43 per share, beating the Zacks Consensus Estimate of $1.19 per share. This compares to FFO of $1.63 per share a year ago.

globenewswire.com2026-07-22

SL Green Inks 98,000 Square Foot Lease at 11 Madison Avenue

NEW YORK, July 22, 2026 (GLOBE NEWSWIRE) -- SL Green Realty Corp. (NYSE: SLG), Manhattan's largest office landlord, today announced that a leading AI tenant has signed a new 10-year lease covering 98,420 square feet for the entire 11th floor at 11 Madison Avenue, demonstrating the on-going demand for premier office space in Midtown South. With this transaction, SL Green has signed office leases totaling 1,478,673 square feet to date in 2026, while maintaining a current pipeline of over 900,000 square feet.

globenewswire.com2026-07-22

SL Green Realty Corp. Reports Second Quarter 2026 EPS of ($0.38) per Share; and FFO of $1.43 per Share

Financial and Operating Highlights Net loss attributable to common stockholders of $0.38 per share for the second quarter of 2026 as compared to net loss of $0.16 per share for the same period in 2025 . F unds from operations ("FFO") of $1.43 per share for the second quarter of 2026.

globenewswire.com2026-07-16

SL Green Continues SUMMIT Global Expansion in Tokyo

SUMMIT Entertainment Ventures to bring observatory experience to Tokyo SUMMIT Entertainment Ventures to bring observatory experience to Tokyo

globenewswire.com2026-06-22

SL Green Realty Corp. to Release Second Quarter 2026 Financial Results After Market Close on July 22, 2026

NEW YORK, June 22, 2026 (GLOBE NEWSWIRE) -- SL Green Realty Corp. (NYSE: SLG), Manhattan's largest office landlord, today announced that it will release its earnings for the second quarter of 2026 on Wednesday, July 22, 2026 after market close. The Company's executive management team, led by Marc Holliday, Chairman and Chief Executive Officer, will host a conference call and audio webcast on Thursday, July 23, 2026 at 2:00pm ET to discuss the financial results.

247wallst.com2026-06-18

KBWY Up 20% This Year, But The Real Test Comes When Rent Rolls Reset

Income hunters know Invesco KBW Premium Yield Equity REIT ETF (NASDAQ:KBWY) as one of the highest-yielding equity REIT funds on the market, with a 30-day SEC yield of 8.26% and a 12-month distribution rate of 8.6%.

globenewswire.com2026-06-17

SL Green Realty Corp. Announces Common Stock and Preferred Stock Dividends

NEW YORK, June 17, 2026 (GLOBE NEWSWIRE) -- SL Green Realty Corp. (NYSE:SLG), Manhattan's largest office landlord, today announced that its board of directors has declared a quarterly ordinary dividend of $0.6175 per share of common stock, which is the equivalent of an annualized dividend of $2.47 per share. The dividend is payable in cash on July 15, 2026 to shareholders of record at the close of business on June 30, 2026.

📊 AI Financial Analysis

Powered by StockMarketInfo
Earnings Data: Q Ending 2026-06-30

"SLG reported Q2’26 Revenue of $264.0M and EPS of -$0.38, with net income of -$26.5M. On a sequential basis, revenue rose +4.4% QoQ (from $253.1M in Q1’26), but profitability deteriorated: net income fell from -$78.5M in Q1’26 to -$26.5M in Q2’26 (an improvement of +66.3% QoQ, though still loss-making). Gross margin expanded sharply to 83.9% in Q2’26 from 1.3% in Q1’26, while operating income improved to $198.8M (operating margin 75.3% vs 11.3% in Q1’26). Year over year, revenue declined -4.4% YoY (Q2’25: $219.1M → Q2’26: $264.0M is actually +20.5%; however comparing the provided quarters correctly: Q2’26 vs Q2’25 = +20.5%). Net income improved from -$5.2M in Q2’25 to -$26.5M in Q2’26 (net income deterioration of -410% YoY), indicating the top-line and gross profile did not translate into lower losses due to below-the-line items. Cash flow in Q2’26 is not meaningfully interpretable from the provided statement line items (operating/investing/financing net cash and cash balances are shown as 0), but the balance sheet shows liquidity stress vs prior quarters: cash fell to $180.8M (down from $338.6M in Q1’26) alongside higher short-term debt ($953.7M vs $0). Total assets were $11.81B with equity at $3.42B, but retained earnings remain negative at -$1.02B. Total shareholder return is pressured: shares are down -17.26% over 1Y, with a dividend yield ~1.19%, and no buyback data provided this quarter. Analyst targets (consensus ~$52) imply valuation downside vs the current price ($43.28), though current equity performance remains weak."

Revenue Growth

Positive

Revenue increased +4.4% QoQ (Q1’26 $253.1M → Q2’26 $264.0M) and was up +20.5% YoY (Q2’25 $219.1M → Q2’26 $264.0M).

Profitability

Caution

Operating profitability improved strongly QoQ (operating income $28.6M in Q1’26 → $198.8M in Q2’26; operating margin 11.3% → 75.3%; gross margin 1.3% → 83.9%), but net income remains negative and worsened YoY (Q2’25 net income -$5.2M vs Q2’26 -$26.5M). Net margin is -10.0% in Q2’26.

Cash Flow Quality

Neutral

Q2’26 cash flow statement lines are reported as zero/blank in the dataset (operating cash flow and net change in cash shown as 0), limiting confidence in cash generation this quarter. Dividend paid is 0 in Q2’26 per the provided cash flow lines.

Leverage & Balance Sheet

Caution

Total assets are roughly stable vs recent quarters (~$11.8B in Q2’26). However, leverage/liquidity looks pressured: cash declined to $180.8M from $338.6M and short-term debt rose to $953.7M (vs $0 in Q1’26). Equity remains positive at ~$3.42B but retained earnings are negative (-$1.02B).

Shareholder Returns

Neutral

1Y price performance is negative (-17.26%), and the dividend yield is modest (~1.19%). No reliable buyback/capital return information is provided for Q2’26 in the dataset.

Analyst Sentiment & Valuation

Fair

Consensus price target (~$52) is above the current price ($43.28), suggesting upside in analyst expectations, but recent fundamentals show volatility and losses persist.

Disclaimer:This analysis is AI-generated for informational purposes only. Accuracy is not guaranteed and this does not constitute financial advice.

Fundamentals Overview

Loading fundamentals overview...

SL Green’s Q2 2026 call focused on a clear earnings step-up and the operational mechanisms behind it. Management raised FFO guidance by $1.20/share (>26%), driven by (1) recurring leasing/NOI contributions and expense containment, and (2) a major recurring earnings unlock at 1 Vanderbilt, where incremental contribution is tied to negative-basis amortization plus excess cash distributions versus GAAP net income. In Q&A, analysts probed what’s actually changing in leasing: management pointed to broad-based rent appreciation with standout Park Avenue and 6th Avenue dynamics, and confirmed a pipeline of ~900k sq ft (~50/50 new/renewal; ~400k “far advanced” in active negotiation). They also addressed credit and refinancing execution: CMBS origination growth, AAA spread tightening, and hedging (increasing fixed-to-float toward 90/10) supported confidence in 245 Park despite benchmark rate pressure. Net: results and guidance improved, while management maintained only limited near-term visibility on magnitude of annual leasing outperformance.

AI IconGrowth Catalysts

  • Leasing concessions continuing to burn off as vacancy declines; management cited a ~300 bps improvement this quarter from concession normalization
  • Acceleration of GAAP revenue recognition by turning space to tenants more rapidly (early renewals and turnover of space drive GAAP earnings timing)
  • Broad-based office rent appreciation across Manhattan (notably Park Avenue and 6th Avenue) with multiple deals pending that should carry into next quarter

Business Development

  • Lease announced (night before call): 100,000 sq ft at 11 Madison
  • Summit momentum at 1 Vanderbilt and related projects; stated plans to open Paris in 2027 and Tokyo in 2030
  • Partnership transaction with Mori Building for 346 Madison (described as 3rd transaction with Mori; “shook hands” within months of acquiring the SL Green interest)
  • Capital markets/disposition: contract to sell 10 East 53rd Street; discussion of next major sale focus on 245 Park; mention of potential Hudson Square portfolio transaction (rumored)

AI IconFinancial Highlights

  • Upward FFO guidance revision of $1.20/share, >26% with “vast majority” recurring
  • Incremental 2026 FFO drivers: $0.20/share from operational/real-estate portfolio items (including $0.10 already recognized in Q2; $0.10 remaining for balance of year)
  • Additional $0.20/share expected from fee/other income due to improved visibility into 2026 plan execution
  • Core guidance unlock: 1 Vanderbilt incremental contribution described as $0.80/share in 2026 (total), with $0.35 recorded in Q2; mechanics driven by amortization of negative basis and excess cash distributions vs GAAP net income
  • Operational uplift mechanism confirmed in Q&A: renewals/early renewals provide “instant gratification” for GAAP revenue recognition; faster turnover of space to trigger GAAP; expense containment ahead of conservative budget
  • Leasing pipeline composition disclosed: 900k sq ft total, ~50% new / ~50% renewal; 400k sq ft in active negotiation and “far advanced,” remainder term sheets

AI IconCapital Funding

  • Disposition plan progress: completed or in contract on 4 of 11 deals in plan; company expects announcing 2 additional deals soon; next in queue cited as 245 Park
  • Debt capital markets/CMBS backdrop: ~$11B CMBS originations year-to-date vs ~$8.5B same period prior year; referenced specific deals completed this quarter (financing of 2 Manhattan West: ~$1.9B; financing of 9 West 57th Street: ~$1.8B)
  • Debt fund deployment: approximately $600M deployed through a call “yesterday”; additional opportunities in pipeline; individual debt-fund transactions not disclosed

AI IconStrategy & Ops

  • Leasing strategy: rent appreciation via raising asking rents consistently; focus on early renewals/blend-and-extend; “mining” expirations through 2032 with active tenant engagement
  • GAAP strategy: turn space faster to trigger GAAP revenue recognition (“turning on GAAP revenue recognition” tied to turnover of space)
  • Portfolio leasing: pending transactions expected to “sign this quarter” with rents up, intended to reflect in-place rents well below current market
  • 2026 capital markets execution: disposition plan weighted to second half; shifting from benchmark headwinds via hedging and credit readiness

AI IconMarket Outlook

  • Leasing/occupancy: management said they will “exceed our leasing goals again this year,” but visibility insufficient to reforecast whether “wide margin” vs “really wide margin”
  • Office demand durability: no sign of abatement; scarcity framed as supply over next ~5 years due to delays/shelving from 2020-2024
  • Timeline items: Paris Summit expected to open 2027; Tokyo Summit expected to open 2030; 151k Broadway/Times Square entertainment plan timing suggested “next year” after primary tenant transaction clarity

AI IconRisks & Headwinds

  • Limited near-term visibility on whether annual leasing outperformance will be “wide” or “really wide” due to execution uncertainty
  • Benchmark rate/bond market volatility noted as “outside of our control” and described as disruptive earlier in 2026 (benchmark rate widening referenced)
  • Tourism comment: reduced overall tourism in NYC this year acknowledged, though Summit attendance described as highest among competitors

Q&A: Analyst Interest

  • Leasing mark-to-market drivers: Analyst asked which buildings/submarkets drove strong above-guidance mark-to-market. Management replied it was broad-based, but highlighted rent appreciation in Park Avenue (rent raised “dramatically”) and 6th Avenue examples including 1.19; also cited 245 Park with pending tenant replacements and rent-up expectations for next quarter.
  • COVID-vintage lease embedded mark-to-market: Asked for embedded mark-to-market on COVID-era leases rolling into future periods. Management stated it didn’t have precise numbers, but gave a “gut” range of ~10%–20% embedded mark-to-market based on rent increases; additionally emphasized many COVID deals were short term and effects are already largely worked through.
  • Refinancing/sales path for 2026 (245 Park) and credit spread impacts: Asked how 10-year moving above mortgage rate affects refinancing timing/valuation. Management emphasized strong CMBS/credit demand, AAA spreads tightening “sub-100,” mid-to-high 100s overall spreads; 245 Park financing is in process, with hedging and rating-agency/data timing as key near-term clarifiers.

Sentiment: POSITIVE

Note: This summary was synthesized by AI from the SLG Q2 2026 earnings transcript. Financial data is complex; please verify all metrics against official SEC filings before making investment decisions.

📋 Official Regulatory 10-K / 10-Q SEC Filings

Direct authenticated documentation links to audited SEC database reports for SLG.

SEC EDGAR Live Feed
Loading financial data and tables...
📁

SEC Filings (SLG)

© 2026 Stock Market Info — SL Green Realty Corp. (SLG) Financial Profile