Schneider National, Inc.

Schneider National, Inc. (SNDR) Market Cap

Schneider National, Inc. has a market capitalization of $6.52B.

Price: $37.21

0.11 (0.30%)

Market Cap: 6.52B

NYSE · time unavailable

CEO: Mark Rourke

Sector: Industrials

Industry: Trucking

IPO Date: 2017-04-06

Website: https://schneider.com

Schneider National, Inc. (SNDR) - Company Information

Market Cap: 6.52B|Sector: Industrials

Company Profile

Schneider National, Inc., together with its subsidiaries, provides surface transportation and logistics solutions in the United States, Canada, and Mexico. The company operates through three segments: Truckload, Intermodal, and Logistics. The Truckload segment offers standard long-haul and regional shipping services primarily through dry van, bulk, temperature-controlled, and flat-bed equipment, as well as cross dock and customized solutions for time-sensitive loads. The Intermodal segment provides door-to-door container on flat car services, including rail and dray transportation through company-owned containers, chassis, and trucks. The Logistics segment offers freight brokerage, supply chain, and import/export services; value-added services to manage and move its customers' freight; and transloading and warehousing services. It also leases equipment, such as trucks to owner-operators; and provides insurance for the company drivers and owner-operators. Schneider National, Inc. was founded in 1935 and is headquartered in Green Bay, Wisconsin.

Analyst Sentiment

49%
Hold

From 16 Active Polls

1Y Forecast: $33.00

▼ -11.3% Potential Upside

Consensus Target Metrics

Low Bound

$26

Median

$35

High Bound

$38

Average

$33

Price & Moving Averages

Loading chart...

🎯 Wall Street Analyst Intelligence Report

1-Year structural target targets, chart projections, and sentiment maps.

Average 1Y Target
$33.00
▼ -11.31% Upside
Low Target
$26.00
-30% Risk
Median Target
$35.00
-6% Mid
High Target
$38.00
2% Max
Consensus
Hold
12 / 25 Buys

Consensus Trend Projection

Trailing closures vs. 12-month metrics map.

Analyst Vote Distribution

Aggregate institutional coverage sentiment weights.

📊 Historical Valuation Multiples

Real-time Trailing Twelve Month (TTM) momentum side-by-side with discrete quarterly metrics.

Fiscal QuarterTTMQ1 2026Q4 2025Q3 2025Q2 2025Q1 2025Q4 2024Q3 2024Q2 2024
Period EndingTrailing 12MMar 31, 2026Dec 31, 2025Sep 30, 2025Jun 30, 2025Mar 31, 2025Dec 31, 2024Sep 30, 2024Jun 30, 2024
Market Cap ($M)6,5174,6164,6483,7094,2334,0065,1395,0004,156
Enterprise Value ($M)6,6884,7875,0074,0374,5984,4765,6325,0854,318
Price to Earnings Ratio (P/E)66.5556.5652.5847.8029.4038.3739.4140.8529.43
Price/Earnings-to-Growth Ratio (PEG)21.2922.048.1922.16
Price to Sales Ratio (P/S)1.153.303.322.552.982.863.843.803.16
Price to Book Ratio (P/B)2.161.531.541.231.411.341.721.691.41
Price to Free Cash Flow Ratio (P/FCF)15.32184.6315.71244.0447.41-76.8883.4276.1170.56
Enterprise Value to Sales (EV/Sales)3.423.582.783.243.194.213.863.28
Enterprise Value to EBITDA (EV/EBITDA)10.9733.1733.7227.1327.3228.6636.9535.1228.07
Debt to Equity Ratio0.280.130.190.170.170.190.200.090.09

SNDR Growth Runway Model

Standard long term linear growth fade

Multi-Stage Discounted Cash Flow Sandbox

Market Price$37.21
Intrinsic Value$18.01
Market Alignment
Overvalued by 51.6%relative to calculated intrinsic value
9.00%
Exp: 1%1%
i

Growth runway slowdown

This value provides a time window for the growth rate to decline beyond Stage 1 toward the terminal rate. Longer windows are most useful for companies with high growth starting conditions or strong competitive advantages. This option stretches out the growth rate slowdown across 5, 10, or 15-year steps. A high-growth starting condition (exceeding a 25% initial growth rate) automatically applies a curve decay to simulate realistic, rapid market saturation.
i

Terminal growth rate

With long-term inflation between 3-5%, revenue must grow by that baseline to maintain flat real-world market share. This value sets the permanent terminal growth rate to factor into the valuation beyond the growth slowdown runway toward maturity.

3-Stage Financial Runway Horizon

🧠 Perpetuity Horizon Engine (Stage 3: Post-2035)

Terminal FCF Base$0.10B
Perpetuity TV Value$1.95B
Discounted TV (PV)$0.82B
TV Weighting %57.8%
⚠️
Financial Model Disclaimer & Risk Disclosure: This interactive scenario simulator is an educational sandbox provided strictly for informational and analytical research purposes. Core historical financial statements and consensus estimates are sourced directly via Financial Modeling Prep (FMP). All downstream outputs are entirely deterministic, hypothetical projections generated by combining automated mathematical formulas (including linear interpolation and Gaussian bell-curve decay models) with user-selected variables and third-party financial data inputs. Users assume all liability for trading decisions executed based on these sandbox calculations.

📘 Full Research Report

ℹ️

AI-Generated Research: This report is for informational purposes only.

📘 SCHNEIDER NATIONAL INC CLASS B (SNDR) — Investment Overview

🧩 Business Model Overview

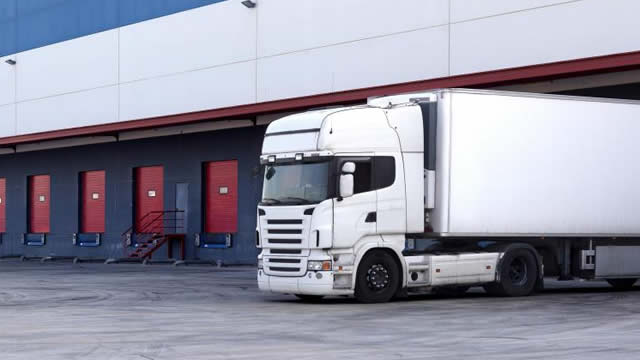
Schneider National operates primarily in the less-than-truckload (LTL) and truckload logistics value chains, supported by a national operating network. In LTL, shippers do not move entire truckloads; instead, they tender freight that is consolidated and routed through a hub-and-spoke system. The model converts dispersed origin-destination demand into efficient capacity utilization by balancing pickup/delivery volumes, lane density, and routing optimization.

Customer stickiness is driven by the operational reality of LTL: reliable pickup windows, damage control, standardized handling, and consistent transit performance across many lanes. Those outcomes depend on Schneider’s network design, terminal locations, and workforce processes—making the business less about “capacity at any price” and more about delivering dependable service at scale.

💰 Revenue Streams & Monetisation Model

Revenue is generated through a mix of weight- and distance-based linehaul and accessorial/service charges. Key monetisation elements include:

  • LTL freight revenue tied to shipments, tonnage, and billable weight per lane.
  • Fuel and related surcharges that partially offset input cost variability.
  • Service/accessorial fees (e.g., dock scheduling, residential/handling requirements, expedited services depending on customer contracts).
  • Truckload and logistics offerings that often monetize through negotiated contracts and managed transportation solutions.

Margin drivers largely reflect (1) yield/price realization versus competitive capacity, (2) network density and load factors that determine cost per unit, and (3) labor and equipment efficiency. In transportation, financial performance tends to be cyclical, but operational discipline and lane productivity influence the durability of earnings power through cycles.

🧠 Competitive Advantages & Market Positioning

Schneider’s core moat is rooted in network-driven switching costs and operational execution advantages. Competitors cannot easily replicate the density, throughput, and service reliability achieved by a mature routing and terminal footprint.

  • Switching costs (service + integration): LTL customers operationally integrate with carriers through tendering systems, standardized packaging/handling practices, and compliance requirements. Switching is costly in time and risk (missed appointment windows, service disruptions, claims).
  • Network effects (lane density): Higher throughput supports more efficient linehaul, better equipment utilization, and lower cost per shipment through optimized routing and consolidation.
  • Cost advantages (scale economics in operations): Coordinated dispatching, terminal productivity, and procurement scale can improve unit economics relative to smaller carriers or less dense networks.

Competitive benchmarking:

  • Old Dominion Freight Line (ODFL): Strong in LTL with a dense network; Schneider competes on broader service coverage and transportation solutions.
  • FedEx Freight (FXF): Competes in LTL with established systems and national reach; Schneider differentiates through routing flexibility and operational execution.
  • J.B. Hunt (JBHT): Materially competes in intermodal and certain truckload segments; Schneider’s positioning centers more on LTL and comprehensive service lanes rather than intermodal dominance.

While rivals may match parts of the service offering, taking sustained share typically requires replicating terminal density, dispatching capability, and claims/service performance—an expensive and time-consuming undertaking.

🚀 Multi-Year Growth Drivers

Over a 5–10 year horizon, growth is supported by structural demand for outsourced transportation and supply-chain complexity. Key drivers include:

  • Ongoing outsourcing of logistics: Shippers increasingly rely on third-party carriers to manage capacity, labor constraints, and service-level risk.
  • Supply-chain reconfiguration: More frequent changes in sourcing, SKU proliferation, and smaller batch sizes increase the need for consolidated freight networks like LTL.
  • E-commerce and omnichannel fulfillment spillover: Even when volumes shift mix, the “middle-mile” demand for multi-stop distribution tends to support LTL utilization.
  • Intermodal and modal efficiency tailwinds: When economics favor rail, intermodal programs can capture freight that benefits from network consolidation—supporting capacity planning and long-term lane development.
  • Share gains from under-served service needs: Carriers with stronger operational execution can win business where service reliability matters more than lowest headline rates.

TAM expansion is less about a single industry cycle and more about the persistently high fragmentation of goods flows across thousands of origins and destinations—conditions that favor scalable, network-based carriers.

⚠ Risk Factors to Monitor

  • Labor and driver availability: Transportation margins are sensitive to wage rates, staffing levels, and retention; persistent labor tightness can raise cost structure.
  • Claims, safety, and service reliability: Operational setbacks can increase cost through claims and undermine pricing power.
  • Freight cyclicality: Industrial activity, consumer demand, and inventory cycles can move volumes and pricing, impacting unit economics.
  • Regulatory and compliance costs: Rules on emissions, hours-of-service, and safety compliance can raise operating costs and require fleet and process adjustments.
  • Capital intensity and depreciation: Sustaining network and equipment quality requires ongoing investment; misallocation of capital can dilute returns.
  • Technology and automation execution: While technology can improve routing and productivity, implementation risk and integration with customer systems can affect near- to medium-term outcomes.

📊 Valuation & Market View

Transportation equities are typically valued on earnings power and cash generation, often using EV/EBITDA or earnings multiples rather than revenue alone. What tends to move valuation materially:

  • Unit economics resilience: Ability to maintain yield and control cost per shipment through cycles.
  • Margin normalization path: Investors focus on whether operating margins stabilize rather than revert sharply downward.
  • Capital discipline: Returns on invested capital, fleet reinvestment efficiency, and free cash flow conversion.
  • Competitive capacity balance: Pricing and utilization can improve when capacity growth lags demand growth; persistent excess capacity compresses spreads.

Given the cyclicality inherent to freight, the market typically rewards carriers that demonstrate consistent operational execution, strong safety/claims discipline, and measured capacity management.

🔍 Investment Takeaway

Schneider National presents a long-term investment thesis anchored in LTL network economics—dense routing, service reliability, and operational execution that create practical switching friction for shippers. The structural demand for outsourced logistics and more complex freight flows supports multi-year utilization, while disciplined cost management and claims performance determine the durability of earnings power. The primary investment risk is freight-cycle volatility amplified by labor and regulatory cost pressures, making monitoring of unit economics and operational metrics essential.


⚠ AI-generated — informational only. Validate using filings before investing.

📰 Market News & Coverage

15 Stories Available

Real-time institutional reporting and market updates for SNDR.

seekingalpha.com2026-06-05

Dividend Champion, Contender, And Challenger Highlights: Week Of June 7

A weekly summary of dividend activity for Dividend Champions, Contenders, and Challengers. Companies which changed their dividends. Companies with upcoming ex-dividend dates.

businesswire.com2026-06-04

Schneider National, Inc. announces participation in upcoming conference

GREEN BAY, Wis.--(BUSINESS WIRE)--Schneider National, Inc. (NYSE: SNDR), a premier multimodal provider of transportation, intermodal and logistics services, today announced participation in the following investment conference: 2026 Wells Fargo Industrials and Materials Conference: Tuesday, June 9, 2026. Jim Filter, Executive Vice President and Group President of Transportation and Logistics, and Darrell Campbell, Executive Vice President and Chief Financial Officer, will participate in a firesi.

zacks.com2026-05-29

Does Schneider's Lower Valuation Indicate a Buying Opportunity?

With SNDR shares moving north, we assess the current positioning of the stock to determine if it's a good investment at this juncture.

seekingalpha.com2026-05-25

Schneider National, Inc. (SNDR) Presents at Wolfe Research 19th Annual Global Transportation & Industrials Conference Transcript

Schneider National, Inc. (SNDR) Presents at Wolfe Research 19th Annual Global Transportation & Industrials Conference Transcript

gurufocus.com2026-05-20

Is Schneider National Inc (SNDR) Overvalued After 4.5% Rally? GF Value Says Overvalued

On May 20, 2026, Schneider National Inc (SNDR) shares rose 4.5% to $33.60, continuing a strong performance with a year-to-date increase of 27.2%. The stock has

businesswire.com2026-05-14

Schneider National, Inc. announces participation in upcoming conference

GREEN BAY, Wis.--(BUSINESS WIRE)--Schneider National, Inc. (NYSE: SNDR), a premier multimodal provider of transportation, intermodal and logistics services, today announced participation in the following investment conference: Wolfe Research Annual Global Transportation & Industrials Conference: Thursday, May 21, 2026. Mark Rourke, President and Chief Executive Officer, and Darrell Campbell, Executive Vice President and Chief Financial Officer, will participate in a fireside chat and a seri.

globenewswire.com2026-05-06

CSX, CPKC upgrade Southeast Mexico Express with dedicated train, faster transit times

JACKSONVILLE, Fla., May 06, 2026 (GLOBE NEWSWIRE) -- CSX Corp. (NASDAQ: CSX) and Canadian Pacific Kansas City (TSX:CP) (NYSE:CP) (CPKC) today announced upgrades to the Southeast Mexico Express (SMX) premium service featuring faster transit times with more origin and destination options for customers looking to reach new markets.

prnewswire.com2026-05-06

CPKC, CSX upgrade Southeast Mexico Express with dedicated train, faster transit times

Direct connection links U.S Southeast to Texas and Mexico markets   CALGARY, AB and JACKSONVILLE, Fla., May 6, 2026 /PRNewswire/ - Canadian Pacific Kansas City (TSX: CP) (NYSE: CP) (CPKC) and CSX Corporation (NASDAQ: CSX) (CSX) today announced upgrades to the Southeast Mexico Express (SMX) premium service featuring faster transit times with more origin and destination options for customers looking to reach new markets.

zacks.com2026-05-04

Schneider National Q1 Earnings Beat Estimates, Decrease Y/Y

SNDR Q1 EPS beat estimates, but revenues miss, profits drop across segments as costs rise, while the company raises its dividend and sets 2026 outlook.

businesswire.com2026-05-04

Schneider marks 35 years of Intermodal expertise: delivering truck-like reliability with increased efficiency

GREEN BAY, Wis.--(BUSINESS WIRE)--Schneider National, Inc. (NYSE: SNDR), a premier multimodal provider of transportation, intermodal and logistics services, is celebrating 35 years of delivering flexible Intermodal solutions that drive efficiency, help control costs and unlock growth for customers. Schneider provides decades of proven, scalable intermodal expertise at a time when shippers need reliability and flexible capacity. The company has differentiated its offering through company-owned a.

seekingalpha.com2026-05-01

Schneider Offers Less Than A 10% Cycle-Average Yield While Reaching Previous Stock Tops

Schneider National reported 1Q26 results showing continued margin compression and revenue declines across all segments, despite management's constructive tone on market tightening. SNDR's operating income fell 20% YoY, with positives like Network productivity and Intermodal volume growth insufficient to offset broad operational weakness. Management maintains full-year EPS guidance of $0.70 to $1.00, citing uncertain demand as a key swing factor despite signs of supply tightening.

zacks.com2026-04-30

Schneider National (SNDR) Q1 Earnings: Taking a Look at Key Metrics Versus Estimates

The headline numbers for Schneider National (SNDR) give insight into how the company performed in the quarter ended March 2026, but it may be worthwhile to compare some of its key metrics to Wall Street estimates and the year-ago actuals.

seekingalpha.com2026-04-30

Schneider National, Inc. (SNDR) Q1 2026 Earnings Call Transcript

Schneider National, Inc. (SNDR) Q1 2026 Earnings Call Transcript

zacks.com2026-04-30

Schneider National (SNDR) Q1 Earnings Beat Estimates

Schneider National (SNDR) came out with quarterly earnings of $0.12 per share, beating the Zacks Consensus Estimate of $0.11 per share. This compares to earnings of $0.16 per share a year ago.

businesswire.com2026-04-30

Schneider National, Inc. Announces First Quarter 2026 Results

GREEN BAY, Wis.--(BUSINESS WIRE)--Schneider National, Inc. (NYSE: SNDR, “Schneider” or the “Company”), a leading transportation and logistics services company, today announced results for the three months ended March 31, 2026. “In the first quarter, we saw the impact of structural supply rationalization which is driving the market toward more normal conditions,” said Mark Rourke, President and Chief Executive Officer of Schneider. “Strong execution on our cost and productivity actions, as well.

📊 AI Financial Analysis

Powered by StockMarketInfo
Earnings Data: Q Ending 2026-03-31

"SNDR reported Q1’26 revenue of $1.40B and net income of $20.4M (EPS $0.12). On a YoY basis, revenue was down -0.2% versus Q1’25 ($1.4018B → $1.3985B), while net income fell -21.8% ($26.1M → $20.4M). QoQ, revenue was essentially flat (-0.1% vs Q4’25), but net income declined -7.7% ($22.1M → $20.4M). Profitability was mixed. Gross margin improved QoQ (37.6% in Q1’26 vs 36.4% in Q4’25) and also expanded versus Q1’25 (37.6% vs 8.3% as reported), while operating margin slipped QoQ (2.39% vs 2.61%) and net margin contracted slightly (1.46% vs 1.58% QoQ). The company remains profitable but with earnings softness this quarter. Cash flow quality appears strong in the reported quarter: operating cash flow was $92.9M and free cash flow was also $92.9M (capex reported as zero). Balance sheet resilience improved with total assets roughly flat ($4.91B → $4.92B), while equity rose materially QoQ ($3.02B → $4.92B) and net debt decreased to ~$160M from ~$359M at Q4’25. Total shareholder returns are supportive given the stock’s 1-year price momentum of +35.31% (and ~0.38% dividend yield). With consensus price target around $27 versus ~$29.39, near-term upside looks limited versus valuation."

Revenue Growth

Neutral

Revenue was -0.2% YoY in Q1’26 (vs Q1’25) and -0.1% QoQ (vs Q4’25), indicating largely steady topline with no clear growth acceleration.

Profitability

Positive

Net income fell -21.8% YoY and -7.7% QoQ. While gross margin improved QoQ and margins remain positive, operating and net margins contracted slightly QoQ.

Cash Flow Quality

Strong

Q1’26 operating cash flow of $92.9M and free cash flow of $92.9M (capex reported as zero) suggest solid cash conversion despite lower earnings.

Leverage & Balance Sheet

Good

Net debt improved to ~$160M (from ~$359M QoQ). Total assets were stable (~$4.91B to ~$4.92B) and equity increased substantially QoQ, supporting balance-sheet resilience.

Shareholder Returns

Good

1-year price performance of +35.31% is strong and should lift total return materially; dividend yield is modest (~0.38%). No buybacks/dividends were recorded in Q1’26 in the cash flow fields.

Analyst Sentiment & Valuation

Fair

Consensus target (~$27) is below the current price (~$29.39), implying limited upside; valuation still appears elevated (high price-to-earnings).

Disclaimer:This analysis is AI-generated for informational purposes only. Accuracy is not guaranteed and this does not constitute financial advice.

Fundamentals Overview

Loading fundamentals overview...

SNDR reported Q1 2026 with EPS at $0.12 (vs $0.16 prior year) as severe winter disruptions and fuel volatility pressured maintenance costs and productivity. Enterprise operating ratio rose 70 bps, with Truckload +80 bps and Intermodal +100 bps. Despite weaker earnings, operating performance improved in key productivity metrics: Network revenue per truck per week rose 7% YoY, and March productivity was the strongest since 2023. Management attributes the structural upcycle to DOT-driven capacity rationalization (noncompliant CDL curtailments, ELD enforcement, English proficiency) and believes supply will exit rapidly and continue leaving the market beyond earlier removals. Guidance stayed unchanged: 2026 EPS $0.70–$1.00 with ~24% effective tax rate, but upside depends on demand inflection amid macro uncertainty (inflation expectations; fewer rate cuts). Management highlighted $40M growing cost savings, disciplined allocation actions, AI initiatives to reduce driver/customer friction, and continued Network and Intermodal share-gain opportunities (Fast Track and Mexico).

AI IconGrowth Catalysts

  • Network early-cycle playbook: dynamic capacity shifting, yield management actions, and cost/productivity extraction
  • Network price renewal momentum: highest level since 2021; 2026 rate renewals expected mid- to high-single digits
  • Intermodal Mexico growth continued momentum, growing double digits
  • Intermodal growth support from asset-based model, Fast Track launch, and differentiated Mexico offering; expected over-the-road conversion at high incremental margins
  • AI-driven headcount actions lowering Intermodal costs (AI-driven productivity/automation mentioned) and additional AI implementation to remove driver friction

Business Development

  • Sold over 150 new trucks in 2026 to date (Dedicated expansion), with customers asking to expand existing fleets (offset by incremental churn)
  • Power-only capacity supported through Network offering (contract-rated power-only managed alongside spot and projects)
  • Cowen system integration synergies execution referenced

AI IconFinancial Highlights

  • Enterprise revenues ex-fuel surcharge: $1.2B, down 1% YoY
  • Adjusted income from operations: $35M, down 21% YoY
  • Enterprise adjusted operating ratio: +70 bps YoY
  • Adjusted diluted EPS: $0.12 vs $0.16 in 2025 (weather/fuel volatility and delayed equipment disposal for gains on sale cited)
  • Truckload revenues ex-fuel surcharge: $618M, +1% YoY; revenue per truck per week +7% YoY; operating ratio 96.7%, +80 bps YoY
  • Network revenues: +4% YoY; revenue per truck per week +7% YoY and +2% sequentially (atypical first-quarter strength)
  • Intermodal revenues ex-fuel surcharge: $254M, -3% YoY; revenue per order -4%; operating ratio 95.7% vs 94.7% (+100 bps); Intermodal operating income $11M, -21% YoY
  • Logistics revenues ex-fuel surcharge: $312M, -6% YoY; operating ratio 97.9%, +30 bps due to lower volumes
  • Tax: 2026 EPS guidance assumes effective tax rate ~24%
  • Q1 margin pressure drivers: maintenance and fuel cost headwinds; lower gain on sale due to delayed equipment disposal
  • Net CapEx: $45M vs $97M prior year (timing of equipment purchases); free cash flow increased by $54M YoY

AI IconCapital Funding

  • Debt and lease obligations: $399M (as of March 31)
  • Cash and cash equivalents: $228M (as of March 31); net debt leverage 0.3x
  • Shareholder returns: >$22M returned in Q1 via dividends (recently raised by 5%) and opportunistic repurchases under newly authorized share repurchase program
  • 2026 CapEx guidance unchanged: $400M to $450M (replacement CapEx to protect Asia fleet); implies continued investment while maintaining investment-grade profile

AI IconStrategy & Ops

  • Cost and productivity initiatives: traction on $40M cost savings with additional headcount actions
  • Cowen system integration synergies: disciplined execution referenced
  • Early cycle playbook rollout: shift capacity, enact yield management, and extract operating leverage across segments
  • Yield management and revenue management: spot exposure grew to nearly double historical levels in Network during the downcycle to capture improved spot rates and add contract-rated freight
  • Productivity as core lever: management emphasized revenue-per-truck-per-week rather than truck count for Dedicated/Network
  • Automation/AI: AI implementation to remove friction for drivers; AI triaging driver communications; primarily in-house development with outside capability (notably around voice)

AI IconMarket Outlook

  • 2026 EPS guidance maintained: $0.70 to $1.00
  • Guidance drivers include cost program confidence and supply attrition realization, but macro demand risk increased (higher inflation expectations; diminished likelihood of additional rate cuts)
  • Network 2026 rate renewals expected mid- to high-single digits; transactions with largest rate decreases expected to see double-digit increases
  • Dedicated and Network timing: Dedicated productivity/yield improvement expected to be 'a little bit quicker than' a couple of quarters (opportunity to fill sooner)
  • Intermodal timing: management indicated typical ~two-quarter lag vs Truckload rate movements, likely not as large a magnitude this cycle

AI IconRisks & Headwinds

  • Unusually disruptive weather caused short-term productivity loss and higher maintenance costs
  • Fuel volatility in March with sharp movements; moderated by end of March but still a headwind
  • Macro uncertainty: higher inflation expectations and diminished prospects for additional rate cuts increase demand risk to the right
  • Lower gain on sale due to delayed equipment disposal negatively impacted earnings
  • Guidance upside/downside tied primarily to demand inflection; capacity and self-help actions played out as expected, but more demand persistence needed for higher-end confidence

Q&A: Analyst Interest

  • Topic: Network pricing/renewal magnitude vs first-quarter results—Management's detailed response: Management said renewals are expected mid- to high-single digits for Network across normal allocation events, but momentum is building. Largest price-decrease shippers are facing double-digit increases. Turnbacks and acceptance activity add additional pricing levers; productivity drove most of the +7% revenue per truck-week result, with AI improving driver friction.
  • Topic: Dedicated upside timing and key levers for Dedicated in an upcycle—Management's detailed response: Management emphasized Dedicated is guided by durable differentiation and early-cycle playbook, not just adding trucks. Productivity drives earnings growth; success is measured by revenue per truck per week. They sold 150+ trucks and see customer requests to expand fleets, with disciplined churn management. They expect continued backhaul benefits as conditions improve, filling yield earlier than 'two quarters.'
  • Topic: AI/tech specificity and when it flows to the P&L—Management's detailed response: Management described AI focused on reducing friction for drivers and customers, especially in communities where removing queues and prioritizing information faster improves outcomes. Example given: triaging driver communications (e.g., breakdown vs radio issue) by routing to the right people and tackling the most impactful cases first. They prioritize in-house development with some outside voice capability; results already showing, with continued investment throughout 2026.

Sentiment: MIXED

Note: This summary was synthesized by AI from the SNDR Q1 2026 earnings transcript. Financial data is complex; please verify all metrics against official SEC filings before making investment decisions.

📋 Official Regulatory 10-K / 10-Q SEC Filings

Direct authenticated documentation links to audited SEC database reports for SNDR.

SEC EDGAR Live Feed
Loading financial data and tables...
📁

SEC Filings (SNDR)

© 2026 Stock Market Info — Schneider National, Inc. (SNDR) Financial Profile