Steel Dynamics, Inc.

Steel Dynamics, Inc. (STLD) Market Cap

Steel Dynamics, Inc. has a market capitalization of $36.01B.

Price: $251.26

-1.24 (-0.49%)

Market Cap: 36.01B

NASDAQ · time unavailable

CEO: Mark D. Millett

Sector: Basic Materials

Industry: Steel

IPO Date: 1996-11-22

Website: https://www.steeldynamics.com

Steel Dynamics, Inc. (STLD) - Company Information

Market Cap: 36.01B|Sector: Basic Materials

Company Profile

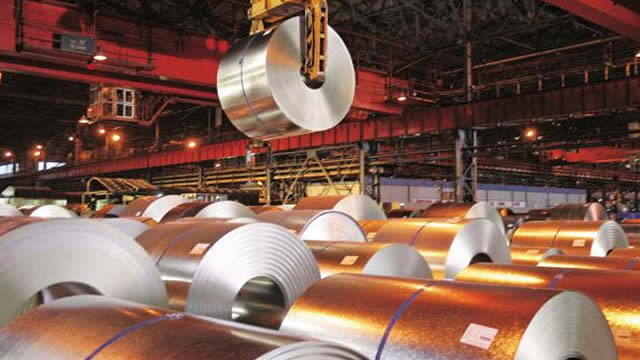
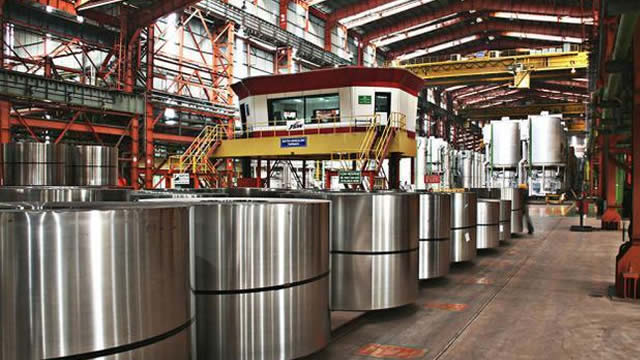
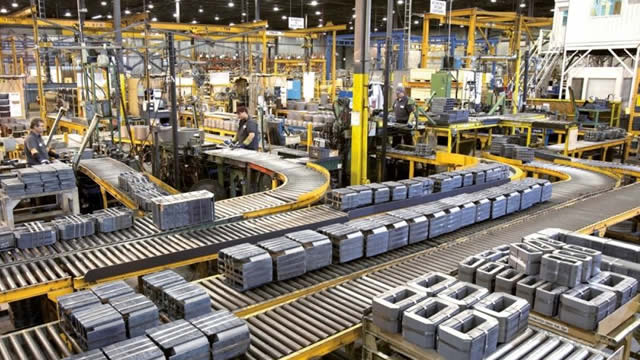
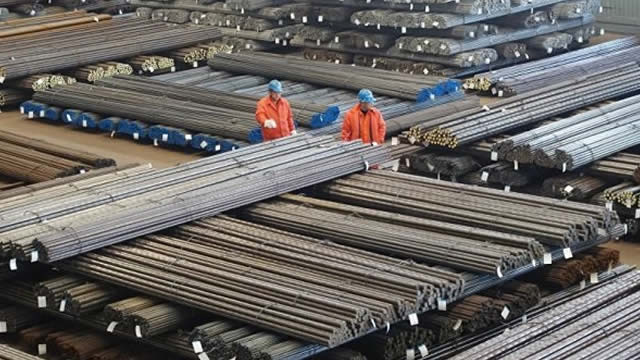
Steel Dynamics, Inc. is a prominent American steel manufacturer and metal recycling enterprise, conducting its operations through three distinct business divisions. The Steel Operations segment is responsible for producing a broad range of steel products, including hot, cold, and coated rolled steel, various structural shapes like beams, channels, and angles, flat and reinforcing bars, and a diverse selection of rail and engineered steel bar products. This segment also provides specialized processing services for both bar products (such as turning, polishing, and heat treating) and specialty items (including cutting, welding, and galvanizing). Its offerings cater to numerous industries, such as construction, automotive, manufacturing, transportation, heavy and agricultural equipment, and pipe and tube production. Sales are channeled directly to end-users, steel fabricators, and service centers. The Metals Recycling Operations division focuses on acquiring, processing, and reselling ferrous (e.g., heavy melting steel, shredded scrap, cast iron) and nonferrous (e.g., aluminum, copper, stainless steel) scrap metals, transforming them into reusable materials. This division further offers supplementary services including transportation logistics, marketing, brokerage, and scrap management. The Steel Fabrication Operations segment manufactures crucial components for commercial building construction, such as steel joists, girders, trusses, and steel deck products. Established in 1993 and headquartered in Fort Wayne, Indiana, the company also engages in exporting its products internationally.

Analyst Sentiment

72%
Strong Buy

From 12 Active Polls

1Y Forecast: $273.80

▲ +9.0% Potential Upside

Consensus Target Metrics

Low Bound

$260

Median

$272

High Bound

$300

Average

$274

Price & Moving Averages

Loading chart...

🎯 Wall Street Analyst Intelligence Report

1-Year structural target targets, chart projections, and sentiment maps.

Average 1Y Target
$273.80
▲ +8.97% Upside
Low Target
$260.00
3% Risk
Median Target
$272.00
8% Mid
High Target
$300.00
19% Max
Consensus
Buy
14 / 27 Buys

Consensus Trend Projection

Trailing closures vs. 12-month metrics map.

Analyst Vote Distribution

Aggregate institutional coverage sentiment weights.

📊 Historical Valuation Multiples

Real-time Trailing Twelve Month (TTM) momentum side-by-side with discrete quarterly metrics.

Fiscal QuarterTTMQ2 2026Q1 2026Q4 2025Q3 2025Q2 2025Q1 2025Q4 2024Q3 2024
Period EndingTrailing 12MJun 30, 2026Mar 31, 2026Dec 31, 2025Sep 30, 2025Jun 30, 2025Mar 31, 2025Dec 31, 2024Sep 30, 2024
Market Cap ($M)36,01333,13326,06324,67620,48919,11518,79517,35019,424
Enterprise Value ($M)39,62736,74829,70828,11823,50122,43821,80419,99122,093
Price to Earnings Ratio (P/E)22.7015.5016.1323.1512.6816.0021.5720.9715.30
Price/Earnings-to-Growth Ratio (PEG)0.910.902.203.571.68
Price to Sales Ratio (P/S)1.755.445.015.594.244.194.304.484.47
Price to Book Ratio (P/B)3.853.522.842.752.282.162.131.942.14
Price to Free Cash Flow Ratio (P/FCF)37.69108.962521.38293.0136.791439.39-122.92-163.21140.25
Enterprise Value to Sales (EV/Sales)6.035.716.374.874.924.995.165.09
Enterprise Value to EBITDA (EV/EBITDA)13.3538.1334.7358.1135.2941.7051.1252.0540.45
Debt to Equity Ratio1.220.440.460.470.420.430.480.360.41

📘 Full Research Report

ℹ️

AI-Generated Research: This report is for informational purposes only.

📘 STEEL DYNAMICS INC (STLD) — Investment Overview

🧩 Business Model Overview

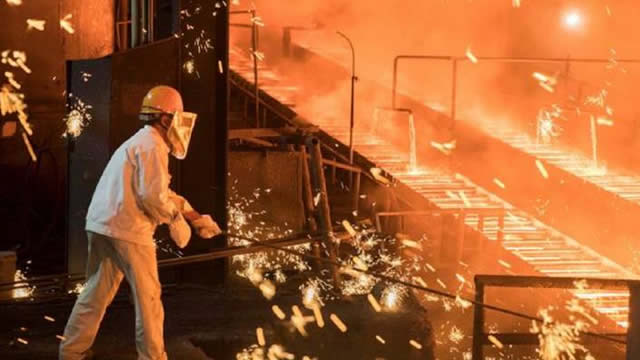
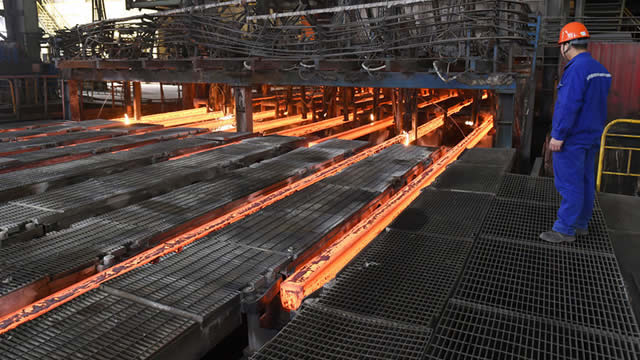
Steel Dynamics operates primarily as a U.S.-based steel producer with a “mini-mill” model centered on electric arc furnaces (EAFs). The value chain starts with metal sourcing—particularly recycled scrap—then moves through melting, refining, casting, and rolling into steel products. The company also produces or supports downstream channels through fabrication and/or distribution-oriented activities, which help convert commodity steel volumes into more serviceable end markets and specifications.

Customer stickiness in steel is not driven by software-like switching costs; instead, durability of relationships and qualification requirements can matter. Once a mill’s product performance, lead times, and spec compliance are established, customers often prefer qualified suppliers—especially for construction, OEM supply chains, and recurring procurement programs.

💰 Revenue Streams & Monetisation Model

Revenue is predominantly transactional and tied to steel product volumes and prevailing market pricing (steel cycles). Monetisation, however, depends on the company’s ability to maintain a favorable cost position and optimize product mix. Margin drivers include:

  • Steel “spread” economics—the difference between selling prices for steel products and the all-in cost to produce them.
  • EAF operating cost curve—energy efficiency, furnace utilization, yield, and labor productivity.
  • Scrap-to-steel conversion economics—scrap sourcing strategy and the degree to which input costs track (or fail to track) output prices.
  • Product mix—higher value-added formats and contract structures can smooth margin outcomes versus pure commodity exposures.

Monetisation is therefore highly cyclical at the headline level, but structurally supported by execution: cost discipline, throughput optimization, and disciplined capital allocation to maintain competitive EAF performance.

🧠 Competitive Advantages & Market Positioning

STLD’s moat is primarily cost advantage and logistical/geographic leverage, rather than proprietary technology or branding. Key competitive strengths include:

  • Cost advantage through mini-mill economics: EAF-based production can be efficient versus traditional integrated routes, particularly when the company maintains strong furnace utilization and lean operating systems.
  • Low-cost feedstock orientation: Recycling-based steelmaking ties outcomes to scrap availability and sourcing capability, enabling a cost curve that can remain competitive across parts of the cycle.
  • Scale and operational learning: Multiple operating sites and repeatable process know-how support stable yields, throughput, and procurement leverage.
  • Proximity to demand and shipping efficiency: A U.S. footprint concentrated near major load centers reduces effective delivered costs and supports service performance (lead times and distribution economics).

Competitive benchmarking:

  • Nucor (NUE) and Steel Dynamics (STLD) both emphasize EAF/mini-mill structures. The competitive battleground is the cost curve (energy, scrap strategy, yield) and product mix, rather than raw iron input advantages.
  • Cleveland-Cliffs (CLF) relies more heavily on integrated and iron-ore-driven processes. CLF’s economics can be influenced by iron ore and blast-furnace cost structures, while STLD is comparatively more exposed to scrap-linked input dynamics and EAF efficiency.
  • ArcelorMittal USA represents a more integrated/global mix versus STLD’s mini-mill focus. Integrated producers typically compete differently on scale, geographic reach, and raw material procurement.

In this peer set, STLD’s differentiation rests on maintaining an EAF cost position and operational consistency, supported by U.S. facility placement and an approach aligned with recycling-derived steelmaking.

🚀 Multi-Year Growth Drivers

Steel demand is cyclical, yet several multi-year drivers can expand structural opportunity and influence mix:

  • U.S. infrastructure and construction spending cycles: Steel intensity in bridges, pipelines, grids, and commercial/residential construction supports sustained baseline demand.
  • Recycling and circularity trends: Steelmaking that leverages recycled materials benefits from policy and market emphasis on lower-carbon pathways (where regulatory and customer requirements favor recycled content).
  • Grid and energy transition capex: Transmission and distribution buildouts use significant volumes of steel-intensive components, which can create resilient pockets of demand.
  • Customer qualification and supply-chain localization: As customers prioritize reliable supply and shorter logistics, producers with strong U.S. footprint and service capability can win or retain program share.
  • Capacity additions and efficiency improvements: Over time, incremental capacity and debottlenecking, paired with continuous cost improvement, can increase the company’s effective competitiveness in the upswings of the cycle.

Over a 5–10 year horizon, the investment case is less about permanent demand growth and more about how consistently STLD can convert volumes into margins through its cost curve and operational execution during both constructive and challenging steel cycle environments.

⚠ Risk Factors to Monitor

  • Commodity and cycle risk: Steel prices and demand typically move with industrial activity, construction cycles, and broader macro conditions.
  • Feedstock volatility (scrap and alloy inputs): Scrap pricing and availability can move independently of steel selling prices, impacting spread economics.
  • Energy and utility costs: EAF operations remain exposed to electricity and natural gas price movements and system reliability.
  • Environmental and permitting constraints: Emissions regulations and compliance costs can affect unit economics and require capex for upgrades and controls.
  • Trade policy and tariffs: Import competition and anti-dumping/countervailing actions can change market dynamics and pricing discipline.
  • Execution and capital intensity: Expansion, maintenance outages, and remediations can disrupt throughput and raise sustaining capex.
  • Customer concentration and specification risk: Shifts in end-market preferences or qualification outcomes can influence product mix and utilization.

📊 Valuation & Market View

Equity valuation for steel producers typically tracks cycle-adjusted earning power, often using metrics such as EV/EBITDA and enterprise value relative to normalized operating income. The key variables that move valuation include:

  • Steel spreads and utilization (operating leverage)
  • All-in production costs—especially EAF energy efficiency and scrap-to-steel economics
  • Capex discipline and balance sheet strength (ability to withstand downturns and fund maintenance)
  • Credibility of throughput and product-mix strategy

Because steel is an industrial commodity, valuation tends to compress and expand with confidence in management’s cost position and resilience through the cycle rather than with permanent growth assumptions.

🔍 Investment Takeaway

Steel Dynamics is best understood as a U.S. cost-competitive mini-mill operator where the primary economic moat is an EAF-linked cost curve supported by low-cost feedstock orientation (recycled scrap) and U.S. logistical/geographic placement. Over a multi-year horizon, the investment thesis depends on sustained execution—yield, utilization, and input cost management—while navigating steel-cycle cyclicality and environmental/regulatory requirements.


⚠ AI-generated — informational only. Validate using filings before investing.

📰 Market News & Coverage

15 Stories Available

Real-time institutional reporting and market updates for STLD.

benzinga.com2026-07-30

Apple, Steel Dynamics, CBRE Group And More: CNBC's ‘Final Trades'

On CNBC's “Halftime Report Final Trades,” Kevin Simpson, Capital Wealth Planning founder and CIO, named Steel Dynamics, Inc. (NASDAQ:STLD) as his final trade.

zacks.com2026-07-29

Here's Why Steel Dynamics (STLD) is a Strong Momentum Stock

Wondering how to pick strong, market-beating stocks for your investment portfolio? Look no further than the Zacks Style Scores.

247wallst.com2026-07-29

Here Are Wednesday’s Top Wall Street Analyst Research Calls: Bloom Energy, Caesars Entertainment, CarMax, Caterpillar, Ford, MPLX LP, Noble, Reddit, Texas Instruments, and More

Wall Street analysts reshuffled their bets on Wednesday with a wave of upgrades, downgrades, and fresh initiations spanning energy, autos, crypto infrastructure, and quantum computing. Find out which names got boosted and which got cut before the market opens.

defenseworld.net2026-07-29

First Trust Advisors LP Increases Stock Holdings in Steel Dynamics, Inc. $STLD

First Trust Advisors LP increased its holdings in shares of Steel Dynamics, Inc. (NASDAQ: STLD) by 18.0% during the undefined quarter, according to its most recent Form 13F filing with the Securities and Exchange Commission. The firm owned 185,155 shares of the basic materials company's stock after buying an additional 28,296 shares during

zacks.com2026-07-23

NUE vs. STLD: Which US Steel Giant Deserves a Spot in Your Portfolio?

NUE and STLD are expanding capacity as steel prices recover, with growth projects and shareholder returns shaping their positions in the current market.

defenseworld.net2026-07-23

Andra AP fonden Buys 39,991 Shares of Steel Dynamics, Inc. $STLD

Andra AP fonden raised its stake in shares of Steel Dynamics, Inc. (NASDAQ: STLD) by 1,714.9% in the first quarter, according to its most recent filing with the Securities and Exchange Commission. The institutional investor owned 42,323 shares of the basic materials company's stock after buying an additional 39,991 shares during the quarter.

zacks.com2026-07-22

TX or STLD: Which Is the Better Value Stock Right Now?

Investors interested in stocks from the Steel - Producers sector have probably already heard of Ternium S.A. (TX) and Steel Dynamics (STLD).

seekingalpha.com2026-07-21

Steel Dynamics, Inc. (STLD) Q2 2026 Earnings Call Transcript

Steel Dynamics, Inc. (STLD) Q2 2026 Earnings Call Transcript

marketbeat.com2026-07-21

Steel Dynamics Q2 Earnings Call Highlights

Steel Dynamics NASDAQ: STLD reported a stronger sequential second quarter for 2026, with record steel shipments, higher realized steel prices and continued progress on its aluminum platform, executives said on the company's earnings call Tuesday.

zacks.com2026-07-21

Steel Dynamics' Q2 Earnings Top Estimates, Revenues Increase Y/Y

STLD beat Q2 estimates as EPS jumped to $3.80, revenue climbed 33% and record steel shipments signaled strong momentum into late 2026.

schaeffersresearch.com2026-07-21

Nasdaq Futures Jump 357 Points as Earnings Season Heats Up

Futures on the Dow Jones Industrial Average (DJI) and Nasdaq-100 Index (NDX) are comfortably higher this morning

prnewswire.com2026-07-21

Reminder: Steel Dynamics Announces Second Quarter 2026 Earnings Conference Call and Webcast

FORT WAYNE, Ind., July 21, 2026 /PRNewswire/ -- Steel Dynamics, Inc. (NASDAQ/GS: STLD), one of the largest domestic steel producers and metals recyclers in North America, today announced it intends to release second quarter 2026 financial results after market close on Monday, July 20, 2026.

seekingalpha.com2026-07-20

Steel Dynamics: Tariff-Driven Boom Gains Momentum In Q2

Steel Dynamics, Inc. has surged 80% over the past year, driven by U.S. steel tariffs and robust pricing momentum. STLD's aluminum plant ramp-up should drive a free cash flow inflection, with profitability expected next year as production scales. Strong cost control and a stellar balance sheet underpin a secure dividend and active share buybacks, with leverage at 1.2x.

zacks.com2026-07-20

Steel Dynamics (STLD) Q2 Earnings: Taking a Look at Key Metrics Versus Estimates

While the top- and bottom-line numbers for Steel Dynamics (STLD) give a sense of how the business performed in the quarter ended June 2026, it could be worth looking at how some of its key metrics compare to Wall Street estimates and year-ago values.

zacks.com2026-07-20

Steel Dynamics (STLD) Q2 Earnings and Revenues Top Estimates

Steel Dynamics (STLD) came out with quarterly earnings of $3.69 per share, beating the Zacks Consensus Estimate of $3.56 per share. This compares to earnings of $2.01 per share a year ago.

📊 AI Financial Analysis

Powered by StockMarketInfo
Earnings Data: Q Ending 2026-06-30

"STLD reported Q2’26 revenue of $6.09B and net income of $534M, with EPS of $3.70. On a YoY basis (vs. Q2’25), revenue rose +33.4% and net income rose +78.7%. QoQ (vs. Q1’26), revenue increased +17.1% and net income increased +32.3%. Profitability improved meaningfully through the quarter-to-quarter progression: gross margin expanded from 14.7% (Q1’26) to 15.7% (Q2’26), and net margin increased to 8.77% from 7.75% in Q1. Operating income and income before tax also rose faster than revenues, indicating improved cost absorption and/or pricing strength. Over the 4-quarter trend, net margin has generally moved up from 6.54% (Q2’25) to 8.77% (Q2’26), with operating income ratio similarly strengthening. Cash flow quality is solid at the quarter level: operating cash flow was $428M and free cash flow was $304M in Q2’26, despite ongoing capex of $124M. Shareholder payouts remain active: dividends paid were $76.6M and buybacks were $200.3M. Balance sheet resilience looks maintained with total assets at $17.11B and equity at ~$9.42B; net debt was ~$3.61B, broadly stable vs prior quarters. Total shareholder returns appear strong given the market momentum: the stock is up +70.9% over 1 year, which should materially boost total return versus dividend yield (~0.28%)."

Revenue Growth

Strong

YoY revenue growth of +33.4% (Q2’26 vs Q2’25) and QoQ growth of +17.1% (Q2’26 vs Q1’26) indicate accelerating demand/pricing. Revenue also trended upward from $4.41B (Q4’25) → $6.09B (Q2’26).

Profitability

Good

Net margin expanded to 8.77% in Q2’26 from 7.75% in Q1’26 and up from 6.54% in Q2’25. Operating income margin improved to 12.57% (Q2’26) from 11.30% (Q1’26), reflecting better cost absorption.

Cash Flow Quality

Positive

Operating cash flow was $428M and free cash flow $304M in Q2’26. Capital expenditures were manageable (-$124M). Dividends (~$76.6M) plus buybacks (~$200.3M) indicate continued shareholder returns supported by cash generation.

Leverage & Balance Sheet

Positive

Total assets increased to $17.11B from $16.72B in Q1’26. Equity remains strong at ~$9.42B. Leverage is steady with net debt ~$3.61B; no sharp deterioration is evident across the 4-quarter window.

Shareholder Returns

Strong

Market performance is exceptional: +70.9% 1-year change materially boosts total return. Cash returns are also active with buybacks ($200M in Q2’26) and a small dividend yield (~0.28%).

Analyst Sentiment & Valuation

Neutral

Consensus target ($273.25) is above the valuation context (price $200.32), implying upside, but near-term valuation can still be demanding given profitability improvement already reflected. No explicit valuation multiple trend vs target was provided beyond current price ratios.

Disclaimer:This analysis is AI-generated for informational purposes only. Accuracy is not guaranteed and this does not constitute financial advice.

Fundamentals Overview

Loading fundamentals overview...

So what: STLD delivered strong Q2 results with record 3.7M steel shipments, $721M steel operating income (+30% sequential), $70/ton value-added spread improvement vs Q4 2025 lows, and $921M adjusted EBITDA. The key offset is execution risk in aluminum ramp-up—operating losses were still $33M, though 48% improved sequentially, alongside a $16M non-cash impairment tied to slab center relocation. Management repeatedly tied near-term performance to timing: steel fabrication pricing is “stable” in realization terms, with increases expected over the next 6–9 months as backlog projects flow through. Aluminum is the growth engine: shipments surged to 53kt in Q2; hot side is rated, cold mills are ramping toward 650kt annual capability, and at least one automotive CASH line is qualified/operational with the second commissioning planned for Q4. Working capital rose with pricing and customer account values but is expected to be neutral-to-funding in 2H 2026.

AI IconGrowth Catalysts

  • Aluminum flat-rolled sheet shipments rose to 53,000 metric tons in Q2 2026 (from 22,500 in Q1), with volume/profitability expected to increase sharply in 2H 2026 and into 2027 as the third cold mill comes online in Q3 2026
  • Full qualification momentum: finished-product qualification achieved at multiple automotive manufacturers for 5182 and 5754 products; trials in progress for 6000-series alloys
  • Cold-mill ramp: two of three cold mills increasing production; third cold mill started in July 2026 to support full 650,000 metric ton annual capability
  • Steel fabrication: steel joist and deck demand and order activity strong; order backlog up 45% vs. same time last year; improving price discussions

Business Development

  • Automotive customer qualification progress for 5182 and 5754 alloys (multiple automotive manufacturers) and ongoing 6000-series trials (specific customer names not provided)
  • Partnership/coordination with USTR on USMCA review to preserve protections (including melted and poured provisions)
  • Engagement with Congress to strengthen Buy American steel requirements in SHIPS for America Act and Federal Highway bill

AI IconFinancial Highlights

  • Reported net income of $534 million (EPS $3.69 per diluted share) and adjusted EBITDA of $921 million
  • Revenues were $6.1 billion; operating income was $700 million, higher sequentially, driven by higher realized steel pricing and record steel shipments
  • Record quarterly steel shipments of 3.7 million tons; steel operations operating income $721 million, up 30% sequentially
  • Value-added spreads to hot band improved by $70 per ton from Q4 2025 lows
  • Metals recycling operating income $48 million; in-line with sequential despite lower ferrous metal spread offset by increased shipments
  • Steel fabrication operating income $85 million vs $90 million in Q1; higher volume/steady pricing offset by higher steel input costs
  • Aluminum start-up losses: $33 million operating loss, a 48% improvement vs sequential; additional non-cash impairment charge of $16 million tied to relocation of the second planned recycled slab center

AI IconCapital Funding

  • Liquidity at quarter-end: $2.0 billion (cash and investments $0.8 billion; fully available revolver $1.2 billion)
  • Capital investments: $124 million in Q2; $262 million year-to-date; 2H 2026 capex expected at $300 million to $350 million
  • Share repurchase: $350 million completed in 1H 2026; $489 million remaining authorized for repurchases as of June; dividend increased in 1H 2026
  • Cash flow from operations: $428 million; cash reduced by $225 million due to working capital growth tied primarily to increased customer account values as pricing improved and aluminum flat-rolled sheet sales climbed

AI IconStrategy & Ops

  • Flat-rolled steel pricing impact is contract-lagged: ~80%+ linked to lagging price contracts, generally lagging about two months
  • Aluminum ramp/commissioning: hot side fully operational at rated capacity; cold-mill utilization building toward 650,000 metric ton annual capability; third cold mill started in July
  • CASH line product qualification: first of two automotive continuous annealing and solution heat treating lines operational; early certification speed cited as earlier-than-anticipated
  • Metals recycling operations integrating separation technologies with enhanced processes/technology to increase recycled content and mitigate potential prime ferrous scrap constraints over time

AI IconMarket Outlook

  • Fabrication realized pricing: management expects increases reflected over the next 6 to 9 months; pricing in backlog at improved levels but not fully realized until later project timing (Q4 into 2027)
  • Aluminum ramp: volumes/profitability expected to increase sharply in 2H 2026 and into 2027 as startup costs subside, utilization/yields improve, and scrap content increases; second CASH line expected to start commissioning in Q4 2026
  • Aluminum production outlook: Q2 aluminum flat-rolled mill produced 84,000 metric tons (~50% of capability); expected to exit 2026 at at least a 90% monthly production rate, enabling full volume capability in 2027
  • Capital investment guide reiterated: 2H 2026 capex range $300 million–$350 million

AI IconRisks & Headwinds

  • Aluminum ramp-up is not yet optimal: management indicated commissioning constraints and variability; scrap mixes are expected to improve but may not match target at startup
  • Impairment and relocation effects: $16 million non-cash impairment related to relocation of second planned recycled slab center; incremental logistics costs and modest CapEx uplift expected
  • Working capital risk: working capital increased more than anticipated in Q2 due to company-wide pricing-driven customer account growth; could be a funding/neutrality factor but requires monitoring in 2H 2026
  • Steel fabrication pricing realization timing mismatch: backlog pricing improvement does not necessarily translate into immediate realized pricing in 2H 2026

Q&A: Analyst Interest

  • Fabrication pricing/margins path: Management said backlog pricing is at improved levels, but realization in 2H 2026 depends on project timing (some in Q4 and placed into 2027). They guided for realized pricing increases over the next six to nine months, with volumes helping offset input-cost pressure.
  • Aluminum scrap mix and profitability trade-offs: Management acknowledged ramp-up prevents being optimal “in all honesty.” They stated can sheet uses roughly 80% scrap (give or take). For automotive, they indicated an approximate 40/60 P1020 scrap/prime-metal split “at this moment,” expecting improvement as ramp proceeds.
  • Aluminum impairment effects and working capital: Management described operational incremental impacts from the $16 million impairment as logistics-related (UBCs sourcing from West Coast at 60–70% vs 100%), OpEx unchanged, and CapEx rising $10–$20 million mainly from construction inflation. Working capital was higher from pricing, and they expected it to be funding/neutral in 2H 2026.

Sentiment: MIXED

Note: This summary was synthesized by AI from the STLD Q2 2026 earnings transcript. Financial data is complex; please verify all metrics against official SEC filings before making investment decisions.

📋 Official Regulatory 10-K / 10-Q SEC Filings

Direct authenticated documentation links to audited SEC database reports for STLD.

SEC EDGAR Live Feed
Loading financial data and tables...
📁

SEC Filings (STLD)

© 2026 Stock Market Info — Steel Dynamics, Inc. (STLD) Financial Profile