Trex Company, Inc.

Trex Company, Inc. (TREX) Market Cap

Trex Company, Inc. has a market capitalization of $4.12B.

Price: $39.65

-0.48 (-1.20%)

Market Cap: 4.12B

NYSE · time unavailable

CEO: Bryan Horix Fairbanks

Sector: Industrials

Industry: Construction

IPO Date: 1999-04-08

Website: https://www.trex.com

Trex Company, Inc. (TREX) - Company Information

Market Cap: 4.12B|Sector: Industrials

Company Profile

Trex Company, Inc. manufactures and distributes decking, railing, and outdoor living products and accessories for residential and commercial markets in the United States. The company operates in two segments, Trex Residential and Trex Commercial. It offers decking products under the names Trex Transcend, Trex Select, and Trex Enhance for protection against fading, staining, mold, and scratching; Trex Hideaway, a hidden fastening system; and Trex DeckLighting, a LED dimmable deck lighting for use on posts, floors, and steps. The company also provides Trex Transcend Railing products that are used in Trex decking products and other decking materials; Trex Select Railing products for a simple clean finished look; Trex Enhance Railing system; and Trex Signature aluminum railing for a contemporary look. In addition, it offers Trex Seclusions, a fencing product that includes structural posts, bottom and top rails, pickets, and decorative post caps. In addition, it designs, engineers, and markets architectural and aluminum railing systems, and staging equipment and accessories for the commercial market, as well as sports stadiums and performing arts venues. Further, the company acts as a licensor in various licensing agreements with third parties to manufacture and sell products under the Trex name, including Trex Outdoor Furniture; Trex RainEscape, an above joist deck drainage system; Trex Pergola, a cellular PVC product; Trex Latticeworks outdoor lattice boards; Trex Cornhole boards; Diablo Trex Blade, a saw blade for wood-alternative composite decking; Trex SpiralStairs and structural steel posts; and Trex Outdoor Kitchens, Cabinetry, and Storage products. It sells its products through wholesale distributors, retail lumber dealers, and Home Depot and Lowe's stores, as well as through its direct sales staff, independent sales representatives, and bidding on projects. Trex Company, Inc. was founded in 1996 and is headquartered in Winchester, Virginia.

Analyst Sentiment

62%
Buy

From 20 Active Polls

1Y Forecast: $48.33

▲ +21.9% Potential Upside

Consensus Target Metrics

Low Bound

$36

Median

$48

High Bound

$59

Average

$48

Price & Moving Averages

Loading chart...

🎯 Wall Street Analyst Intelligence Report

1-Year structural target targets, chart projections, and sentiment maps.

Average 1Y Target
$48.33
▲ +21.89% Upside
Low Target
$36.00
-9% Risk
Median Target
$48.00
21% Mid
High Target
$59.00
49% Max
Consensus
Hold
9 / 31 Buys

Consensus Trend Projection

Trailing closures vs. 12-month metrics map.

Analyst Vote Distribution

Aggregate institutional coverage sentiment weights.

📊 Historical Valuation Multiples

Real-time Trailing Twelve Month (TTM) momentum side-by-side with discrete quarterly metrics.

Fiscal QuarterTTMQ1 2026Q4 2025Q3 2025Q2 2025Q1 2025Q4 2024Q3 2024Q2 2024
Period EndingTrailing 12MMar 31, 2026Dec 31, 2025Sep 30, 2025Jun 30, 2025Mar 31, 2025Dec 31, 2024Sep 30, 2024Jun 30, 2024
Market Cap ($M)4,1203,8263,7325,5415,8316,2277,3997,2087,897
Enterprise Value ($M)4,5504,2573,9585,6886,1206,7177,6537,3017,997
Price to Earnings Ratio (P/E)21.7715.58405.3426.7619.2025.76189.2944.4322.69
Price/Earnings-to-Growth Ratio (PEG)0.141.370.2529.91
Price to Sales Ratio (P/S)3.5011.1423.1619.4215.0418.3244.1430.8420.98
Price to Book Ratio (P/B)4.183.843.615.325.896.848.708.128.82
Price to Free Cash Flow Ratio (P/FCF)17.21-27.03-25.6016.8929.35-26.60-79.02132.3049.91
Enterprise Value to Sales (EV/Sales)12.4024.5619.9315.7819.7645.6531.2421.24
Enterprise Value to EBITDA (EV/EBITDA)13.9241.79194.0965.8351.7770.03264.75107.5161.34
Debt to Equity Ratio1.320.440.220.150.300.540.300.120.11

TREX Growth Runway Model

Standard long term linear growth fade

Multi-Stage Discounted Cash Flow Sandbox

Market Price$39.65
Intrinsic Value$8.81
Market Alignment
Overvalued by 77.8%relative to calculated intrinsic value
9.00%
Exp: 1%1%
i

Growth runway slowdown

This value provides a time window for the growth rate to decline beyond Stage 1 toward the terminal rate. Longer windows are most useful for companies with high growth starting conditions or strong competitive advantages. This option stretches out the growth rate slowdown across 5, 10, or 15-year steps. A high-growth starting condition (exceeding a 25% initial growth rate) automatically applies a curve decay to simulate realistic, rapid market saturation.
i

Terminal growth rate

With long-term inflation between 3-5%, revenue must grow by that baseline to maintain flat real-world market share. This value sets the permanent terminal growth rate to factor into the valuation beyond the growth slowdown runway toward maturity.

3-Stage Financial Runway Horizon

🧠 Perpetuity Horizon Engine (Stage 3: Post-2035)

Terminal FCF Base$0.08B
Perpetuity TV Value$1.46B
Discounted TV (PV)$0.62B
TV Weighting %58.6%
⚠️
Financial Model Disclaimer & Risk Disclosure: This interactive scenario simulator is an educational sandbox provided strictly for informational and analytical research purposes. Core historical financial statements and consensus estimates are sourced directly via Financial Modeling Prep (FMP). All downstream outputs are entirely deterministic, hypothetical projections generated by combining automated mathematical formulas (including linear interpolation and Gaussian bell-curve decay models) with user-selected variables and third-party financial data inputs. Users assume all liability for trading decisions executed based on these sandbox calculations.

📘 Full Research Report

ℹ️

AI-Generated Research: This report is for informational purposes only.

📘 TREX INC (TREX) — Investment Overview

🧩 Business Model Overview

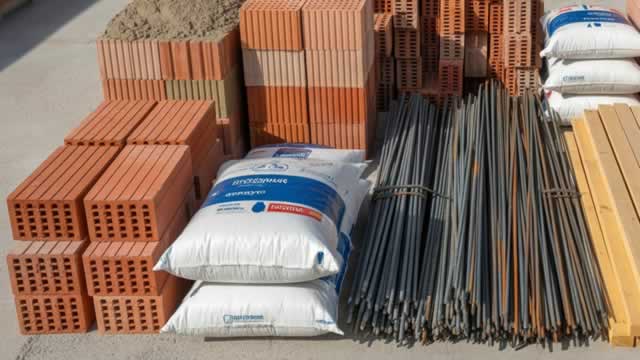
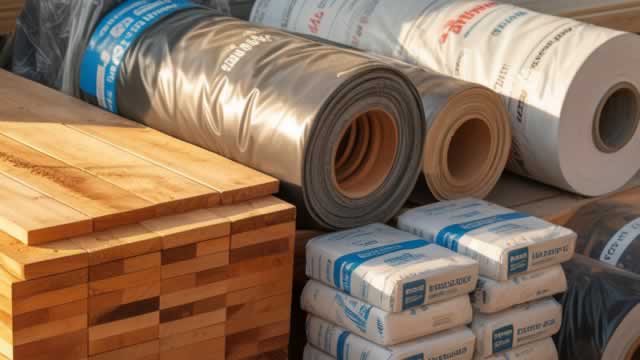
TREX designs, manufactures, and sells composite decking and related outdoor living products (such as railing and accessories). The value chain centers on converting commodity inputs—primarily recycled plastics and wood flour—into durable composite boards and then distributing those products through established dealer/distributor and contractor channels. The customer experience is shaped by product performance (weather/rot resistance, low maintenance) and the installation ecosystem (trained/experienced contractors, retailer assortment depth, and warranty terms).

💰 Revenue Streams & Monetisation Model

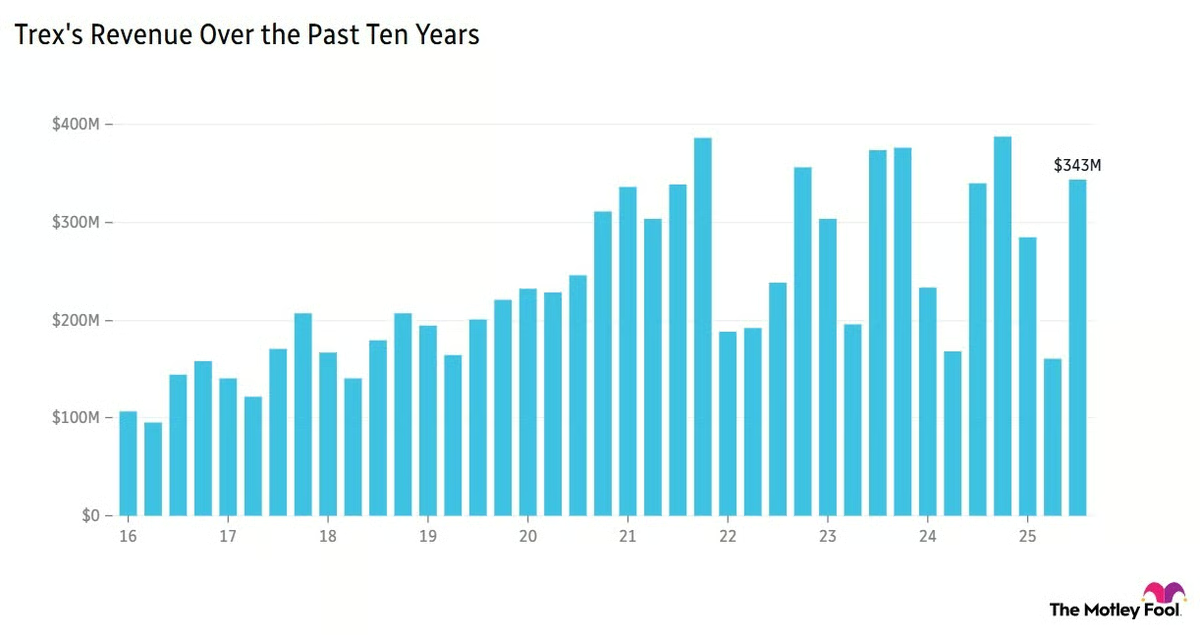
Revenue is predominantly transactional, tied to shipments of decking and railing units into residential construction and renovation. Monetisation is driven by:

  • Product mix: decking typically anchors revenue scale; railing and complementary accessories add attach opportunities and can improve blended margins.
  • Pricing discipline vs. input costs: gross margin sensitivity arises from commodity-like input costs (recycled plastic resin/film and wood fiber) and manufacturing efficiency (throughput, yield, and energy costs).
  • Operating leverage: fixed-cost absorption across manufacturing capacity affects profitability when volumes rise/fall with housing and remodeling cycles.

While sales are not contractually recurring, the installed base and warranty framework create a form of demand stickiness through repeat purchases of matching railing/accessories and contractor/retailer preference for proven brands.

🧠 Competitive Advantages & Market Positioning

Primary moat: Cost & scale advantages in composite manufacturing, reinforced by installer/distributor switching costs.

  • Cost/scale advantage: Building composite decking requires specialized extrusion/extrusion-line capability, formulation know-how, and process discipline to manage yield and product consistency. Scale manufacturing supports better unit economics and faster throughput, which can help defend pricing through input cycles.
  • Switching costs (practical, not contractual): Contractors and distributors often standardize on specific product lines due to installation familiarity, performance history, and warranty handling. Switching can introduce technical/quality risk and disrupt product assortment planning.
  • Product credibility and warranty execution: Outdoor exposure is a high-friction performance environment. Demonstrated durability and warranty administration matter; competitors must match quality and defect-rate performance to credibly displace incumbents.

Competitive benchmarking:

  • AZEK Building Products (including TimberTech lines): Competes across composite decking and PVC-based decking solutions with similar downstream channels. AZEK’s breadth includes multiple product chemistries, while TREX’s competitive stance emphasizes composite formulations and manufacturing scale.
  • Fiberon (a composite decking competitor): Competes through similar distribution and contractor networks. Fiberon’s differentiating factors include product variety and regional penetration; TREX competes with a comparable assortment but relies more heavily on manufacturing economics and consistency at scale.
  • Low-end alternatives (wood/plastic composites from smaller regional producers): These often compete on price at the material level. TREX’s moat is defense through performance-based value (maintenance avoidance and durability) and execution reliability.

Overall, TREX’s positioning is aligned to mainstream residential outdoor living demand where performance, consistency, and distributor/contractor repeatability determine share more than isolated product features.

🚀 Multi-Year Growth Drivers

  • Remodeling and replacement cycle: Composite decking benefits when homeowners prioritize low maintenance and longer service life versus traditional wood. This shifts demand toward “refresh/replacement” rather than purely new-build decking.
  • Longer serviceability with outdoor living expansion: Yard/terrace living has structural demand support as homeowners add or upgrade outdoor spaces, increasing addressable SKUs (boards plus railing/accessories).
  • Builder and contractor channel penetration: Growth comes from deepening distributor assortment and contractor spec inclusion, which increases the probability that future projects select TREX-compatible systems.
  • Product and system attach: Railing and accessories can expand revenue per project as homeowners seek a coordinated look and compatible components.
  • Market share resilience through value proposition: As input costs fluctuate, durable composites can maintain relative attractiveness versus alternative materials when the total lifecycle cost is considered.

⚠ Risk Factors to Monitor

  • Input-cost volatility and formulation margins: Changes in the cost and availability of recycled plastics and wood fiber can pressure gross margin if pricing cannot keep pace or if input mixes require margin-neutral formulation adjustments.
  • Housing and remodeling cyclicality: Decking demand is sensitive to residential construction sentiment and discretionary renovation activity.
  • Capacity utilization and fixed-cost leverage: Manufacturing fixed costs can magnify earnings swings when volumes soften; competitors may also add capacity that intensifies price competition.
  • Quality and warranty exposure: Outdoor materials face harsh conditions; product defects, discoloration, fastening/installation issues, or warranty claims can drive incremental costs and reputational risk.
  • Competitive price pressure: Multiple large composite and PVC players compete in overlapping channels. Sustained promotional pricing can reduce profitability even if unit volumes hold.
  • Regulatory/environmental requirements for materials: Standards around recycled content, emissions, and disposal can alter input sourcing or manufacturing processes.

📊 Valuation & Market View

Equity markets typically value durable building-products manufacturers on EV/EBITDA and/or P/S rather than earnings-only metrics during periods of cycle uncertainty. For TREX specifically, valuation sensitivity often clusters around:

  • Gross margin durability: Ability to sustain blended margins through input cycles and pricing discipline.
  • Operating leverage: How efficiently incremental volume converts into operating income given manufacturing fixed costs.
  • Demand mix: Relative contribution from deck boards versus railing/accessories and the share of replacement/remodeling-led projects.
  • Quality cost trajectory: Warranty/claim rates and normalized cost-to-serve through distribution channels.

The market typically re-rates the group when management demonstrates resilience in margins and disciplined capacity management through demand fluctuations.

🔍 Investment Takeaway

TREX’s long-term investment case is anchored by a structural manufacturing and distribution advantage in composite decking: scale-driven cost efficiency, process know-how to produce consistent outdoor-performance products, and practical switching frictions for contractors and distributors who standardize on proven systems. Over a multi-year horizon, demand support from remodeling/replacement and increased outdoor living penetration provides a durable runway, while the key swing factors remain margins (input cost management and pricing discipline) and warranty/quality execution in a competitive, cyclical residential backdrop.


⚠ AI-generated — informational only. Validate using filings before investing.

📰 Market News & Coverage

15 Stories Available

Real-time institutional reporting and market updates for TREX.

seekingalpha.com2026-06-03

Trex Company, Inc. (TREX) Presents at 46th Annual William Blair Growth Stock Conference Transcript

Trex Company, Inc. (TREX) Presents at 46th Annual William Blair Growth Stock Conference Transcript

seekingalpha.com2026-05-20

Trex Company: Its Fundamentals Are Fortified, But Valuation Shows Wobbly Upside

Trex Company remains fundamentally solid but faces macroeconomic headwinds and a soft housing market, justifying a continued hold rating. Q1 2026 sales showed a modest 1% recovery to $343.4M, with resilient demand and improved operating margin to 24.3% despite inflationary pressures. TREX's high-margin, low-cost business model leverages recycled materials, supporting pricing power and defensive demand even as inflation and housing softness persist.

gurufocus.com2026-05-19

A Look at Trex Co Inc (TREX) After 5.1% Decline -- GF Value $68.58 vs Price $36.24

On May 19, 2026, Trex Co Inc (TREX) shares fell 5.1% today, trading at $36.24. The stock has experienced significant volatility, with a 52-week range of $29.77

globenewswire.com2026-05-19

The Splintering Truth: 78% of Wood Deck Owners Regret Their Choice

New national survey reveals how maintenance headaches and durability concerns are driving a shift toward low-maintenance alternatives New national survey reveals how maintenance headaches and durability concerns are driving a shift toward low-maintenance alternatives

fool.com2026-05-18

Investment Advisor Closes Out Position in TREX Stock, According to Latest SEC Filing

Trex Company manufactures composite decking and outdoor living products for residential and commercial markets across the U.S.

fool.com2026-05-12

Investment Firm Sells $12.2 Million Worth of Materials Stock, According to Latest SEC Filing

Trex Company is a leading provider of composite decking and outdoor living products for residential and commercial markets.

seekingalpha.com2026-05-07

Trex Company, Inc. (TREX) Q1 2026 Earnings Call Transcript

Trex Company, Inc. (TREX) Q1 2026 Earnings Call Transcript

zacks.com2026-05-07

Trex (TREX) Tops Q1 Earnings and Revenue Estimates

Trex (TREX) came out with quarterly earnings of $0.59 per share, beating the Zacks Consensus Estimate of $0.51 per share. This compares to earnings of $0.6 per share a year ago.

businesswire.com2026-05-07

Trex Company Reports Solid First Quarter 2026 Results

WINCHESTER, Va.--(BUSINESS WIRE)--Trex Company, Inc. [NYSE:TREX], the world's largest manufacturer of wood-alternative composite decking and railing, and a leader in high-performance, low-maintenance outdoor living products, today announced financial results for the first quarter of 2026. Commenting on the quarter, Adam Zambanini, President and CEO, said, “We entered 2026 with strong momentum and a renewed sense of energy and excitement driving the entire organization forward. During the quarte.

businesswire.com2026-05-04

Trex Company Appoints Zachary C. Lauer as Chief Operations Officer

WINCHESTER, Va.--(BUSINESS WIRE)--Trex Company, Inc. [NYSE:TREX], the world's largest manufacturer of wood-alternative composite decking and railing, and a leader in high-performance, low-maintenance outdoor living products, today announced the appointment of Zachary C. Lauer as Senior Vice President, Chief Operations Officer. Lauer brings more than two decades of experience in operations, supply chain, and manufacturing leadership, including ten years with Trex. Most recently, he served as Sen.

zacks.com2026-04-30

Analysts Estimate Trex (TREX) to Report a Decline in Earnings: What to Look Out for

Trex (TREX) doesn't possess the right combination of the two key ingredients for a likely earnings beat in its upcoming report. Get prepared with the key expectations.

defenseworld.net2026-04-24

Trex Company, Inc. $TREX Shares Bought by Cwm LLC

Cwm LLC raised its stake in Trex Company, Inc. (NYSE: TREX) by 182.0% in the undefined quarter, according to the company in its most recent filing with the Securities and Exchange Commission. The institutional investor owned 85,995 shares of the construction company's stock after buying an additional 55,495 shares during the quarter. Cwm

businesswire.com2026-04-23

Trex Named Among “America's Climate Leaders” by USA Today

WINCHESTER, Va.--(BUSINESS WIRE)--Trex Company [NYSE:TREX], the world's #1 brand of premium, sustainable, wood-alternative decking and railing and a leader in high-performance, low-maintenance outdoor living products, has been recognized as one of “America's Climate Leaders 2026.” In a list published yesterday by USA Today, Trex was named among 500 U.S. companies that are making measurable progress in reducing their carbon footprint and taking meaningful climate action. To compile this year's r.

globenewswire.com2026-04-21

Turning Waste Into What's Next

Trex Company Highlights 30 Years of Innovation and Impact – Recycling Billions of Pounds of Plastic and Wood Waste into High-Performance Outdoor Living Products Trex Company Highlights 30 Years of Innovation and Impact – Recycling Billions of Pounds of Plastic and Wood Waste into High-Performance Outdoor Living Products

gurufocus.com2026-04-13

Trex Co Inc (TREX) Stock Up 3.7% and Still Undervalued -- GF Score: 84/100

On April 13, 2026, Trex Co Inc (TREX) shares rose 3.7% to a current price of $40.50. The stock has shown a significant rebound over the last week, gaining 12.4%

📊 AI Financial Analysis

Powered by StockMarketInfo
Earnings Data: Q Ending 2026-03-31

"TREX reported Q1 2026 Revenue of $343.4M and Net Income of $61.4M (EPS $0.58). Revenue rose +0.99% YoY versus Q1 2025 ($340.0M) and surged +113.1% QoQ versus Q4 2025 ($161.1M), reflecting strong seasonality. Net Income increased +1.55% YoY versus Q1 2025 ($60.4M) and accelerated +2,567% QoQ versus Q4 2025 ($2.3M), with profitability returning after an unusually weak Q4. Margins improved over the last year: gross margin was ~40.48% in Q1 2026 vs ~40.51% in Q1 2025 (roughly flat) but meaningfully higher than Q4 2025 (30.20%). Net margin expanded to 17.88% from 17.78% YoY and remained far above Q4’s 1.43%, while operating margin rebounded to 24.32% from 2.17% QoQ. Cash flow quality was the key pressure point: Q1 2026 operating cash flow was -$118.4M and free cash flow was -$118.4M, driven by large changes in receivables (accounts receivable -$278.8M). Balance sheet leverage remains moderate but debt is elevated: short-term debt $382.5M and long-term debt $40.1M, while equity is ~$996M. Shareholder returns are mixed: price is $42.77 with 1-year change of -19.94% (capital depreciation). No dividends were paid; buybacks totaled -$82.8M in the quarter, partially supporting total return. Overall, Q1 performance shows solid profitability with strong seasonal revenue/earnings rebound, but near-term cash generation weakened due to working-capital swings."

Revenue Growth

Positive

Revenue was $343.4M in Q1 2026, +0.99% YoY and +113.1% QoQ (vs $161.1M in Q4 2025), indicating a strong seasonal rebound with modest underlying growth.

Profitability

Good

Net margin improved vs Q4 (17.88% vs 1.43%) and was slightly higher YoY (17.88% vs 17.78%). Operating margin rebounded to 24.32% from 2.17% QoQ; gross margin remained ~40.5%.

Cash Flow Quality

Neutral

Despite $61.4M net income, operating cash flow was -$118.4M and free cash flow -$118.4M, largely from working-capital/receivables outflows (accounts receivable -$278.8M).

Leverage & Balance Sheet

Neutral

Total assets increased to $1.73B, equity is about $996M, but leverage is notable with total debt ~$423M and very low cash ($4.5M). Liquidity is constrained (current ratio ~1.02).

Shareholder Returns

Fair

1-year price performance is -19.94% (capital loss). No dividends. Buybacks reduced equity share count effects in the quarter (-$82.8M repurchases), but total shareholder return likely remains pressured.

Analyst Sentiment & Valuation

Neutral

Street target consensus is $46.67 vs $42.77 current (~+9% upside). Valuation metrics shown are elevated on earnings/FCF (distorted by quarter cash generation), so sentiment appears moderately constructive.

Disclaimer:This analysis is AI-generated for informational purposes only. Accuracy is not guaranteed and this does not constitute financial advice.

Fundamentals Overview

Loading fundamentals overview...

Trex started 2026 with modest revenue growth (+1% to $343M) but strong profitability: gross margin hit 40.5%, ~100 bps above expectations, largely from decking mix and reduced railing mix after an aluminum price increase pulled demand forward. SG&A also beat plans, supported by favorable medical claims timing and expense phasing tied to branding and Arkansas build-out. However, cash generation was pressured: free cash flow was -$143M as inventory and receivables built ahead of peak, partially offset by ~40% improvement versus the prior year. Guidance is maintained, with Q2 net sales $388M–$403M and expectations for gross margin reversal as mix normalizes and SG&A steps up—driving lower EBITDA margin sequentially. Management emphasized a structural push to accelerate the growth engine: narrowing innovation initiatives, creating channel-aware pricing, and staffing commercial leadership. Market demand is expected flat-to-down with back half improving, while inventory discipline and recycled-content insulation help limit margin volatility. Share repurchases escalated via a $100M ASR and additional authorization.

AI IconGrowth Catalysts

  • Next-phase multichannel consumer/pro campaign on the “performance engineered for your life outdoors” platform to drive wood-to-composite conversion
  • Higher-end pro-contractor-driven product strength within Q1, supporting premium decking and improved mix
  • Refuge PVC product introduced; management expects most sales in Q2 to Q4
  • Mid-quarter aluminum railing price increase (announced during the year; not in prior forecast) to support margin and growth
  • Organic category innovation pipeline: regional launch targeted for 2027, followed by national launch 2028–2030

Business Development

  • Two-step distributor shelf-space/territory expansion with two key distributors (no names disclosed)
  • Home center line reviews where Trex was characterized as one of two “retail winners” gaining both decking and railing slots (no names disclosed)
  • TrexPro network lead-generation improvements (program names not disclosed)

AI IconFinancial Highlights

  • Net sales $343 million (+1% y/y); first-quarter volume reduced by channel inventory drawdown to support later peak season buying
  • Gross profit $139 million; gross margin 40.5%, ~100 bps better than expected (driven by decking mix and lower railing mix from an aluminum railing price increase with Q4 pull-forward)
  • SG&A $56 million (16.2% of net sales); below expectations; adjusted SG&A $54 million excluding $1m digital transformation costs and $200k Arkansas startup expenses
  • Adjusted EBITDA $103 million (+2% y/y); growth attributed to pricing and mix, cost control, and expense timing
  • Free cash flow negative $143 million, ~40% better than prior year, reflecting inventory and accounts receivable build ahead of peak
  • No noticeable cost pressures from oil price increase related to Middle East conflict due to domestically sourced recycled LDPE and ~95% recycled content
  • Full-year guidance reiterated: net sales $1.185B–$1.230B; adjusted gross margin ~37.5%; adjusted EBITDA $340M–$350M
  • Q2 outlook: net sales $388M–$403M; expect reversal of Q1 gross margin benefit from mix

AI IconCapital Funding

  • Accelerated share repurchase (ASR) of $100 million completed during Q1 as part of a larger $150 million share repurchase announcement
  • Board authorized +10 million shares increase to existing share repurchase program; completion of full $150 million repurchase expected in Q2
  • Net debt leverage 1x EBITDA at the low end of target range (1x–2x)
  • CapEx outlook: $100M–$120M total in 2026 (down from $224M in 2025); maintenance CapEx expected ~5%–6% of revenue in 2027

AI IconStrategy & Ops

  • Level-load production strategy implemented in 2025; management reduced channel inventories early 2026 and relied on company inventory later in the year
  • Digital transformation to improve proactive lead generation and connect consumer inspiration to contractor execution through TrexPro
  • Creation of a new internal pricing group to implement channel-aware, portfolio-level pricing strategy balancing share and margin
  • Organizational changes: newly created Chief Commercial Officer to integrate sales/marketing/IT; alignment of innovation and advanced manufacturing under newly appointed COO Zach Lauer
  • Executive focus on narrowing innovation initiatives: “100 initiatives” boiled down to “20” under five imperatives; $100M-program scale expectation for what gets executed

AI IconMarket Outlook

  • Repair & remodel market guidance: flat to down in 2026; management expects back half better than first half
  • Full-year company growth assumption: about 3% y/y currently (Jefferies/UBS dialogue); noted home-center forecasts range negative 1% to +1%, with Trex targeting low- to mid-single-digit growth
  • Second-half growth implied ~4% (management said “around 5%… our number is about 4%”)
  • Rolling 12-month sell-in and sell-out introduced: trailing-12-month sell-in +7% and sell-out +6% for Q1

AI IconRisks & Headwinds

  • Adverse weather early in Q1 and uncertain economic environment causing consumers to defer discretionary repair and remodeling
  • Channel inventory dynamics: Q1 began with lower channel inventory (around 30–40 days) and relies on in-season sell-in execution for Q2
  • Middle East conflict: while management saw no noticeable COGS pressure from oil-related impacts, it was cited as a factor increasing conservatism and potentially impacting demand cadence
  • Raw material input cost volatility risk (diesel fuel and aluminum acknowledged), though mitigated by recycled LDPE lag and operational/cost-out and pricing levers

Q&A: Analyst Interest

  • Innovation/operating-model change: Adam described restructuring efforts to execute faster amid consolidation and inflation, boiling ~100 initiatives into 20 initiatives under five imperatives, and emphasizing that improved structure enables “category-of-one” separator-technology innovation and clearer prioritization for the growth engine.
  • Sell-out and channel execution cadence: management explained sell-in was managed via level-loading, with inventory held lower at ~30–40 days into the busy season, January–February challenging but March rebounded into April; they expect sell-in impetus in Q2–Q3 when demand pulls through quickly.
  • Gross margin/SG&A and EBITDA margin cadence: Prithvi attributed Q1 gross margin outperformance to ~100 bps decking mix benefit and lower railing mix from an aluminum railing price increase with Q4 pull-forward; he guided that Q2 will reverse more than half of the favorability and include SG&A dollar step-up, implying lower EBITDA margin Q1→Q2.

Sentiment: MIXED

Note: This summary was synthesized by AI from the TREX Q1 2026 earnings transcript. Financial data is complex; please verify all metrics against official SEC filings before making investment decisions.

📋 Official Regulatory 10-K / 10-Q SEC Filings

Direct authenticated documentation links to audited SEC database reports for TREX.

SEC EDGAR Live Feed
Loading financial data and tables...
📁

SEC Filings (TREX)

© 2026 Stock Market Info — Trex Company, Inc. (TREX) Financial Profile