Titan International, Inc.

Titan International, Inc. (TWI) Market Cap

Titan International, Inc. has a market capitalization of $469.3M.

Price: $7.29

-0.51 (-6.54%)

Market Cap: 469.27M

NYSE · time unavailable

CEO: Paul George Reitz

Sector: Industrials

Industry: Agricultural - Machinery

IPO Date: 1993-05-20

Website: https://www.titan-intl.com

Titan International, Inc. (TWI) - Company Information

Market Cap: 469.27M|Sector: Industrials

Company Profile

Titan International, Inc., together with its subsidiaries, manufactures and sells wheels, tires, and undercarriage systems and components for off-highway vehicles in North America, Europe, Latin America, the Commonwealth of Independent States region, the Middle East, Africa, Russia, and internationally. The company operates in Agricultural, Earthmoving/Construction, and Consumer segments. It offers rims, wheels, tires, and undercarriage systems and components for various agricultural equipment, including tractors, combines, skidders, plows, planters, and irrigation equipment. The company also offers rims, wheels, tires, and undercarriage systems and components for off-the-road earthmoving, mining, military, construction, and forestry equipment, including skid steers, aerial lifts, cranes, graders and levelers, scrapers, self-propelled shovel loaders, articulated dump trucks, load transporters, haul trucks, backhoe loaders, crawler tractors, lattice cranes, shovels, and hydraulic excavators. In addition, it provides bias and light truck tires; and products for ATVs, turf, and golf cart applications, as well as specialty and train brakes. It sells its products directly to original equipment manufacturers, as well as to the aftermarket through independent distributors, equipment dealers, and own distribution centers. Titan International, Inc. was founded in 1890 and is headquartered in Quincy, Illinois.

Analyst Sentiment

92%
Strong Buy

From 3 Active Polls

1Y Forecast: $13.00

▲ +78.3% Potential Upside

Consensus Target Metrics

Low Bound

$13

Median

$13

High Bound

$13

Average

$13

Price & Moving Averages

Loading chart...

🎯 Wall Street Analyst Intelligence Report

1-Year structural target targets, chart projections, and sentiment maps.

Average 1Y Target
$13.00
▲ +78.33% Upside
Low Target
$13.00
78% Risk
Median Target
$13.00
78% Mid
High Target
$13.00
78% Max
Consensus
Hold
3 / 9 Buys

Consensus Trend Projection

Trailing closures vs. 12-month metrics map.

Analyst Vote Distribution

Aggregate institutional coverage sentiment weights.

📊 Historical Valuation Multiples

Real-time Trailing Twelve Month (TTM) momentum side-by-side with discrete quarterly metrics.

Fiscal QuarterTTMQ1 2026Q4 2025Q3 2025Q2 2025Q1 2025Q4 2024Q3 2024Q2 2024
Period EndingTrailing 12MMar 31, 2026Dec 31, 2025Sep 30, 2025Jun 30, 2025Mar 31, 2025Dec 31, 2024Sep 30, 2024Jun 30, 2024
Market Cap ($M)469443500483650531441585530
Enterprise Value ($M)1,0371,0101,0089871,1791,062929999961
Price to Earnings Ratio (P/E)-5.37-4.57-2.23-53.39-35.75-204.5282.37-8.0261.69
Price/Earnings-to-Growth Ratio (PEG)-0.20-43.65-7.325.95
Price to Sales Ratio (P/S)0.250.881.221.041.411.081.151.311.00
Price to Book Ratio (P/B)0.940.890.970.851.140.990.890.980.87
Price to Free Cash Flow Ratio (P/FCF)-15.26-7.41-98.4816.16154.05-9.90-96.5414.019.96
Enterprise Value to Sales (EV/Sales)2.002.462.122.562.162.422.231.81
Enterprise Value to EBITDA (EV/EBITDA)11.9735.53178.9039.2843.0735.79187.9261.0723.17
Debt to Equity Ratio6.551.491.381.251.251.321.381.071.08

TWI Growth Runway Model

Standard long term linear growth fade

Multi-Stage Discounted Cash Flow Sandbox

Market Price$7.29
Intrinsic Value$7.29
Market Alignment
Undervalued by 0.0%relative to calculated intrinsic value
9.00%
Exp: 0%0%
i

Growth runway slowdown

This value provides a time window for the growth rate to decline beyond Stage 1 toward the terminal rate. Longer windows are most useful for companies with high growth starting conditions or strong competitive advantages. This option stretches out the growth rate slowdown across 5, 10, or 15-year steps. A high-growth starting condition (exceeding a 25% initial growth rate) automatically applies a curve decay to simulate realistic, rapid market saturation.
i

Terminal growth rate

With long-term inflation between 3-5%, revenue must grow by that baseline to maintain flat real-world market share. This value sets the permanent terminal growth rate to factor into the valuation beyond the growth slowdown runway toward maturity.

3-Stage Financial Runway Horizon

🧠 Perpetuity Horizon Engine (Stage 3: Post-2035)

Terminal FCF Base$0.08B
Perpetuity TV Value$1.56B
Discounted TV (PV)$0.66B
TV Weighting %57.8%
⚠️
Financial Model Disclaimer & Risk Disclosure: This interactive scenario simulator is an educational sandbox provided strictly for informational and analytical research purposes. Core historical financial statements and consensus estimates are sourced directly via Financial Modeling Prep (FMP). All downstream outputs are entirely deterministic, hypothetical projections generated by combining automated mathematical formulas (including linear interpolation and Gaussian bell-curve decay models) with user-selected variables and third-party financial data inputs. Users assume all liability for trading decisions executed based on these sandbox calculations.

📘 Full Research Report

ℹ️

AI-Generated Research: This report is for informational purposes only.

📘 TITAN INTERNATIONAL INC (TWI) — Investment Overview

🧩 Business Model Overview

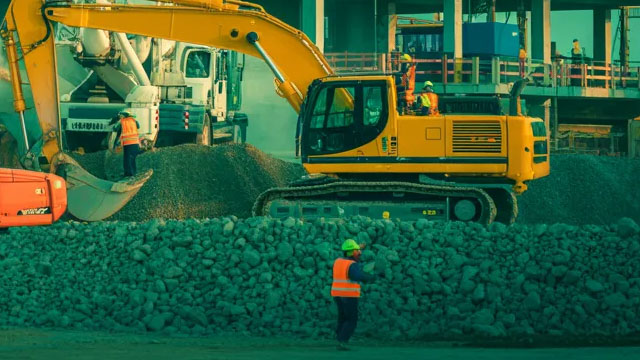
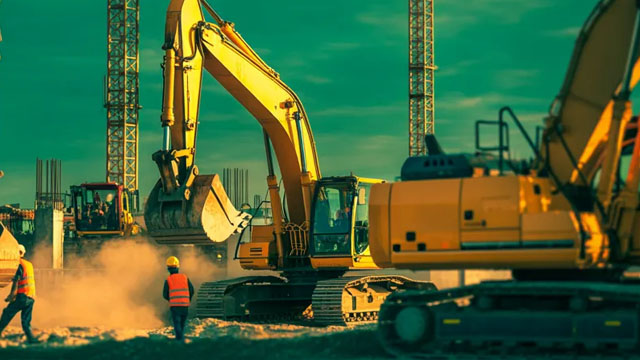
Titan International manufactures off-highway tires and wheels used in demanding applications such as mining, construction, agriculture, and specialty industrial equipment. The value chain spans: (1) design and engineering of tire/wheel specifications to meet vehicle load and durability requirements, (2) manufacturing in global facilities, and (3) distribution to OEMs (original equipment manufacturers) and the replacement/aftermarket channel. Customer stickiness comes from long product qualification cycles and the operational risk of switching suppliers for safety- and performance-critical components. Once a tire or wheel is qualified for a specific vehicle program, performance, warranty alignment, and supply reliability create durable commercial relationships.

💰 Revenue Streams & Monetisation Model

Revenue is primarily driven by two monetization channels:
  • OEM/Program sales: Bulk volumes tied to equipment production schedules (mining fleets, construction equipment, and agricultural machinery). Pricing and margins depend on component specifications, customer contract structure, and manufacturing utilization.
  • Aftermarket/replacement sales: Replacement volumes correlate with operating hours, fleet age, and maintenance spending. Aftermarket tends to be more resilient than OEM during equipment downturns because asset owners must maintain uptime.
Margin drivers typically include:
  • Product mix and specification complexity: Higher-value tire/wheel designs and application-specific engineering support better pricing power.
  • Manufacturing efficiency: Utilization and yield affect unit economics due to fixed-cost absorption.
  • Input cost pass-through: Rubber, steel, and energy costs influence realized margins; the company’s ability to negotiate pricing/terms during cost swings is a key determinant.

🧠 Competitive Advantages & Market Positioning

Titan’s competitive position is best understood as an “industrial OEM qualification + application engineering” model rather than a broad consumer-brand play. Primary moat: Switching costs via qualification and performance risk - Off-highway tires and wheels are engineered to strict load, durability, and fitment requirements. OEM customers and large fleet operators generally require extensive validation and ongoing performance/warranty alignment before approving a supplier. - This creates high switching costs (technical requalification, operational downtime risk, and warranty/performance history considerations), limiting how quickly competitors can displace established programs. Secondary moat: Manufacturing and supply reliability at scale - Competing effectively in off-highway components requires scale, process know-how, and delivery reliability to support OEM production plans and time-sensitive fleet maintenance. - Facilities and sourcing practices that sustain quality and delivery performance support customer retention even when commodity inputs fluctuate. Competitive benchmarking (2–3 key rivals) - Bridgestone: Broad global tire portfolio with strong OEM presence in off-road segments; competes through scale and technology across major end markets. - Michelin: Strong engineering capabilities and premium positioning in off-highway tires; competes via durability-focused product performance and program penetration. - Goodyear: Active in off-highway tires and large distribution footprints; competes on product availability and OEM/replacement reach. Contrast in positioning Titan’s industry focus centers on off-highway niches where supplier qualification, application engineering, and customer program depth matter. Versus large diversified tire OEMs, Titan’s relative advantage often derives from targeted product programs and its ability to supply specific applications (including wheels and specialty offerings), rather than attempting to outspend or out-portfolio the largest global brands in all geographies and vehicle classes.

🚀 Multi-Year Growth Drivers

Over a 5–10 year horizon, demand fundamentals for off-highway tires and wheels are tied to fleet and asset utilization rather than purely to consumer cycles:
  • Infrastructure and resource-cycle capex: Mining and construction equipment fleets expand and refresh in line with long-cycle capital spending, supporting OEM ordering activity and replacement volumes over time.
  • Agricultural mechanization and productivity: Larger, more capable equipment and higher utilization drive higher tire and wheel replacement needs, especially for performance-demanding applications.
  • Aftermarket durability economics: Operating assets for longer periods sustains replacement demand. Even when equipment production is softer, maintenance spending continues.
  • Value-added mix shift: Greater penetration of higher-spec tire/wheel designs (longer life, improved performance, application-specific engineering) supports a structural improvement in revenue quality and pricing.

⚠ Risk Factors to Monitor

Key structural and operational risks include:
  • Cyclicality and end-market sensitivity: Mining, construction, and agricultural equipment cycles can drive volatility in OEM orders and aftermarket intensity.
  • Input cost volatility: Rubber, steel, and energy costs can compress margins if price realization and contract terms lag input moves.
  • Competitive pricing pressure: Global tire and wheel manufacturers with scale can pressure pricing during downcycles, limiting margin recovery.
  • Customer concentration and program timing: OEM program ramps and customer sourcing decisions can materially affect volumes and capacity utilization.
  • Capital intensity and execution risk: Manufacturing networks require ongoing investment for quality, compliance, and process improvements; underutilization can amplify fixed-cost burdens.
  • Trade and regulatory friction: Tariffs, import/export restrictions, and evolving compliance requirements can alter cost structures and demand patterns.

📊 Valuation & Market View

The market typically prices off-highway industrial component manufacturers based on:
  • EV/EBITDA or EV/EBIT: reflects operating leverage, manufacturing utilization, and normalized earnings through cycles.
  • Working capital and cash conversion: inventory and receivables behavior influence free cash flow, especially during demand swings.
  • Margin durability drivers: product mix, pricing power relative to inputs, and cost discipline move valuation materially.
Key valuation sensitivities usually include end-market expectations (construction/mining/ag spending), assumptions about input cost pass-through, and the trajectory of utilization and aftermarket mix.

🔍 Investment Takeaway

Titan International’s long-term investment case rests on a defensible position in safety- and performance-critical off-highway tires and wheels, where supplier qualification creates meaningful switching costs. The company’s ability to maintain manufacturing efficiency, manage input cost volatility, and sustain aftermarket and program participation through cycles is central to achieving resilient earnings power. Risks remain tied to cyclicality, commodity-linked costs, and competitive pricing, but the core structural moat is the difficulty of replacing qualified suppliers in demanding industrial applications.

⚠ AI-generated — informational only. Validate using filings before investing.

📰 Market News & Coverage

15 Stories Available

Real-time institutional reporting and market updates for TWI.

prnewswire.com2026-05-01

TITAN INTERNATIONAL, INC. TO PARTICIPATE IN OPPENHEIMER INDUSTRIAL GROWTH CONFERENCE

WEST CHICAGO, Ill., May 1, 2026 /PRNewswire/ -- Titan International, Inc. (NYSE: TWI) ("Titan" or the "Company"), a leading global manufacturer of off-highway wheels, tires, assemblies, and undercarriage products, today announced that management will participate in the upcoming Oppenheimer Industrial Growth Virtual Conference.

seekingalpha.com2026-04-30

Titan International, Inc. (TWI) Q1 2026 Earnings Call Transcript

Titan International, Inc. (TWI) Q1 2026 Earnings Call Transcript

prnewswire.com2026-04-30

Titan International, Inc. Reports First Quarter Financial Results

WEST CHICAGO, Ill., April 30, 2026 /PRNewswire/ -- Titan International, Inc. (NYSE: TWI) ("Titan" or the "Company"), a leading global manufacturer of off-highway wheels, tires, assemblies, and undercarriage products, today reported financial results for the first quarter ended March 31, 2026.

seekingalpha.com2026-04-24

Despite Progress On A Turnaround, Titan International Doesn't Deserve Optimism Yet

Titan International, Inc. remains a Hold as economic headwinds in agriculture and construction overshadow recent revenue and cash flow improvements. TWI's Q4 2025 saw revenue rise 7% year-over-year, but net losses widened; cash flow and EBITDA improved modestly. Management guides for FY2026 revenue of $1.85–$1.95 billion and EBITDA of $105–$115 million, with shares trading at a discount to peers.

defenseworld.net2026-04-21

Titan International (NYSE:TWI) Stock Price Passes Above 200 Day Moving Average – What’s Next?

Titan International, Inc. (NYSE: TWI - Get Free Report)'s stock price crossed above its 200-day moving average during trading on Monday. The stock has a 200-day moving average of $8.39 and traded as high as $8.46. Titan International shares last traded at $8.3850, with a volume of 621,765 shares changing hands. Analyst Ratings Changes Several

prnewswire.com2026-04-08

Titan International, Inc. to Announce First Quarter 2026 Financial Results on April 30

CHICAGO, April 8, 2026 /PRNewswire/ -- Titan International, Inc. will release its first quarter 2026 financial results before the opening of the market on Thursday, April 30, 2026 to be followed by a teleconference and webcast on Thursday, April 30, 2026 at 9:00 a.m. Eastern Time.

prnewswire.com2026-03-30

Versigent Set to Join S&P SmallCap 600

NEW YORK, March 30, 2026 /PRNewswire/ -- Versigent plc (NYSE: VGNT) will replace Titan International Inc. (NYSE: TWI) in the S&P SmallCap 600 effective prior to the opening of trading on Thursday, April 2. S&P 500 constituent Aptiv plc (NYSE: APTV) is spinning off Versigent in a transaction expected to be completed April 1.

prnewswire.com2026-03-18

Titan International, Inc. Announces Consolidation of Tire Production to Improve Operational Efficiency of US Manufacturing

WEST CHICAGO, Ill., March 18, 2026 /PRNewswire/ -- Titan International, Inc. (NYSE: TWI) ("Titan" or the "Company"), a leading global manufacturer of off-highway wheels, tires, assemblies, and undercarriage products, today announced a decision to consolidate production within its North American manufacturing footprint, which will result in the closure of its manufacturing facility in Jackson, Tennessee by the end of October 2026.

seekingalpha.com2026-02-27

Titan International, Inc. (TWI) Q4 2025 Earnings Call Transcript

Titan International, Inc. (TWI) Q4 2025 Earnings Call Transcript

prnewswire.com2026-02-26

TITAN INTERNATIONAL, INC. REPORTS FOURTH QUARTER AND FISCAL YEAR 2025 FINANCIAL PERFORMANCE

WEST CHICAGO, Ill., Feb. 26, 2026 /PRNewswire/ -- Titan International, Inc. (NYSE: TWI) ("Titan" or the "Company"), a leading global manufacturer of off-highway wheels, tires, assemblies, and undercarriage products, today reported financial results for the fourth quarter and year ended December 31, 2025.

prnewswire.com2026-02-12

Kim Marvin Steps Down from Titan International Inc. Board of Directors

CHICAGO, Feb. 12, 2026 /PRNewswire/ -- Titan International, Inc. announces that Kim Marvin has stepped down from its Board of Directors. Mr. Marvin stepped down from the Board of Directors of Titan International, Inc. after approximately 24 months of service due to time constraints and other professional commitments.

prnewswire.com2026-02-04

Titan International, Inc. to Announce Fourth Quarter 2025 Financial Results on February 26

CHICAGO, Feb. 4, 2026 /PRNewswire/ -- Titan International, Inc. will release its fourth quarter 2025 financial results before the opening of the market on Thursday, February 26, 2026 to be followed by a teleconference and webcast on Thursday, February 26, 2026 at 9:00 a.m. Eastern Time.

prnewswire.com2025-12-04

Titan International Inc. Announces Executive Leadership Transitions Including New Role of Chief Transformation Officer to Accelerate Strategic Objectives

WEST CHICAGO, Ill. , Dec. 4, 2025 /PRNewswire/ -- Titan International, Inc. (NYSE: TWI) ("Titan" or the "Company"), a leading global manufacturer of off-highway wheels, tires, assemblies, and undercarriage products, today announced a series of executive appointments designed to strengthen its leadership team and support the company's long-term strategic objectives.

defenseworld.net2025-11-15

Bailard Inc. Acquires 13,731 Shares of Titan International, Inc. $TWI

Bailard Inc. lifted its holdings in shares of Titan International, Inc. (NYSE: TWI) by 33.1% during the undefined quarter, according to its most recent disclosure with the SEC. The fund owned 55,200 shares of the industrial products company's stock after purchasing an additional 13,731 shares during the period. Bailard Inc. owned 0.09% of

seekingalpha.com2025-11-06

Titan International, Inc. (TWI) Q3 2025 Earnings Call Transcript

Titan International, Inc. ( TWI ) Q3 2025 Earnings Call November 6, 2025 9:00 AM EST Company Participants Alan Snyder - VP of Financial Planning & Investor Relations Paul Reitz - CEO, President & Director David Martin - Senior VP, CFO & Company Secretary Conference Call Participants Michael Shlisky - D.A. Davidson & Co., Research Division Derek Soderberg - Cantor Fitzgerald & Co., Research Division Steve Ferazani - Sidoti & Company, LLC Hans Baldau Kirk Ludtke - Imperial Capital, LLC, Research Division Presentation Operator Good morning, ladies and gentlemen, and welcome to the Titan International, Inc. Third Quarter 2025 Earnings Conference Call.

📊 AI Financial Analysis

Powered by StockMarketInfo
Earnings Data: Q Ending 2026-03-31

"TWI reported Q1 2026 revenue of $505.1M and net income of -$24.2M (EPS -$0.38). YoY, revenue rose from $490.7M in Q1 2025 to $505.1M (+3.0%), while net income deteriorated from a near-breakeven -$0.6M to -$24.2M (worsened by ~+$23.6M). QoQ, revenue increased from $410.4M in Q4 2025 to $505.1M (+23.1%), but losses widened: net income fell from -$56.0M in Q4 2025 to -$24.2M (an improvement of $32.2M). Profitability was mixed across the quarter trend: gross margin improved to 14.1% from 10.1% in Q4 (and roughly flat vs. Q1 2025 at 14.0%), but operating margin remained weak/negative, and the company stayed loss-making at the net level (-4.8% net margin). Interest expense remained material (interest coverage ~1.15x), and operating cash flow turned negative to -$46.5M, driven by working-capital outflows, resulting in free cash flow of -$59.8M. Balance sheet resilience is moderate: total assets increased to $1.71B, equity was $0.50B, and leverage remains elevated with net debt of ~$567M. Shareholder returns appear supportive on momentum: the stock is up 20.24% over 1 year, with no visible dividends or buybacks in the provided cash flow data. Consensus valuation target is $13 versus the $8.14 price, implying upside if the profitability/cash-flow trajectory stabilizes."

Revenue Growth

Positive

Q1 2026 revenue was $505.1M: +23.1% QoQ vs Q4 2025 and +3.0% YoY vs Q1 2025.

Profitability

Neutral

Net income worsened YoY (from -$0.6M to -$24.2M) despite improved gross margin (14.1% vs 10.1% QoQ). Net margin remains loss-making (-4.8% in Q1 2026).

Cash Flow Quality

Neutral

Operating cash flow turned negative (-$46.5M) and free cash flow was -$59.8M, largely due to working-capital outflows; no dividends and no buybacks reported.

Leverage & Balance Sheet

Fair

Assets rose to $1.71B and equity was $0.50B, but leverage stays high (net debt ~$567M; debt-to-equity ~1.49). Liquidity is adequate with current ratio ~2.19.

Shareholder Returns

Positive

1-year price momentum is strong (+20.24%). Cash flow indicates limited shareholder distributions (dividendsPaid=0, buybacks=0 in provided data).

Analyst Sentiment & Valuation

Neutral

Consensus target is $13 vs current ~$8.14, suggesting upside; however, valuation support is tempered by continuing net losses and weakening cash generation.

Disclaimer:This analysis is AI-generated for informational purposes only. Accuracy is not guaranteed and this does not constitute financial advice.

Fundamentals Overview

Loading fundamentals overview...

Twilio delivered a strong Q1 with accelerating revenue and profitability: $1.4B (+20% YoY reported; +16% organic) and record non-GAAP income from operations of $279M (+31% YoY), alongside $132M free cash flow. Growth is increasingly framed around AI-enabled communications and a software/add-on layer, evidenced by Branded Calling and Conversational Intelligence growing >100% YoY and voice add-ons growing in the mid-30s. Messaging also accelerated to 25% growth, but management emphasized durability is driven by the broader product portfolio and cross-channel/multiproduct adoption rather than RCS alone (RCS described as small in absolute contribution). Margins expanded in operations (+160 bps YoY), but gross margin fell 180 bps YoY to 49.6% due to $46M incremental U.S. carrier pass-through fees tied to A2P fee increases; guidance assumes additional Verizon fee impact effective May 1. Full-year organic and reported growth ranges were raised, with margin modeling incorporating ~200 bps gross-margin drag from carrier fees.

AI IconGrowth Catalysts

  • Voice revenue grew 20% YoY (sixth consecutive quarter of accelerated growth); Voice AI use cases cited as ongoing catalyst
  • Software add-ons accelerating: Branded Calling and Conversational Intelligence both grew >100% YoY; voice add-ons also cited as mid-30s growth
  • Messaging momentum: Messaging revenue up 25% with WhatsApp and RCS strength; RCS volume more than doubled QoQ
  • Cross-sell/multiproduct expansion: multiproduct customer count up 29% in Q1; customers expanding from single-channel into cross-channel + software layers

Business Development

  • Scorpion partnered by integrating Voice, Messaging and ConversationRelay to build an AI agent; reported 39% booking-rate lift, 6,500 appointments captured, $8.4M revenue in 3 months
  • Sierra signed a significant cross-sell deal to fuel global expansion
  • Bland.ai committed to a multiyear partnership to use Messaging, Voice, and software add-ons (including recordings and Branded Calling) for its AI agent platform
  • Historic professional sports league signed a 7-figure deal to use Verify as authentication for millions of fans
  • KPN Netherlands inked an RCS deal to power RCS across all major mobile operators in the Netherlands
  • Telavox signed to enable RCS for organizations in regulated industries
  • PGA of America multiyear partnership: expands Twilio usage to power personalized engagement for 30,000 PGA golf professionals and millions of golfers
  • Signed/announced customers: Aloware, Grupo ProTG, Posh, Sela AI, Solace

AI IconFinancial Highlights

  • Revenue: $1.4B (+20% YoY reported; +16% YoY organic); fastest organic growth rate since 2022
  • Non-GAAP gross profit: $697M (+16% YoY); non-GAAP gross margin 49.6% (down 180 bps YoY; down 40 bps QoQ)
  • Margin drivers: incremental carrier pass-through fees $46M tied to increased U.S. A2P fees; without these, non-GAAP gross margin would be +50 bps sequentially
  • Non-GAAP income from operations: $279M (up 31% YoY), ahead of expectations; non-GAAP operating margin 19.8% (+160 bps YoY; +110 bps QoQ) with ~70 bps headwind from incremental U.S. carrier fees
  • Stock-based compensation: 9.7% of revenue (down 220 bps YoY; down 160 bps QoQ) and first time below 10% since IPO; ahead of prior 2027 target
  • Free cash flow: $132M (includes $141M payment for 2025 cash bonus program)
  • Incremental carrier fees: ~7 points to messaging growth and ~4 points to DBNE

AI IconCapital Funding

  • Share repurchases: $253M in Q1 2026
  • Remaining authorization: ~$900M on current buyback authorization
  • Free cash flow: $132M in Q1 (with noted bonus-program payment impact)

AI IconStrategy & Ops

  • SIGNAL conference next week (May 6–7, San Francisco): to unveil new platform capabilities orchestrating context-rich conversations with persistent memory across channels for humans and AI agents
  • Onboarding/upgrade process investments increased self-serve conversion rates
  • Go-to-market enablement: reorganized sales motion for multiproduct selling; compensation plans + specialist motion to drive cross-sell and higher multi-product deal frequency
  • Prior rearchitecture and data interoperability referenced as enabling CDP-to-comms enrichment and ‘memory’/persistency for lifetime customer value

AI IconMarket Outlook

  • Q2 2026 revenue target: $1.42B–$1.43B (15.5%–16.5% reported growth; 10%–11% organic growth)
  • Q2 carrier fees: Q2 reported guidance assumes $71M incremental U.S. carrier fees (Verizon fee increase effective May 1)
  • Full-year organic growth raised to 9.5%–10.5% (from 8%–9%); full-year reported revenue raised to 14%–15% (from 11.5%–12.5%)
  • Full-year non-GAAP gross profit dollar growth expected similar to organic revenue growth rate
  • Full-year revenue assumes ~$235M incremental pass-through U.S. carrier fee revenue (up from $190M previously)
  • Modeling note: incremental fees expected to reduce full-year 2026 non-GAAP gross margin by ~200 bps vs full-year 2025
  • Q2 non-GAAP income from operations: $250M–$260M; includes annual merit increases and SIGNAL-related expenses
  • Full-year non-GAAP income from operations raised to $1.08B–$1.10B (from $1.04B–$1.06B); full-year free cash flow raised to $1.08B–$1.10B

AI IconRisks & Headwinds

  • U.S. carrier A2P fee increases: incremental pass-through fees of $46M in Q1 pressured non-GAAP gross margin (down 180 bps YoY; down 40 bps QoQ) and ~70 bps operating margin headwind in Q1
  • Customer cost pressure from carriers raised fees (not impacting Twilio profitability directly, but affecting customers—particularly small businesses)
  • RCS is early relative to overall messaging base (RCS volume growing quickly but characterized as not meaningful to financial results)
  • Voice AI production scaling: regulated industries show slower progression due to high-stakes experimentation and longer time to production

Q&A: Analyst Interest

  • Messaging durability: Analysts asked how much RCS vs AI-native attachment drove Q1 messaging acceleration and whether growth is durable into tougher 2Q compares; management downplayed RCS/AI-native incremental impact, citing ~60% business base, RCS small contribution, and messaging operational growth ~18% YoY.
  • Voice AI scaling bottlenecks: Analysts asked whether Voice AI is moving from experiments into meaningful production and what limits scaling; management said adoption is faster in non-regulated industries (pilots translating to production) but regulated is slow due to high stakes, implying longer runway for larger spend.
  • GAAP vs non-GAAP margin mechanics: Analysts asked if GAAP operating margin benefited from unusual one-time items and how to think about GAAP operating margin going forward; management cited GAAP margin driven by non-GAAP operating profit growth, ongoing reduction in stock-based comp, and lower intangible amortization, with no other unusual items.

Sentiment: POSITIVE

Note: This summary was synthesized by AI from the TWI Q1 2026 earnings transcript. Financial data is complex; please verify all metrics against official SEC filings before making investment decisions.

📋 Official Regulatory 10-K / 10-Q SEC Filings

Direct authenticated documentation links to audited SEC database reports for TWI.

SEC EDGAR Live Feed
Loading financial data and tables...
📁

SEC Filings (TWI)

© 2026 Stock Market Info — Titan International, Inc. (TWI) Financial Profile