Visteon Corporation

Visteon Corporation (VC) Market Cap

Visteon Corporation has a market capitalization of .

No quote data available.

CEO: Sachin S. Lawande

Sector: Consumer Cyclical

Industry: Auto - Parts

IPO Date: 2010-10-05

Website: https://www.visteon.com

Visteon Corporation (VC) - Company Information

Market Cap: -|Sector: Consumer Cyclical

Company Profile

Visteon Corporation, an automotive technology company, engineers, designs, and manufactures automotive electronics and connected car solutions for vehicle manufacturers worldwide. The company provides instrument clusters, including analog gauge clusters to 2-D and 3-D display-based devices; information displays that integrate a range of user interface technologies and graphics management capabilities, such as 3-D, active privacy, TrueColor enhancement, cameras, optics, haptic feedback, and light effects; and Phoenix, a display audio and embedded infotainment platform, as well as onboard artificial intelligence-based voice assistant with natural language understanding. It also offers wired and wireless battery management systems; telematics control unit to enable secure connected car services, software updates, and data; and head-up displays. In addition, the company provides SmartCore, an automotive-grade, integrated domain controller; DriveCore, a platform for addressing multiple levels of vehicle automation; and body domain modules, which integrate various functions, such as central gateway, body controls, comfort, and vehicle access solutions into one device. Visteon Corporation was incorporated in 2000 and is headquartered in Van Buren, Michigan.

Analyst Sentiment

74%
Strong Buy

From 12 Active Polls

1Y Forecast: $121.00

▲ +0.0% Potential Upside

Consensus Target Metrics

Low Bound

$115

Median

$119

High Bound

$135

Average

$121

Price & Moving Averages

Loading chart...

🎯 Wall Street Analyst Intelligence Report

1-Year structural target targets, chart projections, and sentiment maps.

Average 1Y Target
$121.00
▲ +3.01% Upside
Low Target
$115.00
-2% Risk
Median Target
$119.00
1% Mid
High Target
$135.00
15% Max

Consensus Trend Projection

Trailing closures vs. 12-month metrics map.

Analyst Vote Distribution

Aggregate institutional coverage sentiment weights.

Sentiment volume allocation data unavailable.

Historical valuation matrix unavailable.

📘 Full Research Report

ℹ️

AI-Generated Research: This report is for informational purposes only.

📘 VISTEON CORP (VC) — Investment Overview

🧩 Business Model Overview

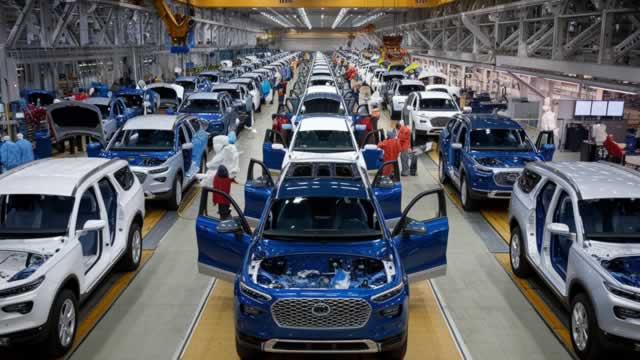
VISTEON CORP is an automotive supplier that designs and manufactures integrated modules used by original equipment manufacturers (OEMs) and their vehicle platforms. The business model is program- and platform-based: Visteon partners with OEMs during vehicle development, earns “design-in” positions through engineering collaboration, and then manufactures modules for the production life of those vehicle programs. A meaningful portion of revenue is tied to vehicle build volumes, with follow-on opportunities from platform refreshes, engineering changes, and aftermarket/service replacements.

From an economic standpoint, the value chain centers on translating OEM requirements into manufacturable systems—particularly in cockpit/user interface content and thermal/closure-related subsystems—then operating factories at scale while managing costs, quality, and delivery performance to maintain qualified supply status.

💰 Revenue Streams & Monetisation Model

Revenue is primarily earned through:

  • Production supply (program-based): Sale of modules and components per vehicle produced under long-cycle contracts and purchase agreements.
  • Engineering and development services: Upfront and change-order work tied to program launches, variants, and technical updates (often supporting customer “design-in” and sustaining engineering governance).
  • Aftermarket/service: Replacement and service-related sales where applicable, typically smaller than production revenue but helpful for smoothing demand.

Margin drivers are less dependent on pricing power alone and more dependent on operational execution: manufacturing yield, logistics performance, cost-down programs, sourcing discipline, and the ability to protect profitability through engineering change management. Program mix and regional content also matter, because module complexity and supplier economics vary by platform and geography.

🧠 Competitive Advantages & Market Positioning

The central moat is qualification- and certification-driven switching costs, reinforced by program economics. Automotive content is “locked in” through testing, homologation, safety/quality requirements, and sustained production processes. Competitors can win share, but displacement is difficult once a supplier is qualified—especially when Visteon has embedded engineering know-how, established manufacturing know-how for specific module architectures, and integrated vendor processes within an OEM’s manufacturing workflow.

Visteon’s positioning is concentrated in automotive interior/cockpit systems and related electronic/thermal content, aligning it with suppliers whose differentiation is driven by integration, electronics/controls competence, and supply chain execution for complex modules.

  • Lear Corporation: Broad presence in seating and interior systems with similar design-in dynamics. Lear competes for interior content platforms; Visteon’s emphasis is more focused on cockpit modules and adjacent subsystem content rather than seating-led diversification.
  • Magna International: Wide portfolio across seating, interiors, powertrain and chassis components. Magna’s strength is scale and breadth; Visteon competes by being more specialized in certain cockpit and subsystem architectures and by leveraging engineering depth for program transitions.
  • Continental: Strong in automotive electronics and cockpit-related technology. Continental can pursue electronics-heavy content; Visteon’s competitive approach typically emphasizes module integration and manufacturing execution in the cockpit and thermal-adjacent arenas, competing where OEMs value integrated supplier capability rather than standalone electronics.

This competitive landscape rewards suppliers that can repeatedly launch programs, meet quality targets, and deliver cost competitiveness through production ramp cycles—creating a practical barrier for competitors relying solely on bidding without demonstrated manufacturing stability.

🚀 Multi-Year Growth Drivers

Over a 5–10 year horizon, Visteon’s addressable growth is supported by structural trends that increase automotive content per vehicle and raise the complexity of interior and thermal systems:

  • More vehicle content per platform: Growing electronics integration and more sophisticated user experiences increase demand for modules that combine hardware, controls, and systems engineering.
  • Software-enabled vehicle architectures: Higher functional complexity and tighter integration requirements favor suppliers with engineering discipline and validated production processes.
  • Thermal efficiency and electrification-related engineering needs: Electrified powertrains increase thermal management complexity across cabins and components, supporting demand for capable thermal/controls content.
  • Platform longevity with refresh cycles: Even when total vehicle production fluctuates, OEM refresh strategies create recurring engineering change and variant opportunities that can extend profitable content periods.
  • Geographic supply chain optimization: As OEM production footprints evolve, suppliers that can adapt manufacturing and logistics to customer needs can win and retain content across regions.

TAM expansion for the category is driven by higher module content complexity and integration depth rather than a purely volume-led growth story. The key for sustained value creation is maintaining design-in momentum and protecting margins through cost-down execution during program ramp and lifecycle changes.

⚠ Risk Factors to Monitor

  • Automotive cyclicality: Revenue and margins are sensitive to production volumes, OEM build plans, and inventory normalization across the supply chain.
  • Program ramp and quality execution risk: Defects, delivery issues, or cost overruns during manufacturing ramp can compress margins and damage customer confidence.
  • Customer concentration and bargaining leverage: Large OEMs and platform decision cycles can shift pricing pressure, contract terms, or design-in priorities.
  • Cost inflation and supply chain volatility: Input cost swings (labor, materials, logistics) can require rapid cost-down actions to preserve profitability.
  • Technology and design displacement risk: Electronics integration and architectural shifts can change system boundaries, potentially enabling competitors with different integration strengths to win new designs.
  • Capital intensity and footprint management: Manufacturing networks require disciplined investment to balance service levels, capacity utilization, and return on invested capital.

📊 Valuation & Market View

The market typically values automotive suppliers based on earnings power through the cycle, with emphasis on EV/EBITDA and free cash flow durability. Key factors that move valuation multiples include:

  • Margin trajectory and cost discipline: Evidence of sustainable gross margin after ramp and under cost inflation improves perceived earnings quality.
  • Program win quality: Content depth, lifecycle length, and the expected stability of customer demand increase confidence in forward earnings.
  • Cash conversion: Working capital management and capital efficiency influence free cash flow credibility, especially through production cycles.
  • Balance sheet resilience: Leverage and liquidity affect downside protection during downturns.

Because demand is cyclical, the market often assigns a premium to suppliers demonstrating consistent execution, credible cost-down pathways, and repeatable design-in outcomes.

🔍 Investment Takeaway

VISTEON’s long-term investment case rests on qualification-driven switching costs and the supplier’s ability to translate engineering integration into manufacturable, cost-competitive module output. Growth prospects are supported by higher vehicle content complexity in cockpit and thermal-adjacent systems, with value creation tied to maintaining design-in momentum, protecting margins through production lifecycle ramps, and managing cash generation through automotive cycles.


⚠ AI-generated — informational only. Validate using filings before investing.

📊 AI Financial Analysis

Powered by StockMarketInfo
Earnings Data: Q Ending 2026-03-31

"Visteon Corporation (VC) demonstrated a revenue of $954 million with a net income of $65 million in the latest quarter. Year-over-year (YoY), revenue grew by 2.14% from $934 million and net income remained consistent with a slight QoQ increase from $14 million last quarter. Earnings per share (EPS) stood at $1.16, a significant increase from $0.52 last quarter due to increased profitability, but decreased compared to $2.39 a year ago due to more volatile quarterly income trends. Margins have shown some contraction over the period, with lower EPS in current cycles despite steady revenue growth. Total assets expanded by about 14.21% YoY, while total equity increased by 17.55%, indicating a solid financial position. The company's dividend consistency with a slight increase, coupled with a 39.51% increase in the stock price over the past year, suggests strong shareholder returns. Despite a YoY positive price momentum, dividend offerings remain minimal, slightly impacting the overall return score. Analyst price targets indicate a potential upside, supporting positive investor sentiment."

Revenue Growth

Positive

Revenue grew by 2.14% YoY and 0.63% QoQ, exhibiting slight upward momentum.

Profitability

Neutral

Marginal contraction YoY with persistent net income; EPS fluctuated significantly, impacting margin stability.

Cash Flow Quality

Positive

Consistent net income supports dividends, but payout ratios varied over quarters.

Leverage & Balance Sheet

Good

Strong asset and equity growth YoY enhances balance sheet resilience.

Shareholder Returns

Positive

Robust 1-year price increase and dividends, though low yield affects total return score.

Analyst Sentiment & Valuation

Neutral

Price targets suggest some upside potential; strong market performance supports positive sentiment.

Disclaimer:This analysis is AI-generated for informational purposes only. Accuracy is not guaranteed and this does not constitute financial advice.

Fundamentals Overview

Loading fundamentals overview...

Visteon delivered a solid Q1 with sales of $954M (+2% YoY) and adjusted EBITDA of $104M (10.9% margin), outperforming expectations despite lower vehicle production. The key near-term drag is semiconductor/memory costs and the timing mismatch of recoveries: pricing/commercial actions created a ~$15M EBITDA headwind and free cash flow was -$23M due to inventory build and Q1 incentive comp. Management reaffirmed full-year guidance (sales $3.625B–$3.825B; EBITDA $455M–$495M, ~12.8% midpoint margin), arguing that H1 strength and planned Q3–Q4 high-value launches (Toyota and HPC) offset a softer S&P-driven 2H setup (S&P reduced by ~1.5 pts; company reduced its 2H by ~2%). On the growth engine, Visteon secured ~$1B in new business in Q1, including an AI smart cockpit win with SAIC (IM brand) and SmartCore adoption in India—supporting a $6B annual new business target. Main risks remain memory tightness through 2027 and cost recovery timing/leakage.

AI IconGrowth Catalysts

  • New product launches: 20 launches across 11 automakers in Q1
  • Cockpit HPC / high-performance compute wins: AI-based smart cockpit systems (incremental content value >$1B booked across three OEMs)
  • SAIC China AI-capable cockpit system win with IM brand (third OEM customer for agentic AI smart cockpit)
  • SmartCore domain controller win in India (12-month launch schedule, start of production under 12 months; powers three cockpit displays)
  • Expansion of digital clusters in commercial vehicles (12-inch cluster with U.S. manufacturer; production starts early 2028)
  • Two-wheeler digital cluster expansion with Honda (incremental ~$100M lifetime sales)

Business Development

  • SAIC Motor (IM brand) for AI-capable smart cockpit systems in China (third OEM win; >$1B booked value across three OEMs)
  • European OEM in India for SmartCore domain controller (first SmartCore win with this customer)
  • U.S. manufacturer of purpose-built vehicles for defense/delivery/fire-emergency markets (new digital cluster customer; production early 2028)
  • Honda (incremental two-wheeler models for digital clusters; ~$100M incremental lifetime sales)
  • Toyota/Lexus (first launch with Lexus ES; driver display standard on all trims globally)
  • Nissan (digital cluster program on Infiniti QX65; U.S. and Middle East; standard 12-inch cluster across trims)
  • Zeekr (high-performance compute / cockpit domain controller win)
  • Mahindra (ramp-up of SmartCore system; India)
  • TVS (digital cluster program; India)

AI IconFinancial Highlights

  • Net sales: $954M (+2% YoY) ahead of expectations despite lower vehicle production; growth over market +3%
  • Adjusted EBITDA: $104M, 10.9% margin, broadly in line; Q1 expected as annual low point with improvement through the year
  • Adjusted free cash flow: -$23M driven by working capital/inventory build, 2025 incentive comp paid in Q1, and normal seasonality
  • Semiconductor/memory cost pressure remained elevated; timing mismatch of customer recoveries expected to weight more to later 2026
  • Pricing headwind: ~$5M in Q1 (lower than typical); net impact of commercial activities across pricing/recoveries: headwind just over ~$15M
  • EV program one-time settlements: sales benefit ~$20M; EBITDA benefit ~$10M; full-year guidance included ~$10M one-timers achieved in Q1
  • Year-over-year EBITDA bridge: remaining decline (~$5M) from lower volume, unfavorable FX, and slightly higher freight/logistics, partially offset by cost initiatives (vertical integration, engineering productivity)
  • No explicit bps changes stated in the excerpt; margin guidance implies ~12.8% EBITDA margin at midpoint (improvement from Q1 10.9%)

AI IconCapital Funding

  • Shareholder returns: $40M in Q1 (share repurchases $30M, dividends $10M)
  • Balance sheet: net cash $385M at quarter end
  • Free cash flow remains pressured near-term; company plans to maintain higher inventory levels to derisk semiconductor/memory supply constraints

AI IconStrategy & Ops

  • Operational execution: 20 product launches across 11 automakers; several high-profile vehicles
  • Supply chain risk management via inventory build during Q1 (deliberate action to manage supply chain risk and market volatility)
  • Proactive supply actions secured sufficient supply in Q1 despite tight semiconductor/memory environment
  • Memory supply strategy: qualifying additional sources; emerging suppliers expected to meet ~10% of total full-year demand for this year
  • Automation/engineering productivity and vertical integration referenced as ongoing levers (cost initiatives included product costing actions, vertical integration, engineering productivity, and resource rebalancing)

AI IconMarket Outlook

  • Reaffirm full-year guidance despite softer market setup: sales $3.625B to $3.825B (low single-digit growth over market)
  • Adjusted EBITDA guidance: $455M to $495M (~12.8% margin at midpoint)
  • Adjusted free cash flow guidance: $170M to $210M; trending toward lower end due to planned higher inventory to manage semiconductor/memory tightness
  • Guidance sensitivity framing from Q&A: company reduced S&P-based second half by ~2% for their setup; strong H1 and a softer H2 trajectory
  • Investor Day: June 25 in New York City (more detail on longer-term capital allocation priorities)

AI IconRisks & Headwinds

  • Middle East conflict drove S&P lowering of global light vehicle production forecast by ~1.5 percentage points; most impact in 2H (risk of further downside if hostilities persist)
  • Customer production now expected to decline mid-single digits YoY
  • Semiconductor and memory constraints: automotive relies on older memory tech nodes being phased out; AI/data center demand tightening availability and pricing pressure; environment expected to persist through 2027 before easing
  • Elevated semiconductor costs with associated customer recoveries weighted more to later in the year (timing mismatch risk)
  • Ford vehicle discontinuations and lower BMS volumes with GM (BMS headwinds cited across prepared remarks)
  • Potential leakage in cost recoveries due to timing issues; company expects leakage to become neutral in 2H and improve slightly in Q3/Q4

Q&A: Analyst Interest

  • Demand/production and LVP: Management said full-year sales and EBITDA guidance are maintained. Q1 was stronger than expected and benefited from ~$20M EV settlements (not to annualize). Q2 order visibility looks similar to Q1. 2H setup is derived from S&P, reduced by ~2%, with softer volume but major Toyota/HPC launches in Q3–Q4.
  • Memory supply vs recovery progress: Management separated supply constraints from recovery risk, stating supply is manageable with no customer production impact in Q1. Memory availability is tight because suppliers shift away from older automotive tech nodes; about ~10% of full-year demand may come from emerging suppliers. Recovery negotiations: ~$15M commercial leakage in Q1; most negotiations closing by Q2, targeting neutral commercial equation in 2H.
  • Decontenting and longer-term pass-through: Management said they see no interest in decontenting. Discussions focus on securing enough memory supply for 2027. Pricing/recovery agreements vary by customer: some multiyear pricing agreements flow into piece price; others rely on annual negotiations. Ramp-up in 2H is launch-driven (Toyota and HPC), expected to offset weaker vehicle volume.

Sentiment: MIXED

Note: This summary was synthesized by AI from the VC Q1 2026 earnings transcript. Financial data is complex; please verify all metrics against official SEC filings before making investment decisions.

Loading financial data and tables...
© 2026 Stock Market Info — Visteon Corporation (VC) Financial Profile