Vulcan Materials Company

Vulcan Materials Company (VMC) Market Cap

Vulcan Materials Company has a market capitalization of .

No quote data available.

CEO: Ronnie A. Pruitt

Sector: Basic Materials

Industry: Construction Materials

IPO Date: 1957-01-02

Website: https://www.vulcanmaterials.com

Vulcan Materials Company (VMC) - Company Information

Market Cap: -|Sector: Basic Materials

Company Profile

Vulcan Materials Company, together with its subsidiaries, produces and supplies construction aggregates primarily in the United States. It operates through four segments: Aggregates, Asphalt, Concrete, and Calcium. The Aggregates segment provides crushed stones, sand and gravel, sand, and other aggregates; and related products and services that are applied in construction and maintenance of highways, streets, and other public works, as well as in the construction of housing and commercial, industrial, and other nonresidential facilities. The Asphalt Mix segment offers asphalt mix in Alabama, Arizona, California, New Mexico, Tennessee, and Texas, as well as engages in the asphalt construction paving activity in Alabama, Tennessee, and Texas. The Concrete segment provides ready-mixed concrete in California, Maryland, New Jersey, New York, Oklahoma, Pennsylvania, Texas and Virginia, and Washington D.C. The Calcium segment mines, produces, and sells calcium products for the animal feed, plastics, and water treatment industries. The company was formerly known as Virginia Holdco, Inc. and changed its name to Vulcan Materials Company. Vulcan Materials Company was founded in 1909 and is headquartered in Birmingham, Alabama.

Analyst Sentiment

71%
Buy

From 23 Active Polls

1Y Forecast: $322.60

▲ +0.0% Potential Upside

Consensus Target Metrics

Low Bound

$283

Median

$324

High Bound

$360

Average

$323

Price & Moving Averages

Loading chart...

🎯 Wall Street Analyst Intelligence Report

1-Year structural target targets, chart projections, and sentiment maps.

Average 1Y Target
$322.60
▲ +14.65% Upside
Low Target
$283.00
1% Risk
Median Target
$323.50
15% Mid
High Target
$360.00
28% Max

Consensus Trend Projection

Trailing closures vs. 12-month metrics map.

Analyst Vote Distribution

Aggregate institutional coverage sentiment weights.

Sentiment volume allocation data unavailable.

Historical valuation matrix unavailable.

📘 Full Research Report

ℹ️

AI-Generated Research: This report is for informational purposes only.

📘 VULCAN MATERIALS (VMC) — Investment Overview

🧩 Business Model Overview

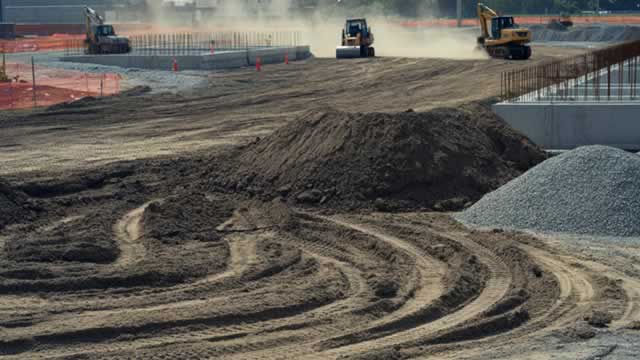
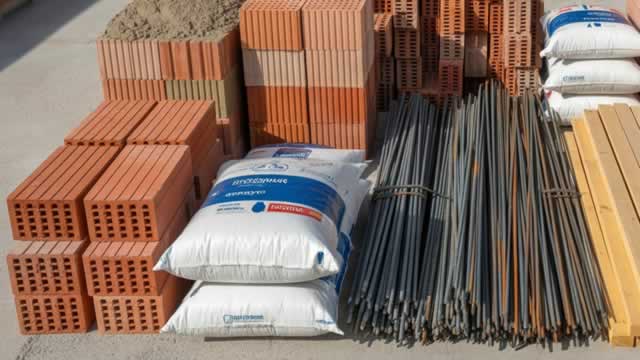
Vulcan Materials produces and sells construction aggregates (crushed stone, sand, gravel) and related products used in roads, bridges, buildings, and other heavy infrastructure. The value chain is anchored in (1) sourcing rock reserves through quarrying, (2) processing materials through crushing/screening operations, and (3) delivering product to job sites via company-managed or contracted logistics.

Demand is largely tied to “materials at the point of use,” so the business benefits when quarries are located close to customers and major construction corridors. Customer stickiness arises not from contracts alone, but from practical economics: haul distance and transportation cost dominate delivered pricing, making local supply the default for many projects.

💰 Revenue Streams & Monetisation Model

Revenue is predominantly transactional—sales of aggregates and related construction materials—driven by project activity and pricing per ton. Monetisation is influenced by:

  • Pricing versus volume balance: margin depends on the spread between realized pricing and cost inflation, not simply on volume growth.
  • Operating leverage: fixed quarry/plant costs can be absorbed when demand tightens utilization.
  • Logistics efficiency: lower delivered cost from nearby supply supports pricing power and stabilizes margins.
  • Product mix and specification complexity: higher-spec products can carry better economics but require capacity and quality controls.

While revenue is transactional, profitability behaves with structural elements—local supply constraints, permitted capacity, and logistics economics—that can support more durable earning power through cycles than purely commodity businesses.

🧠 Competitive Advantages & Market Positioning

Geographic cost advantage and logistical infrastructure are the central moats. Aggregates are bulky with high transport intensity; delivered cost is heavily influenced by proximity to quarries and efficient route density. Vulcan’s footprint and permitted operating sites enable it to serve demand in defined regional markets with competitive delivered pricing.

Additionally, permitting/reserve quality and capacity constraints create a form of regulatory and supply moat. New quarry development is slow and uncertain due to land access, environmental review, and community/agency approvals. This can limit incremental supply and protect market pricing during tighter demand periods.

  • Martin Marietta (MLM): Like Vulcan, Martin Marietta is a leading US aggregates producer with a focus on regional quarry advantages. Vulcan competes where its permitted supply and logistics economics are strongest; both firms concentrate on local market dominance rather than nationwide reach.
  • Summit Materials (SUM): Summit participates in similar end markets with a heavy emphasis on aggregates and construction materials. The competitive basis is the same—location and delivered cost—but Vulkan’s regional quarry network and customer access determine relative strength.
  • Holcim/CRH or local regional operators (e.g., Oldcastle Materials): Large building-materials groups can have scale in downstream channels, but aggregates economics remain local. Vulcan competes by maintaining permitted capacity and optimizing transportation to job sites.

🚀 Multi-Year Growth Drivers

Vulcan’s medium-term growth framework is driven more by market structure and infrastructure spend durability than by technology-led disruption:

  • Infrastructure and public works: ongoing needs for roads, bridges, ports, and resilience-related construction support aggregate demand.
  • Housing and non-residential construction: new builds and retrofit cycles translate into ongoing consumption of aggregates.
  • Replacement of aging infrastructure: “rehabilitation” demand can be less discretionary than new development and supports multi-year volume baselines.
  • Constrained incremental supply: permitting timelines and reserve depletion risk make new capacity additions slower than demand cycles, supporting pricing power when demand improves.
  • Regional market focus: capital allocation to high-quality reserves and logistical coverage can improve utilization and reduce delivered-cost disadvantage versus farther competitors.

⚠ Risk Factors to Monitor

  • Construction-cycle volatility: aggregates demand tracks broader construction activity; pricing and volumes can move with economic conditions.
  • Environmental and permitting risk: quarry operations face air quality, water management, reclamation, and local land-use constraints; adverse changes can restrict capacity or increase cost.
  • Resource/reserve management: maintaining reserve life and replacing depleted material with sufficient quality is capital intensive and operationally complex.
  • Cost inflation and labor availability: energy, diesel, maintenance, and labor can compress margins if pricing does not offset cost increases.
  • Competition and capacity rationalization: regional competitors may add or idle capacity, affecting price discipline and utilization.
  • Logistics and operational execution: disruptions in transportation routes, permitting milestones, or plant reliability can impact delivered service and costs.

📊 Valuation & Market View

Equity valuation in construction materials typically centers on earnings power through cycles rather than purely current-period earnings, because demand and pricing are cyclical. Investors often reference multiples such as EV/EBITDA alongside discounted cash flow frameworks that incorporate:

  • Pricing versus cost trends (ability to protect margin through spreads)
  • Utilization and operating leverage (fixed-cost absorption)
  • Capex discipline and reserve replacement (quality and sustainability of future production)
  • Regional market tightness (delivered-cost competitiveness)

The valuation “needle movers” are generally the durability of regional pricing, evidence of efficient cost structure, and progress on maintaining permitted supply to meet demand without overextending capital.

🔍 Investment Takeaway

Vulcan Materials’ core investment case rests on regional, logistics-driven economics: proximity to quarry reserves and permitted operating capacity that reduces delivered cost in customer markets. While the end market remains cyclical, structural constraints on new supply and the practical switching cost created by haul distance support a resilient business model for generating cash flow over a multi-year horizon.


⚠ AI-generated — informational only. Validate using filings before investing.

📊 AI Financial Analysis

Powered by StockMarketInfo
Earnings Data: Q Ending 2026-03-31

"Vulcan Materials (VMC) reported Q1’26 revenue of $1.76B, up 7.4% QoQ from Q4’25 ($1.91B down QoQ) and up 7.4% YoY from Q1’25 ($1.63B). Net income was $165.5M, down 34.3% QoQ from $252.0M in Q4’25, but up 28.4% YoY from $128.9M in Q1’25. EPS was not provided for Q1’26 in the dataset (prior-year Q1’25 diluted EPS: $0.97; Q4’25 diluted EPS: $1.91). Profitability mixed: gross margin declined to 24.1% from 25.5% in Q4’25 and from 22.3% in Q1’25; operating margin fell to 15.1% from 18.3% QoQ, though it remained higher than Q1’25 (13.9%). Operating income dropped to $265.4M QoQ, consistent with lower earnings despite YoY growth. Cash flow quality remains solid: operating cash flow was $241.1M in Q1’26, down from $543.0M QoQ, but still supported by positive net income; free cash flow was $64.6M after $176.5M capex. Shareholder returns are positive on momentum: the stock is up 21.27% over 1 year and VMC continues repurchasing ($149.5M in Q1’26) while paying dividends ($67.9M). Balance sheet resilience is supported by high equity (~$8.5B) and total assets of $16.7B; leverage is moderate with net debt of ~$4.95B."

Revenue Growth

Neutral

Revenue was $1.76B in Q1’26, down 8.2% QoQ vs. Q4’25 ($1.91B) and up 7.4% YoY vs. Q1’25 ($1.63B), indicating YoY improvement but seasonal/QoQ softness.

Profitability

Neutral

Net income fell 34.3% QoQ ($165.5M vs. $252.0M) but rose 28.4% YoY ($128.9M). Margins contracted QoQ (operating margin 15.1% vs. 18.3%) while remaining above Q1’25 (13.9%), reflecting mixed momentum.

Cash Flow Quality

Positive

Operating cash flow was $241.1M vs. $543.0M QoQ; free cash flow was $64.6M. Continued dividends ($67.9M) and meaningful repurchases ($149.5M) support returns, though QoQ cash generation softened.

Leverage & Balance Sheet

Positive

Total assets were ~$16.7B with equity stable around ~$8.5B. Leverage remains manageable (net debt ~$4.95B). Despite higher short-term debt vs. Q4, overall balance sheet looks resilient.

Shareholder Returns

Good

1-year price momentum is strong (+21.27%), which materially boosts total return. Company also returned cash via buybacks ($149.5M) and dividends ($67.9M). Dividend yield in the dataset is low but payout is supported by ongoing cash generation.

Analyst Sentiment & Valuation

Neutral

Consensus target ~$321.43 vs. price $291.71 implies upside (~10%). However, valuation multiples appear elevated in the provided ratios (e.g., price-to-sales), suggesting expectations are already somewhat high.

Disclaimer:This analysis is AI-generated for informational purposes only. Accuracy is not guaranteed and this does not constitute financial advice.

Fundamentals Overview

Loading fundamentals overview...

Vulcan delivered a strong Q1 with adjusted EBITDA of $447M (+9% YoY) and clear margin compounding supported by disciplined cost control (SAG down 2% YoY; T12M SAG down 20 bps to 7% of revenue). The key operating proof points were shipments up 5% YoY and freight-adjusted price up 4% YoY, aided by January 1 price increases and faster backlog conversion in data centers—supported by more normalized weather. Management’s core risk discussion centered on diesel. They quantified a Q2 diesel squeeze of about $25M, with cash cost pressure potentially rising into a high-single-digit YoY range including diesel, while emphasizing mitigation via surcharges downstream, stripping flexibility, and plant yield/fuel efficiency. Full-year adjusted EBITDA guidance of $2.4B–$2.6B was reiterated, with costs expected higher in H1 and moderating in H2. Public infrastructure demand remains a durable tailwind (high double-digit award growth), while residential weakness persists.

AI IconGrowth Catalysts

  • January 1 price increases compounding across the footprint; sequential growth vs prior quarter attributed to pricing actions
  • Data center backlog converting faster into shipments (rapid starts/speed to market); more normalized weather supporting backlog-to-ship conversion
  • Public infrastructure demand tailwind: trailing 12-month highway awards +12% YoY and public infrastructure awards +17% YoY (outpacing U.S.)
  • Energy build-out projects tied to data center power needs beginning to book/quote

Business Development

  • Expect several bolt-on acquisitions to finalize in coming months (aggregate-led expansion, primarily within/around advantaged regions)
  • Announced divestiture of California concrete assets expected to close in Q2 2026
  • Greenfield/new capacity investments: new quarry site in South Texas; rail distribution properties in key markets; new production facilities in Arizona and South Carolina
  • Large-project siting strength: 60% of large projects (public + private) within 50 miles of a Vulcan facility

AI IconFinancial Highlights

  • Adjusted EBITDA: $447M, up 9% YoY
  • Cash gross profit per ton (T12M): $11.38/ton; company aligned to drive to $20/ton
  • Gross profit margin expanded in each segment; SAG expenses lower YoY and supported margin expansion
  • Aggregate shipments +5% YoY, attributed to improving demand and fewer extreme weather days
  • Freight-adjusted aggregates price +4% YoY (mix aided; shift toward base products; data centers + more public work in backlog)
  • Aggregates freight-adjusted unit cash cost of sales +4% YoY; better weather enabled more stripping/project progress vs Q1 prior year
  • SAG expenses: -2% YoY in Q1; T12M SAG = 7% of revenue, down 20 bps YoY
  • Trailing 12-month ROIC improved +30 bps to 16% at quarter end
  • Capital structure: total debt $4.6B at quarter end, ~$350M lower than a year ago; net debt/Adj. EBITDA leverage 1.9x
  • Full-year guidance reiterated: adjusted EBITDA $2.4B to $2.6B

AI IconCapital Funding

  • Capital returns over last 12 months: >$800M total; $262M dividends and $550M share repurchases
  • Share repurchases during the quarter: $149M
  • T12M capital expenditures: $686M; ~70% fixed plant/mobile equipment/land, ~30% greenfield/other growth projects
  • Balance sheet described as positioned for active acquisition pipeline

AI IconStrategy & Ops

  • Automation/process intelligence (referenced as [VWO]/bulk wave operating) used to improve yield and reduce effective fuel usage; plant efficiency highlighted as offsetting inflation
  • Diesel-related operational flexibility: stripping timing adjustable (push/pull) rather than just-in-time; ability to delay/accelerate stripping and project work depending on diesel environment
  • Plant load-out efficiency: at some plants, operators reduce idling (turn off engines) during loading/rail activities
  • Pricing cadence: midyear increases sent to all markets several weeks earlier than prior year; expectation that pricing trajectory is more back-half loaded
  • Downstream pricing measurement: management reports freight-adjusted pricing; surcharges do not get reported as part of reported pricing

AI IconMarket Outlook

  • Full-year adjusted EBITDA guidance reiterated at $2.4B–$2.6B
  • Company expects costs to be higher in first half and moderate in second half as diesel squeeze passes
  • Legislative timing: expects federal highway reauthorization process with Transportation Committee first reading mid-May; potential bill completion by midterms considered but continuing resolutions likely path

AI IconRisks & Headwinds

  • Diesel volatility: Q2 expected to feel squeeze more acutely; diesel impact could drive cash cost of sales YoY toward high-single-digit range (excluding diesel, Q2 cash cost expected similar to Q1 YoY)
  • Energy input costs including liquid asphalt impacts (though ~1/3 work is indexed, reducing exposure)
  • Residential construction affordability continues to pressure; multifamily green shoots noted but residential remains headwind
  • Geopolitical uncertainty referenced as dynamic macro risk
  • Timing risk for infrastructure funding transition: mitigation relies on visibility and smooth IIJA-to-reauthorization transition; continuing resolutions could extend but management expects dollars kept at same levels

Q&A: Analyst Interest

  • Topic: Diesel drag quantification and how it fits full-year margin outlook: Management separated diesel price vs usage, emphasized downstream delivery covered by surcharges, and described operational levers (stripping timing, yield/process intelligence, reduced idling). Q2 diesel squeeze modeled at ~$25M and expected to moderate in the second half.
  • Topic: Midyear pricing magnitude, surcharge treatment in reported pricing, and cost growth framework: Management said surcharges don’t flow into reported freight-adjusted price because they measure differently. They reiterated midyear pricing was sent across all markets earlier than last year, expecting more acceleration in back half. Cost guidance held to low single digits; diesel development drives the path.
  • Topic: Federal highway bill reauthorization timing and funding-size credibility: Management cited Transportation Committee progress and expected first reading mid-May, described negotiations and committee complexity through Senate, and noted momentum in starts/backlog. They referenced ranges discussed by analysts and expressed confidence the bill won’t go backward, likely higher than prior funding levels.

Sentiment: POSITIVE

Note: This summary was synthesized by AI from the VMC Q1 2026 earnings transcript. Financial data is complex; please verify all metrics against official SEC filings before making investment decisions.

Loading financial data and tables...
© 2026 Stock Market Info — Vulcan Materials Company (VMC) Financial Profile