Block, Inc.

Block, Inc. (XYZ) Market Cap

Block, Inc. has a market capitalization of $40.56B.

Price: $68.15

-2.74 (-3.87%)

Market Cap: 40.56B

NYSE · time unavailable

CEO: Jack Dorsey

Sector: Technology

Industry: Software - Infrastructure

IPO Date: 2015-11-19

Website: https://www.block.xyz

Block, Inc. (XYZ) - Company Information

Market Cap: 40.56B|Sector: Technology

Company Profile

Block, Inc., together with its subsidiaries, creates tools that enables sellers to accept card payments and provides reporting and analytics, and next-day settlement. It provides hardware products, including Magstripe reader, which enables swiped transactions of magnetic stripe cards; Contactless and chip reader that accepts Europay, MasterCard, and Visa (EMV) chip cards and Near Field Communication payments; Square Stand, which enables an iPad to be used as a payment terminal or full point of sale solution; Square Register that combines its hardware, point-of-sale software, and payments technology; Square Terminal, a payments device and receipt printer to replace traditional keypad terminals, which accepts tap, dip, and swipe payments. The company also offers various software products, including Square Point of Sale; Square Appointments; Square for Retail; Square for Restaurants; Square Online and Square Online Checkout; Square Invoices; Square Virtual Terminal; Square Team Management; Square Contracts; Square Loyalty, Marketing, and Gift Cards; and Square Dashboard. In addition, it offers a developer platform, which includes application programming interfaces and software development kits. Further, the company provides Cash App, which enables to send, spend, and store money; and Weebly that offers customers website hosting and domain name registration solutions. It serves in the United States, Canada, Japan, Australia, Ireland, France, Spain, and the United Kingdom. The company was formerly known as Square, Inc. and changed its name to Block, Inc. in December 2021. Block, Inc. was incorporated in 2009 and is based in San Francisco, California.

Analyst Sentiment

79%
Strong Buy

From 45 Active Polls

1Y Forecast: $84.50

▲ +24.0% Potential Upside

Consensus Target Metrics

Low Bound

$74

Median

$84

High Bound

$98

Average

$85

Price & Moving Averages

Loading chart...

🎯 Wall Street Analyst Intelligence Report

1-Year structural target targets, chart projections, and sentiment maps.

Average 1Y Target
$84.50
▲ +23.99% Upside
Low Target
$74.00
9% Risk
Median Target
$84.00
23% Mid
High Target
$98.00
44% Max
Consensus
Buy
25 / 35 Buys

Consensus Trend Projection

Trailing closures vs. 12-month metrics map.

Analyst Vote Distribution

Aggregate institutional coverage sentiment weights.

📊 Historical Valuation Multiples

Real-time Trailing Twelve Month (TTM) momentum side-by-side with discrete quarterly metrics.

Fiscal QuarterTTMQ1 2026Q4 2025Q3 2025Q2 2025Q1 2025Q4 2024Q3 2024Q2 2024
Period EndingTrailing 12MMar 31, 2026Dec 31, 2025Sep 30, 2025Jun 30, 2025Mar 31, 2025Dec 31, 2024Sep 30, 2024Jun 30, 2024
Market Cap ($M)40,56235,96339,85144,09941,63333,65054,22041,38139,432
Enterprise Value ($M)35,89531,29737,48139,06136,43427,35849,88036,55635,451
Price to Earnings Ratio (P/E)50.46-29.1386.0623.8919.3344.316.9736.4650.48
Price/Earnings-to-Growth Ratio (PEG)38.2723.913.957.3315.16
Price to Sales Ratio (P/S)1.665.946.377.216.885.838.996.926.41
Price to Book Ratio (P/B)1.881.661.791.961.881.572.552.082.04
Price to Free Cash Flow Ratio (P/FCF)12.4538.4668.7331.49121.37331.68-4109.7365.8881.97
Enterprise Value to Sales (EV/Sales)5.175.996.396.024.748.276.125.76
Enterprise Value to EBITDA (EV/EBITDA)13.89-128.5834.3445.1641.8482.10143.9560.1559.55
Debt to Equity Ratio-1.810.370.400.360.280.280.370.370.38

XYZ Growth Runway Model

Standard long term linear growth fade

Multi-Stage Discounted Cash Flow Sandbox

Market Price$68.15
Intrinsic Value$95.24
Market Alignment
Undervalued by 39.7%relative to calculated intrinsic value
9.00%
Exp: 0%0%
i

Growth runway slowdown

This value provides a time window for the growth rate to decline beyond Stage 1 toward the terminal rate. Longer windows are most useful for companies with high growth starting conditions or strong competitive advantages. This option stretches out the growth rate slowdown across 5, 10, or 15-year steps. A high-growth starting condition (exceeding a 25% initial growth rate) automatically applies a curve decay to simulate realistic, rapid market saturation.
i

Terminal growth rate

With long-term inflation between 3-5%, revenue must grow by that baseline to maintain flat real-world market share. This value sets the permanent terminal growth rate to factor into the valuation beyond the growth slowdown runway toward maturity.

3-Stage Financial Runway Horizon

🧠 Perpetuity Horizon Engine (Stage 3: Post-2035)

Terminal FCF Base$3.45B
Perpetuity TV Value$64.96B
Discounted TV (PV)$27.44B
TV Weighting %57.9%
⚠️
Financial Model Disclaimer & Risk Disclosure: This interactive scenario simulator is an educational sandbox provided strictly for informational and analytical research purposes. Core historical financial statements and consensus estimates are sourced directly via Financial Modeling Prep (FMP). All downstream outputs are entirely deterministic, hypothetical projections generated by combining automated mathematical formulas (including linear interpolation and Gaussian bell-curve decay models) with user-selected variables and third-party financial data inputs. Users assume all liability for trading decisions executed based on these sandbox calculations.

📘 Full Research Report

ℹ️

AI-Generated Research: This report is for informational purposes only.

📘 BLOCK INC CLASS A (XYZ) — Investment Overview

🧩 Business Model Overview

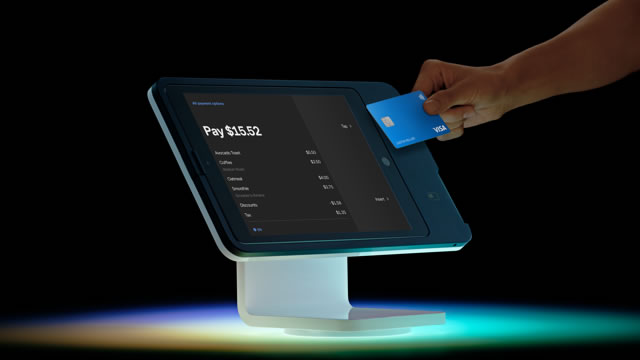
Block operates a vertically integrated payments and commerce stack that connects merchants and consumers through software, financing, and cash movement. On the merchant side, Block provides point-of-sale (POS) hardware and integrated payment processing, software tools, and business services that support everyday transaction workflows. On the consumer side, Cash App enables peer-to-peer transfers and digital payments, with additional financial services embedded into the app experience.

This structure matters because the product is not just a payment pipe; it is an operating layer. Merchant onboarding and ongoing service usage generate data about payment acceptance, customer interactions, and operational performance, while consumer activity feeds engagement and payment volume. The two sides reinforce the ecosystem through shared network participation and the ability to cross-sell additional services.

💰 Revenue Streams & Monetisation Model

Monetisation is driven primarily by (1) payment processing revenue tied to transaction activity, (2) service and subscription-like revenue from merchant and platform offerings, and (3) financial services revenue linked to account activity, spreads/fees, and other monetisation streams. A meaningful portion of the earnings power is tied to payment take rates and the ability to scale transaction volumes without proportionate increases in operating costs.

Margin drivers are typically a function of: payment network economics (volume and mix), operational leverage in compliance and risk operations, and the economics of value-added services (where revenue is less directly tied to raw transaction count). Where Block provides additional financial products, net profitability depends on underwriting discipline, fraud controls, and cost of risk.

🧠 Competitive Advantages & Market Positioning

Core moat: Switching costs and data/operational gravity created by an integrated payments-and-commerce ecosystem.

Block’s advantage is the friction and operational learning embedded in merchant workflows and consumer account usage. Once a merchant integrates Block’s POS and processing stack, migration entails reconfiguring payment acceptance, software tools, and operational routines. For consumers, engagement within Cash App builds behavioral and transactional history that supports continued usage of payments and related services.

Competitive benchmarking: Key competitors include PayPal, Stripe, and Adyen.

  • PayPal tends to emphasize consumer-centric reach and checkout/online payment penetration, often relying on broader partnerships rather than a tightly integrated merchant hardware-software operating layer.
  • Stripe is frequently positioned around developer tools and scalable online payment infrastructure, with less direct emphasis on a unified in-person POS-to-financial-services workflow for smaller merchants.
  • Adyen skews toward larger enterprises and global acceptance, where implementation depth and enterprise procurement cycles can reduce switch velocity.

Block’s positioning centers on delivering a compact, integrated system for smaller merchants and everyday consumer activity. This focus supports customer stickiness through workflow integration and ongoing service utility, rather than relying solely on price competition.

🚀 Multi-Year Growth Drivers

  • Digitisation of commerce for small merchants: Continued shift from cash and legacy terminals toward integrated payment acceptance and merchant management tools.
  • Engagement growth through embedded financial services: Expansion of consumer utility within Cash App beyond transfers into broader payment and financial features, subject to product-market fit and risk controls.
  • Category expansion within payments: Growth in offline-to-online commerce patterns and omnichannel acceptance increases demand for unified payment and software stacks.
  • Cross-sell and ecosystem monetisation: Merchant adoption can increase transaction frequency and acceptance breadth, supporting additional services; consumer activity can drive payment throughput and conversion into higher-value use cases.
  • Operational leverage as scale increases: Payment and compliance operations tend to benefit from scale efficiencies, which can improve unit economics as volume grows.

⚠ Risk Factors to Monitor

  • Regulatory and compliance risk: Money transmission, consumer protection, KYC/AML expectations, and evolving requirements can increase costs and constrain product scope.
  • Credit and fraud risk in financial services: Loss rates, chargebacks, underwriting performance, and fraud controls can materially affect profitability if product participation broadens without commensurate risk management.
  • Competitive intensity and pricing pressure: Large payments platforms can compress take rates through scale and distribution advantages.
  • Technological disruption and security risk: Payments infrastructure and app ecosystems require continuous investment in reliability, latency, cybersecurity, and fraud prevention.
  • Concentration in transaction activity: Revenue tied to payment volumes is sensitive to commerce activity and product mix shifts.
  • Hardware lifecycle risk (merchant POS): Product refresh cycles and customer device strategy can influence net revenue and margins.

📊 Valuation & Market View

Markets typically value payment and fintech platforms using a blend of revenue multiple approaches (often P/S), cash-flow-based frameworks (EV/EBITDA), and operating metric durability. For Block, valuation sensitivity tends to track indicators such as payment volume growth, net revenue per active user/merchant, mix of higher-margin services, and the trajectory of operating leverage. Where financial services contribute earnings, underwriting performance and loss rates can dominate fundamental reassessment.

The key “needle movers” usually include: (1) sustainable take-rate or fee economics through mix improvement, (2) reduced volatility in risk-adjusted returns, and (3) evidence that ecosystem engagement translates into durable monetisation rather than one-off transaction surges.

🔍 Investment Takeaway

Block’s long-term thesis rests on an integrated payments-and-commerce ecosystem that creates switching costs for merchants and behavioral/data gravity for consumers. With growth anchored in the digitisation of small-business commerce and expansion of embedded financial services, Block can scale transaction throughput while pursuing operating leverage—provided regulatory, credit, and fraud risks remain well-managed in a competitive payments landscape.


⚠ AI-generated — informational only. Validate using filings before investing.

📰 Market News & Coverage

15 Stories Available

Real-time institutional reporting and market updates for XYZ.

zacks.com2026-06-05

Block's Cash App Unveils NFC-Powered Tags for Faster Payments

XYZ launches NFC-enabled Cash App Tags, starting with the Cash App Wand, and lets users tap to pay while blending payments with style.

pymnts.com2026-06-04

Cash App Turns Everyday Accessories Into Payment Tools

Cash App users can now pay by tapping with a wand. The Cash App Wand is a pearlescent physical payment accessory that is the first example of a new payment form factor called Cash App Tags, the company said in a Thursday (June 4) press release.

businesswire.com2026-06-04

Introducing Cash App Tags1: A New Way to Pay

DISTRIBUTED-WORK-MODEL/OAKLAND, Calif.--(BUSINESS WIRE)--Today, Cash App is launching a new payment form factor that's changing the shape of money. Cash App Tags are NFC-enabled, physical payment accessories that let customers pay without having to reach for their phone or card. The first-edition Cash App Tag—the pearlescent Cash App Wand—is now available for Cash App Card holders to purchase in the app, while supplies last. Designed to match the way Gen Z expresses their style and identity, th.

zacks.com2026-06-04

Block's Square Strengthens Restaurant Presence With Baker St Cafe

XYZ's Square expands its Baker St Cafe partnership, adding marketing, analytics and kiosk tools that boost engagement, streamline operations and growth.

zacks.com2026-06-03

Block's Cash App Adds Afterpay BNPL: Will This Drive User Engagement?

XYZ expands BNPL access as Afterpay arrives on Cash App Card, letting eligible users split everyday expenses with transparent six-week repayments.

businesswire.com2026-06-03

Baker St Cafe Builds a Neighborhood Favorite on Square

DISTRIBUTED-WORKFORCE/OAKLAND, Calif.--(BUSINESS WIRE)--Square today announced that Baker St Cafe - Thai Kitchen & Bubble Tea, a family-run restaurant in McMinnville, Oregon, is utilizing Square's unified commerce platform to power its standing as one of the town's most beloved dining destinations. In the two years since its founding, Baker St Cafe has established a strong local reputation enabling it to serve 1 in 7 residents* of McMinnville, and secured the Thai SELECT certification, a di.

zacks.com2026-06-02

Why Block (XYZ) is a Top Stock for the Long-Term

Wondering how to pick strong, market-beating stocks for your investment portfolio? Look no further than the Zacks Focus List.

businesswire.com2026-06-02

As BNPL Goes Mainstream, Cash App and Afterpay Brings Pay-Over-Time to Every Purchase, Where Visa is Accepted

DISTRIBUTED-WORK-MODEL/OAKLAND, Calif.--(BUSINESS WIRE)--Cash App today announced the general availability of Afterpay on Cash App Card, bringing Buy Now, Pay Later to eligible Cash App Card customers.1 The launch marks the full commercial realization of a product built for a new kind of American earner: one whose income doesn't arrive on a fixed schedule, whose financial needs extend well beyond a merchant's checkout, and who has long been underserved by a traditional financial system that was.

zacks.com2026-06-01

Block (XYZ) Now Trades Above Golden Cross: Time to Buy?

Block, Inc. (XYZ) is looking like an interesting pick from a technical perspective, as the company reached a key level of support. Recently, XYZ's 50-day simple moving average crossed above its 200-day simple moving average, known as a "golden cross.

zacks.com2026-06-01

Why Block (XYZ) is a Top Momentum Stock for the Long-Term

Wondering how to pick strong, market-beating stocks for your investment portfolio? Look no further than the Zacks Style Scores.

zacks.com2026-06-01

4 Relative Price Strength Stocks to Buy as Markets Hit Record

PGY, MOV, YPF and XYZ stand out on relative price strength as the S&P 500 hits records.

zacks.com2026-05-29

Block's Cash App: Can Banking Engagement Keep Scaling?

XYZ's Cash App banking push pays off as PBAs, inflows and lending rise, deepening engagement across its financial ecosystem.

zacks.com2026-05-28

Block vs. Upstart: Which Is the Better Fintech Stock to Consider?

XYZ's Cash App and Square fuel strong growth, while UPST's AI-driven lending and rapid loan expansion intensify the fintech battle.

pymnts.com2026-05-28

Cash App Rolls Out Stablecoin Payments

Cash App is rolling out its stablecoin payment feature. “Stablecoin send and receive is now available for all eligible customers on Cash App,” the Block-owned company said in a Wednesday (May 27) press release.

gurufocus.com2026-05-27

A Look at Block Inc (XYZ) After 3.2% Gain -- GF Value $74.92 vs Price $71.42

On May 27, 2026, Block Inc (XYZ) shares rose 3.2% today to a price of $71.42. This price is situated within a 52-week range of $48.21 to $82.50, reflecting a si

📊 AI Financial Analysis

Powered by StockMarketInfo
Earnings Data: Q Ending 2026-03-31

"XYZ reported Q1 2026 results with revenue of $6.06B and net income of -$309M (EPS -$0.52). On a YoY basis (vs. Q1 2025), revenue increased by 4.97% ($5.77B to $6.06B) while net income deteriorated sharply from +$189.9M to -$308.7M. QoQ (vs. Q4 2025), revenue decreased by -3.16% ($6.25B to $6.06B) and net income swung from +$114.3M to -$308.7M. Profitability contracted materially: gross margin rose (48.03% vs. 46.25% QoQ), but operating margin and net margin turned negative (operating margin -2.84% and net margin -5.10% in Q1 2026). Over the prior four quarters, the company moved from strong profitability (net margins of 3.29%–8.95% during 2025) to a clear loss regime in the most recent quarter, suggesting cost/other-line pressure or weaker operating leverage. Cash generation remained positive despite the loss: operating cash flow was +$966M and free cash flow was +$935M. The balance sheet shows equity of $21.7B and net cash (net debt of -$5.28B), improving liquidity versus prior quarters. Shareholder returns appear strong: the stock is up +32.58% over 1 year, which should materially boost total return; there is no dividend activity reported. Revenue and Earnings-based metrics were not applicable for this analysis due to the company's pre-revenue status. The evaluation focused on cash runway, burn rate, and market sentiment instead."

Revenue Growth

Neutral

Revenue grew +4.97% YoY (Q1 2025: $5.77B to Q1 2026: $6.06B) but declined -3.16% QoQ (Q4 2025: $6.25B to $6.06B).

Profitability

Neutral

Margins contracted sharply: net margin moved from +1.83% (Q4 2025) to -5.10% (Q1 2026). EPS fell from +0.18 in Q4 to -0.52 in Q1; operating margin turned negative (-2.84%).

Cash Flow Quality

Positive

Despite the net loss, operating cash flow was +$966M and free cash flow +$935M in Q1 2026. No dividends or buybacks were reported in the latest quarter.

Leverage & Balance Sheet

Positive

Liquidity is strong with net cash of about -$5.28B (i.e., net debt negative). Equity remains stable at ~$21.7B, and total assets are near $40.0B.

Shareholder Returns

Good

Total shareholder return momentum is positive: 1-year price change is +32.58%. Dividend yield is 0 per the provided ratios; buybacks not indicated in Q1 2026.

Analyst Sentiment & Valuation

Fair

Current price context (71.26) sits below the consensus target (83) and median (82), implying upside. However, the recent earnings deterioration increases uncertainty.

Disclaimer:This analysis is AI-generated for informational purposes only. Accuracy is not guaranteed and this does not constitute financial advice.

Fundamentals Overview

Loading fundamentals overview...

So what: XYZ delivered a strong Q1 and meaningfully improved its 2026 trajectory, with profitability compounding faster than gross profit. Gross profit rose 27% to $2.91B; adjusted operating income increased 56% to $728M (25% margin); and adjusted diluted EPS grew 52% to $0.85. Management attributed the outperformance to broad-based ecosystem strength: Cash App engagement improved (actives +4%, inflows per active +10%, primary banking actives +18%), while Square accelerated GPV (+13%) and sustained strong new volume added growth, including ISO ramping and Neighborhoods expansion. Guidance supports continued momentum: full-year gross profit of $12.33B (+19%, +1pp vs prior) and adjusted operating income of $3.34B (margin +1pp), with EPS of $3.85 (+62%). Near-term risks center on Borrow normalization, tougher FX/comparisons, and timing of one-time items, but management expects expanding margins in Q3/Q4.

AI IconGrowth Catalysts

  • Moneybot now live across Cash App; scaling Managerbot to >1 million sellers and on track to reach all Square sellers in June
  • Afterpay Pre-Purchase launched (Pay in 4 using Cash App Card); expanded BNPL into peer-to-peer and Cash App Pay
  • Cash App Score rolling out to improve underwriting visibility/actionability for customers (started rolling in the past week)
  • Square GPV growth acceleration to 13% (9% gross profit) with particularly strong food & beverage (21% YoY) and mid-market (22% YoY) growth
  • Neighborhoods expanded to sellers, reaching $320 million annualized GPV (+190% since December); April added more sellers than Square’s entire prior history
  • Increased AI-led development velocity: production code changes per engineer up >2.5x from January to April; non-engineer PRs up nearly 60% in April vs January

Business Development

  • Expansion of independent sales organization: >140 active ISO partners ramping quickly (Square)
  • Afterpay integration running inside Cash App ecosystem (post-purchase already live; pre-purchase launched; BNPL expanded across peer-to-peer and Cash App Pay)

AI IconFinancial Highlights

  • Exceeded guidance; raised full-year outlook
  • Gross profit: $2.91B (+27% YoY)
  • Adjusted operating income: $728M (+56% YoY), 25% margin
  • Adjusted EBITDA: $1B
  • Adjusted diluted EPS: $0.85 (+52% YoY)
  • Full-year 2026 gross profit guidance raised to $12.33B (+19% YoY), +1 percentage point vs prior expectations
  • Full-year 2026 adjusted operating income guidance $3.34B with margin expectations +1 percentage point vs prior guide
  • Full-year 2026 adjusted diluted EPS guidance raised to $3.85 (+62% YoY)
  • Q2 guidance: gross profit $3.04B (+20% YoY); adjusted operating income $740M (+35% YoY) with +2 points margin expansion YoY; adjusted diluted EPS $0.86 (+39% YoY)
  • Non-recurring items referenced to pacing/variance: lapping a network remediation payment in Q2 2025; expected one-time tariff refund related to Square hardware benefiting gross profit
  • Tax/interest expectations: mid-20% non-GAAP effective tax rate for Q2 and full-year 2026; Q2 interest expense $55M–$60M; full-year interest expense ~$200M–$210M

AI IconCapital Funding

    AI IconStrategy & Ops

    • Internal automation: intelligence tools improving company operations (velocity increasing, quality improving; more work becoming automated)
    • AI model activation strategy: proactive, action-oriented systems positioned as 'protectors' prompting action before small issues escalate
    • Organizational change effects: push toward flatter structure, higher autonomy/DRI; reduced red tape to increase shipping velocity
    • Agentic workflow tooling: Builderbot (internal tool enabling employees to build/fix features via Slack); expected pathway to customer-driven customization in interfaces
    • Product/engineering velocity drivers: AI tooling increasing PR volume and accelerating delivery while requiring improved review/merging into mainline

    AI IconMarket Outlook

    • Full-year 2026: exit at mid-teens gross profit growth rate (consistent with November Investor Day long-term guidance)
    • Remainder of 2026: low single-digit actives growth expectation for Cash App
    • Primary banking actives: year-over-year growth with slight sequential decline in Q2 vs Q1 (seasonality)
    • Square gross profit to grow roughly in line with GPV growth in the second half; gap between reported gross profit growth and GPV growth expected to narrow in Q2
    • NVA growth expected to contribute to GPV growth in 2026 despite tougher GPV comparisons and FX starting in Q2

    AI IconRisks & Headwinds

    • Cash App Borrow growth normalization expected after exceptional growth over the past year (explicitly mentioned as a Q2 trend and throughout remainder of year)
    • Tougher GPV comparisons and FX starting in Q2 could pressure year-over-year growth metrics
    • Potential timing noise from one-time items impacting gross profit growth directionally (network remediation payment lap; Square hardware tariff refund)

    Q&A: Analyst Interest

    • Key drivers behind the raise: Management tied the beat and outlook raise to broad-based ecosystem strength—Cash App actives/inflows per active/monetization, and Square GPV acceleration across food & beverage, mid-market, and international—plus improving net volume retention and continued NVA growth, while expecting expanding margins in Q3/Q4 despite higher go-to-market investment.
    • Reorg postmortem and proof points: Management said expectations for the reorg were extremely high and were met, emphasizing reliability and regulatory/trust commitments. Main operational friction came from higher PR volume and heavier review burden from AI-assisted coding, plus ongoing work toward a flatter organization for faster customer-linked decisions.
    • Cash App growth drivers for 2027–2028: Management emphasized Cash App’s network-driven long-term drivers (virality/interconnections and engagement) and specific integration levers: embedding lending into P2P and BNPL (including pre-purchase), integrating BNPL into Cash App Card and Cash App Pay via Commerce Enablement, and scaling Borrow limits through Cash App Green while maintaining discipline and responsible growth.

    Sentiment: POSITIVE

    Note: This summary was synthesized by AI from the XYZ Q1 2026 earnings transcript. Financial data is complex; please verify all metrics against official SEC filings before making investment decisions.

    📋 Official Regulatory 10-K / 10-Q SEC Filings

    Direct authenticated documentation links to audited SEC database reports for XYZ.

    SEC EDGAR Live Feed
    Loading financial data and tables...
    📁

    SEC Filings (XYZ)

    © 2026 Stock Market Info — Block, Inc. (XYZ) Financial Profile