Atlas Energy Solutions Inc.

Atlas Energy Solutions Inc. (AESI) Market Cap

Atlas Energy Solutions Inc. has a market capitalization of β€”.

No quote data available.

CEO: John G. Turner

Sector: Energy

Industry: Oil & Gas Equipment & Services

IPO Date: 2023-03-09

Website: https://atlas.energy

Atlas Energy Solutions Inc. (AESI) - Company Information

Market Cap: -|Sector: Energy

Company Profile

Atlas Energy Solutions Inc. provides proppant and logistics services to the oil and natural gas industry within the Permian Basin of West Texas and New Mexico. The company was founded in 2017 and is based in Austin, Texas.

Analyst Sentiment

62%
Buy

From 13 Active Polls

1Y Forecast: $20.33

β–² +0.0% Potential Upside

Consensus Target Metrics

Low Bound

$14

Median

$20

High Bound

$28

Average

$20

Price & Moving Averages

Loading chart...

🎯 Wall Street Analyst Intelligence Report

1-Year structural target targets, chart projections, and sentiment maps.

Average 1Y Target
$20.33
β–² +21.88% Upside
Low Target
$14.00
-16% Risk
Median Target
$19.50
17% Mid
High Target
$28.00
68% Max

Consensus Trend Projection

Trailing closures vs. 12-month metrics map.

Analyst Vote Distribution

Aggregate institutional coverage sentiment weights.

Sentiment volume allocation data unavailable.

Historical valuation matrix unavailable.

πŸ“˜ Full Research Report

ℹ️

AI-Generated Research: This report is for informational purposes only.

πŸ“˜ ATLAS ENERGY SOLUTIONS INC (AESI) β€” Investment Overview

🧩 Business Model Overview

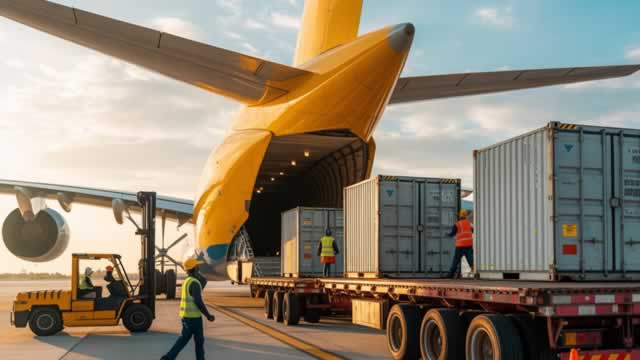
ATLAS ENERGY SOLUTIONS INC provides engineered midstream services primarily tied to natural gas infrastructure at the wellhead and gathering level. The company’s work centers on installing and operating compression and related solutions that keep gas moving through constrained take-away systems (pipelines, gathering systems, and processing plants). Revenue is generated by partnering with upstream producers to solve specific throughput and reliability needsβ€”effectively turning physical assets (compression fleets, service capabilities, and operating know-how) into contracted capacity and dependable service performance.

πŸ’° Revenue Streams & Monetisation Model

Monetisation typically reflects a blend of (i) capacity- and performance-linked service arrangements and (ii) recurring operational and maintenance activities that support uptime. Core margin drivers include:

  • Asset utilization: compressor and services economics are sensitive to equipment run-time and field demand for incremental capacity.
  • Contract structure: longer-tenured arrangements and defined performance requirements generally support more stable revenue visibility versus purely spot activity.
  • Unit cost discipline: labor, maintenance, and fuel/energy intensity per unit of throughput influence per-site contribution margins.
  • Lifecycle service capability: recurring maintenance, inspection, and reliability work can extend customer relationships beyond the initial deployment.

🧠 Competitive Advantages & Market Positioning

AESI’s defensibility is rooted less in pricing power from β€œbrands” and more in delivering reliable physical capacity where gas producers need it, with infrastructure and execution capability tailored to basin geography.

  • Geographic and operational cost advantage (logistical infrastructure): compression and field midstream solutions are location-dependent. Proximity to active production areas, established deployment playbooks, and the ability to mobilize equipment efficiently reduce total cost to serve versus less-footprinted competitors.
  • Customer stickiness via practical switching costs: once a producer’s facilities interface with a compressor configuration (integration, operating procedures, commissioning history, and performance tuning), replacing the provider is operationally costly and carries uptime risk.
  • Scale of the installed/served footprint: a larger, basin-relevant fleet and service organization supports better scheduling, maintenance planning, and service responsivenessβ€”raising the cost of under-investing competitors.

Competitive benchmarking:

Primary competitors in compression and related midstream services include Enerflex, Chart Industries, and GE Vernova / Baker Hughes (where they participate in gas compression and engineered solutions, including service offerings). Compared with these rivals, AESI’s positioning is oriented toward operational execution and field-level deployment in North American basins rather than broader equipment supply alone. Some competitors emphasize equipment manufacturing or broader industrial engineering platforms; AESI’s competitive edge tends to be tied to field reliability, rapid mobilization, and contracted service delivery around producer needs.

πŸš€ Multi-Year Growth Drivers

Over a 5–10 year horizon, demand for gas compression and related midstream services is supported by structural factors that keep incremental capacity needs elevated:

  • Continued basin production complexity: higher well counts, more variable flow regimes, and tighter scheduling requirements elevate the need for dependable compression and reliability services.
  • Pipeline and takeaway constraints: where gathering and transportation capacity lags production, compressors remain a practical lever to manage bottlenecks and support production continuity.
  • Gas-to-demand optionality: long-term power and industrial demand, plus LNG-related developments, can shift gas supply geography and increase pressure to move gas efficiently from producing regions to markets.
  • Methane regulation and operational standards: tighter compliance expectations can increase spending on infrastructure uptime, monitoring, maintenance discipline, and measurement-driven performance.

⚠ Risk Factors to Monitor

  • Capital intensity and utilization risk: compression services rely on maintaining fleet utilization; demand shocks in upstream activity can pressure margins.
  • Customer concentration and contract mix: revenue stability can vary with upstream operators’ capital budgets and the proportion of spot versus contracted work.
  • Commodity-linked drilling cycles: natural gas and associated liquids economics influence the pace of new drilling and related infrastructure spend.
  • Regulatory and environmental compliance: changes affecting emissions, permitting, or operating standards can increase costs or delay deployments.
  • Technological substitution: electrification, alternative compression technologies, or operational redesign by customers could reduce incremental service requirements in certain areas.

πŸ“Š Valuation & Market View

Equity markets typically value midstream and infrastructure-adjacent service models using EV/EBITDA and enterprise value versus operating cash flow frameworks, with emphasis on the sustainability of margins and cash conversion. Key value drivers include:

  • Utilization and backlog visibility: the market rewards predictable utilization and contracted work.
  • Operating leverage: incremental margins from deploying existing fleets and executing maintenance efficiently.
  • Capital discipline: the ability to grow without impairing returns via overbuild or structurally low-yield contracts.
  • Balance-sheet risk: debt levels and refinancing flexibility matter because the business remains exposed to activity cycles.

πŸ” Investment Takeaway

AESI offers an investment case centered on field-level natural gas compression and infrastructure services with defensibility driven by geographic/logistical execution, practical switching costs, and scale-supported reliability. Over the cycle, the primary question is not demand for gas infrastructure per se, but whether AESI can maintain utilization and cost discipline while sustaining contract quality and fleet efficiency.


⚠ AI-generated β€” informational only. Validate using filings before investing.

πŸ“Š AI Financial Analysis

Powered by StockMarketInfo
Earnings Data: Q Ending 2026-03-31

"AESI reported Q1’26 revenue of $265.6M and net income (loss) of -$47.3M (EPS -$0.38). Revenue declined -10.7% QoQ (vs. $297.6M in Q1’25) and -23.7% vs. prior quarter Q4’25 ($249.4M), while YoY revenue decreased -10.7% (Q1’26 vs Q1’25). Profitability deteriorated materially: gross margin contracted to ~2.4% from ~18.3% in Q1’25, and net margin swung from slightly positive (~0.4%) to deeply negative (-17.8%). Operating loss widened in Q1’26 (operating income -$32.5M) versus Q1’25 operating income +$15.3M. On cash flow, operating cash flow was +$19.0M and free cash flow was -$10.3M due to capex (-$29.3M). Balance sheet resilience remains mixed: total assets were $2.30B with equity at $1.17B, but leverage risk is elevated versus the prior year quarter through much higher long-term obligations (Q1’25: no long-term debt shown in the provided snapshot; Q4’25: long-term debt $538.2M). Dividend payments were $0 in Q1’26 (none reflected in Q4’25 either), and no buybacks were reported. Total shareholder returns look modest on price momentum: current price is $13.29 with 1y_change of -2.71% (below the >20% momentum threshold). Analyst targets cluster well above current levels (consensus $15.4). Overall, the stock appears to price in deterioration and the path to margin recovery is the key swing factor."

Revenue Growth

Caution

Q1’26 revenue was $265.6M, down -10.7% YoY (vs. $297.6M in Q1’25). QoQ comparisons show contraction versus Q4’25 ($249.4M) relative to the prior quarter trend level; revenue is not accelerating.

Profitability

Neutral

Margins collapsed: gross margin fell to ~2.4% in Q1’26 from ~18.3% in Q1’25 and operating/net margins turned sharply negative (net margin -17.8% vs +0.4% in Q1’25). EPS declined from +$0.01 to -$0.38.

Cash Flow Quality

Fair

Operating cash flow was positive (+$19.0M) in Q1’26, but free cash flow was negative (-$10.3M) due to capex. No dividends or buybacks were reported in Q1’26.

Leverage & Balance Sheet

Caution

Equity held at $1.17B with total assets of $2.30B. However, the provided balance snapshots show substantially higher debt/obligations versus earlier 2025 quarters, implying less balance-sheet cushion than at peak profitability.

Shareholder Returns

Neutral

Price performance is weak: 1y_change -2.71% (no strong >20% momentum boost). Dividend yield is 0% in the ratio data, and no buybacks are indicatedβ€”so total shareholder returns are likely dominated by price action.

Analyst Sentiment & Valuation

Neutral

Consensus price target ($15.4) sits above the current price ($13.29), with a wide range ($8–$28), suggesting upside optionality if profitability stabilizes.

Disclaimer:This analysis is AI-generated for informational purposes only. Accuracy is not guaranteed and this does not constitute financial advice.

Fundamentals Overview

Loading fundamentals overview...

Atlas delivered a Q1 normalization narrative: revenue of $265.5M and EBITDA of $28.4M (11% margin), but results were dragged by winter weather, elevated Kermit maintenance, and higher third-party logistics costs. Management expects margins to normalize from Q2 as headwinds roll off and volumes ramp, with logistics margins moving to mid-teens in Q2 after improving from low single digits to mid-teens by March. The core strategic inflection is Power: a Caterpillar global framework agreement secures 1.4 GW for 2027–2029 and complements a 240 MW order to position Atlas for >2 GW by 2030. The first 120 MW private grid PPA targets ~5-year initial term (plus extensions), with construction late 2026, commissioning in 1H 2027, and ~$50M–$55M annualized adjusted free cash flow when fully deployed. Q&A reinforced that data centers are emerging in their pipeline, sand capacity additions likely require $23–$25 pricing, and logistics remains supported by diesel-driven tightening, with >800 bps freight inflation vs 2025.

AI IconGrowth Catalysts

  • West Texas sand and logistics demand recovery: logistics margins expanded from low single digits (January) to mid-teens (March); mining operations effectively sold out for Q2
  • Power ramp driven by Caterpillar supply lock-in: global framework agreement covering 1.4 GW (delivery 2027-2029) plus initial 240 MW order supporting >2 GW owned/operated by 2030
  • Private grid PPA deployments: first private grid PPA at 120 MW starting construction late 2026 with commissioning targeted 1H 2027; ~$35M incremental adjusted EBITDA contribution expected over the remaining 9 months of 2026
  • Bridge power and microgrid execution: mobile generator bridge deployments plus other microgrid projects expected to add ~$35M incremental adjusted EBITDA over remaining 9 months of 2026

Business Development

  • Caterpillar: global framework agreement securing 1.4 GW of generation capacity for delivery between 2027 and 2029
  • Caterpillar: initial 240 MW power generation equipment order placed in November (basis for the 120 MW private grid deployment)
  • Customer/contract counterparties for private grid power: first private grid power purchase agreement for a 120 MW deployment (PPA customer referenced; not named)
  • Mobile generator bridge power deployments in support of construction/commissioning (customer not named)
  • Microgrid projects in commercial/industrial market (customer not named)

AI IconFinancial Highlights

  • Reported Q1 2026 revenue of $265.5M and EBITDA of $28.4M (11% EBITDA margin)
  • Headwinds impacting Q1: severe winter weather, elevated maintenance at Kermit facility, and higher third-party logistics costs (management expects normalization beginning Q2)
  • Per-ton proppant plant operating costs (incl. royalties) were ~$13.86 in Q1, up sequentially from Q4; primary driver was maintenance activity following the winter storm
  • Logistics profitability improvement: margins progressed from low single digits in January to mid-teens by March; Q2 forecast mid-teens logistics margins
  • Proppant pricing/volume: average sales price ~$18.19/ton in Q1 (excluding $1.9M shortfall revenue); Q2 APS expected slightly below $18/ton with sequentially higher volumes
  • Power cash flow outlook for 120 MW: expected annualized ~$50M to $55M adjusted free cash flow once fully deployed
  • EBITDA run-rate positioning: Q2 EBITDA guided to approximately $50M (incremental contributions from Power segment + bridge/microgrid ramp)

AI IconCapital Funding

  • Issued $450M 0.5% convertible senior notes due 2031
  • Concurrent capped call: cap price $22.32 per share; initial cap call premium 28% over prior closing price of $17.38
  • Used $386M of $450M net proceeds to pay down outstanding balance under ABL and outstanding advances under master lease agreement and interim funding agreement
  • Intends to use remaining net proceeds to finance the initial 240 MW order
  • On a cash coupon basis, transaction reduces cash interest expense of this quantum from high single digits to 0.5%

AI IconStrategy & Ops

  • Power strategy: full-scope PPAs where Atlas owns/operates complete solution including balance of plant (aimed at longer-term, higher-reliability contracting and competitor barriers from sump cost/complexity)
  • Capacity positioning: mining operations sold out for Q2 at current production rates; management expects additional sand sales later in 2026 at higher pricing if production increases or contracts roll
  • Sustaining investments: management emphasized continued investment in plants, logistics network, and last-mile equipment during the West Texas down cycle
  • Operational constraint: step-up in production would likely require incremental personnel not justified by current sand prices
  • Logistics supply chain dynamics: diesel price increases and third-party trucking rate spikes drove Q1 logistics cost pressure; improvement expected to persist as rates normalize and efficiencies improve

AI IconMarket Outlook

  • Q2 EBITDA expected to be approximately $50M
  • Q2: OpEx per ton forecast to climb to ~ $12.75 due to fixed cost absorption and improved production efficiency; continued improvement expected over remainder of year
  • 2026 CapEx guidance adjusted to approximately $350M to $375M (from prior plan implied by change); maintenance CapEx ~$45M; growth CapEx ~$305M to $330M largely dedicated to private grid power build-out
  • Effective sold out for Q2; visibility to second-half activity improving rapidly
  • Bridge + microgrids: expected to contribute ~$35M incremental adjusted EBITDA over remaining 9 months of 2026, weighted toward back half

AI IconRisks & Headwinds

  • Q1 2026 margin pressure from severe winter weather, elevated maintenance at Kermit facility, and higher third-party logistics costs (headwinds expected to roll off starting Q2)
  • Truck/logistics network fragility: tender rejection rates in March ~14% (seasonal dips reference), with freight holding >800 bps higher than 2025 levels
  • Diesel pass-through disputes: management cited anecdotes of some operators refusing full diesel pass-throughs, risking further trucking crunch
  • Tariff-driven equipment supply constraints: trailer manufacturing affected by Mexico tariffs cited as a driver of trailer lead-time shortages
  • Sand price discipline risk: management unlikely to add capacity until sand pricing reaches ~$23-$25 per ton to earn cost of capital; hyper-volatility can cause rapid undersupply/oversupply swings

Q&A: Analyst Interest

  • Power / target customers (data centers): Management said the Caterpillar global framework agreement expanded the opportunity set and changed customer conversations overnight, with reverse inquiries now occurring daily. They noted inbound queue growth to ~8–10 GW from ~4–4+ GW and initial inquiries shifting toward larger data center projects.
  • Sand pricing required to expand capacity: Management emphasized uncertainty around control of sand pricing in a hyper-volatile commodity. They stated incremental capacity adds are unlikely until sand pricing reaches roughly $23–$25 per ton (cost of capital threshold), and they only consider capacity when supply tightens enough to sustain those economics.
  • Logistics rates outlook / diesel and Permian vs national: Management explained Permian rates are still discounted vs typical 10%–20% premium required to incentivize hauling, with diesel as a key driver. They warned that limiting diesel pass-through forces trucking companies to park assets, tightening supply further and supporting margin recovery.

Sentiment: POSITIVE

Note: This summary was synthesized by AI from the AESI Q1 2026 earnings transcript. Financial data is complex; please verify all metrics against official SEC filings before making investment decisions.

πŸ“‹ Official Regulatory 10-K / 10-Q SEC Filings

Direct authenticated documentation links to audited SEC database reports for AESI.

SEC EDGAR Live Feed
Loading financial data and tables...
πŸ“

SEC Filings (AESI)

Β© 2026 Stock Market Info β€” Atlas Energy Solutions Inc. (AESI) Financial Profile