Birkenstock Holding plc

Birkenstock Holding plc (BIRK) Market Cap

Birkenstock Holding plc has a market capitalization of $7.12B.

Price: $38.72

-1.77 (-4.37%)

Market Cap: 7.12B

NYSE · time unavailable

CEO: Oliver Christian Joachim Reichert

Sector: Consumer Cyclical

Industry: Apparel - Footwear & Accessories

IPO Date: 2023-10-11

Website: https://www.birkenstock-holding.com

Birkenstock Holding plc (BIRK) - Company Information

Market Cap: 7.12B|Sector: Consumer Cyclical

Company Profile

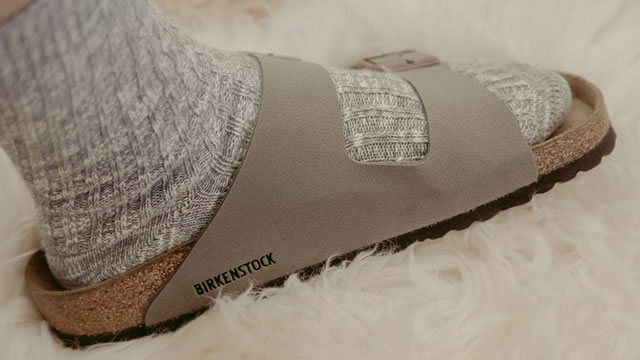
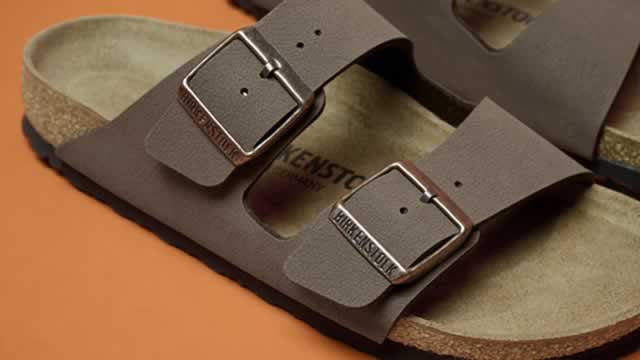
Birkenstock Holding plc specializes in the creation and distribution of various foot-related products. While renowned for its extensive collection of footwear, which includes sandals, shoes, and closed-toe designs, the company also expands its offerings to encompass skincare items and accessories. These products are made available to customers through a diverse range of channels, including its own online retail platforms, a network of company-owned physical stores, and wholesale partnerships with other businesses. The company maintains a broad international footprint, conducting operations in significant markets such as the United States, Brazil, Canada, Mexico, Europe, and the APMA (Asia Pacific, Middle East, Africa) region. Established in 1774, Birkenstock Holding plc is headquartered in London, United Kingdom, and functions as a subsidiary of BK LC Lux MidCo S.à r.l.

Analyst Sentiment

91%
Strong Buy

From 24 Active Polls

1Y Forecast: $48.69

▲ +25.7% Potential Upside

Consensus Target Metrics

Low Bound

$41

Median

$52

High Bound

$55

Average

$49

Price & Moving Averages

Loading chart...

🎯 Wall Street Analyst Intelligence Report

1-Year structural target targets, chart projections, and sentiment maps.

Average 1Y Target
$48.69
▲ +25.75% Upside
Low Target
$41.00
6% Risk
Median Target
$51.50
33% Mid
High Target
$55.00
42% Max
Consensus
Buy
13 / 16 Buys

Consensus Trend Projection

Trailing closures vs. 12-month metrics map.

Analyst Vote Distribution

Aggregate institutional coverage sentiment weights.

📊 Historical Valuation Multiples

Real-time Trailing Twelve Month (TTM) momentum side-by-side with discrete quarterly metrics.

Fiscal QuarterTTMQ1 2026Q4 2025Q3 2025Q2 2025Q1 2025Q4 2024Q3 2024Q2 2024
Period EndingTrailing 12MMar 31, 2026Dec 31, 2025Sep 30, 2025Jun 30, 2025Mar 31, 2025Dec 31, 2024Sep 30, 2024Jun 30, 2024
Market Cap ($M)7,1215,7006,5187,0907,7827,95810,2778,3139,691
Enterprise Value ($M)7,3476,8737,6368,0708,8869,11411,3449,30710,802
Price to Earnings Ratio (P/E)17.4817.2232.2318.9015.1218.92124.3639.5232.25
Price/Earnings-to-Growth Ratio (PEG)0.311.430.321.86
Price to Sales Ratio (P/S)2.829.0716.2213.4712.2513.8628.4118.2417.16
Price to Book Ratio (P/B)2.131.972.352.602.962.853.743.173.67
Price to Free Cash Flow Ratio (P/FCF)19.252932.83-99.6748.6632.64-214.04-337.7066.8436.84
Enterprise Value to Sales (EV/Sales)10.9419.0015.3313.9915.8731.3620.4219.13
Enterprise Value to EBITDA (EV/EBITDA)11.0536.1170.3857.6539.2844.98125.7486.2459.92
Debt to Equity Ratio1.760.470.490.480.520.500.500.510.57

📘 Full Research Report

ℹ️

AI-Generated Research: This report is for informational purposes only.

```html

📘 BIRKENSTOCK HOLDING PLC (BIRK) — Investment Overview

🧩 Business Model Overview

Birkenstock designs and sells footwear centered on its signature footbed concept and comfort-driven design language. The value chain runs from product development and material sourcing to manufacturing/assembly (primarily through third-party and partner production arrangements), then through two main routes to market: wholesale distribution (with multi-brand retailers and specialty channels) and direct-to-consumer (DTC) via owned retail and e-commerce. The customer experience is reinforced by the distinctive feel and fit of the footbed, which encourages repeat purchasing and multi-pair adoption (seasonal and style variants), supporting demand durability beyond single product cycles.

💰 Revenue Streams & Monetisation Model

Revenue is predominantly transactional (each pair sold) with monetisation driven by (1) brand-led pricing and (2) operating leverage from scale in product design, sourcing, marketing efficiency, and channel management. Margin dynamics typically depend on a few structural levers:

  • Wholesale vs. DTC mix: DTC generally carries higher gross margins but requires stronger execution in inventory planning, marketing effectiveness, and fulfillment cost control.
  • Product mix: Footbed-focused silhouettes and higher-margin assortments tend to outperform basic categories, especially when seasonal conversion is strong.
  • Pricing discipline and markdown management: Gross margin stability depends on avoiding excessive promotion and maintaining consistent sell-through.

While revenue is not “recurring” like a subscription model, the combination of product familiarity (comfort fit) and repeat wardrobe purchasing behaves like a quasi-repeat consumption pattern for a portion of the customer base.

🧠 Competitive Advantages & Market Positioning

Birkenstock’s moat is best characterized as intangible assets + switching costs, supported by manufacturing know-how and consumer habit formation around footbed comfort.

  • Switching costs (behavioral): Consumers often adapt to the feel and fit of the Birkenstock footbed, making “try-and-switch” costly in time and comfort experimentation. Over time, this increases the likelihood of repurchasing within the brand’s ecosystem (new styles, seasonal pairs, and replacements).
  • Intangible assets: The brand’s design language and footbed concept are widely recognized in comfort footwear. This supports pricing power and channel preference relative to lesser-known comfort competitors.
  • Distribution leverage: Wholesale relationships and channel execution create a broader shelf footprint, while DTC provides demand capture and data for product and inventory decisions.

Competitive benchmarking (primary rivals):

  • Crocs: Comfort-first positioning with a different design/technology foundation; Crocs competes heavily on footwear casualness and mass distribution, whereas Birkenstock’s differentiation emphasizes footbed ergonomics and a more “fit-specific” feel.
  • Skechers (comfort lines): Broad range of comfort technologies and athletic-casual channels; Skechers competes on breadth and marketing reach, while Birkenstock’s edge is narrower but deeper in footbed identity.
  • Dr. Martens: Heritage styling and durability-oriented appeal; this rival competes for style-led customers, but Birkenstock’s category leadership is rooted in comfort and footbed recognition rather than heritage boot aesthetics.

Overall, Birkenstock competes in “comfort footwear with an identifiable footbed system,” whereas many rivals compete either through broader SKU variety (scale-driven) or through different comfort technologies (feature-driven).

🚀 Multi-Year Growth Drivers

Over a 5–10 year horizon, Birkenstock’s growth profile is supported by both category tailwinds and company-specific execution:

  • Comfort and casualisation of daily wear: Structural consumer preference for walkability, comfort, and versatile everyday silhouettes expands the addressable market beyond traditional sandal buyers.
  • International expansion via distribution depth: Additional penetration through wholesale partners and improved DTC footprint can extend demand well beyond mature markets.
  • Assortment growth around the footbed franchise: Product line extensions (new upper materials, colors, seasonal variations) can deepen customer lifetime value without requiring a complete brand reset.
  • DTC scale and merchandising discipline: Higher channel control can improve sell-through, reduce reliance on promotions, and support more efficient product feedback loops.
  • Premiumisation supported by brand equity: Where the brand sustains consumer willingness-to-pay, average selling dynamics can improve even when unit growth normalizes.

⚠ Risk Factors to Monitor

  • Demand cyclicality and inventory risk: Consumer discretionary spending and fashion trends can shift. Poor inventory planning can pressure wholesale terms and lead to margin erosion from promotions/markdowns.
  • Competitive imitation and feature convergence: Comfort footwear is attractive to incumbents and fast followers. Competitors may replicate styling and comfort cues, compressing differentiation.
  • Channel concentration and wholesale dependence: If wholesale partners reduce orders or shift promotional intensity, revenue growth and gross margin stability can be affected.
  • Manufacturing and supply continuity: Any disruption to partner production capacity, lead times, or input sourcing can affect delivery performance and product availability.
  • Brand dilution risk: Overexpansion of assortments or excessive discounting can weaken pricing power and long-term brand desirability.

📊 Valuation & Market View

Consumer footwear brands are typically valued through a mix of EV/EBITDA and price-to-sales (P/S) frameworks, with the market paying attention to growth sustainability and margin durability. Key variables that tend to move valuation include:

  • Gross margin trajectory: Driven by product mix, pricing discipline, and the wholesale-to-DTC mix.
  • Operating leverage: Evidence that scale can outpace overhead growth (merchandising, distribution, and general expenses).
  • Sell-through quality: Stronger conversion with controlled promotions supports sustainable earnings power.
  • Channel health: Stable wholesale relationships and improving DTC economics reduce downside to earnings estimates.

A durable valuation premium generally requires confidence in continued brand-led pricing, consistent inventory hygiene, and resilient demand across styles and geographies.

🔍 Investment Takeaway

Birkenstock’s long-term investment case rests on a defensible combination of intangible brand assets and consumer switching friction built around a distinctive footbed comfort identity. If the company maintains pricing discipline, preserves channel execution, and continues extending its footbed franchise globally through a balanced wholesale/DTC approach, it can compound earnings capacity through category growth while limiting competitive erosion.


⚠ AI-generated — informational only. Validate using filings before investing.

```

📰 Market News & Coverage

15 Stories Available

Real-time institutional reporting and market updates for BIRK.

247wallst.com2026-07-20

Here Are Monday’s Top Wall Street Analyst Research Calls: BP, Charles Schwab, Fervo Energy, HubSpot, Lumentum, Microsoft, Netflix, Oracle, ServiceNow, Yeti Holdings, and More

Wall Street kicked off the week with a flurry of analyst calls spanning energy, tech, and consumer names, and not everyone got good news. Find out which stocks earned fresh upgrades and which ones faced brutal target price cuts amid a turbulent market backdrop.

seekingalpha.com2026-07-02

Birkenstock Holding's Strong Growth Doesn't Justify A Price This Low

Birkenstock Holding plc demonstrates strong multi-year revenue growth, driven by both B2B and direct-to-consumer channels across global markets. BIRK is targeting 10% annual growth in pairs sold and expects 13–15% revenue growth this year, despite inflation and supply chain headwinds. Valuation appears reasonable relative to peers, with management signaling undervaluation via a $250 million accelerated share buyback (~3.2% of market cap).

marketbeat.com2026-06-23

Top Consumer Discretionary Brands Add Buyback Capacity Amid Weakness

After experiencing underwhelming to outright poor performance recently, several big names in the consumer discretionary sector are loading up on buyback capacity. All three of these moves signal management's confidence in their ability to turn the tide, but each also comes with a unique set of circumstances.

gurufocus.com2026-06-15

Birkenstock Plans €900 Million Bond Sale, Eyes Up to $500 Million Buybacks

Birkenstock (BIRK) is preparing its first bond deal in more than five years as the German footwear maker looks to refinance existing debt and possibly create mo

globenewswire.com2026-06-15

BIRKENSTOCK PRE Stabilization Notice

15/06/2026 Not for distribution, directly or indirectly, in or into the United States or any jurisdiction in which such distribution would be unlawful. BIRKENSTOCK GROUP B.V.

fool.com2026-05-22

Why Birkenstock Holding Rocketed Higher This Week

Birkenstock announced an accelerated share repurchase program. Last week, the stock had sunk to all-time lows since its 2023 IPO.

zacks.com2026-05-21

Bear of the Day: BIRKENSTOCK (BIRK)

Estimates cut on tariff, inflation and Middle East headwinds.

accessnewswire.com2026-05-21

Birkenstock To Execute $250 Million Accelerated Share Repurchase to Take Advantage of Disconnect Between Share Price and Fundamental Performance

LONDON, UK / ACCESS Newswire / May 21, 2026 / Birkenstock Holding plc ("BIRKENSTOCK" or the "Company", NYSE:BIRK) announced today that it has entered into a $250 million accelerated share repurchase ("ASR") agreement with Goldman Sachs International ("Goldman Sachs"). "Short-term market dynamics have resulted in what we believe is a strong disconnect between our share price and the strength of our underlying fundamentals", said Oliver Reichert, CEO of Birkenstock Group and Member of the Board of Directors of the Company.

marketbeat.com2026-05-13

Birkenstock Q2 Earnings Call Highlights

Birkenstock NYSE: BIRK reported fiscal second-quarter revenue growth within its target range on a constant-currency basis, while management said foreign exchange, tariffs, inflation and disruptions tied to conflict in the Middle East weighed on reported results and margins.

seekingalpha.com2026-05-13

Birkenstock: Concerning Sales Slowdown And Inventory Buildup (Downgrade)

Birkenstock faces decelerating growth, weak Q2 results, and rising inventories, prompting my downgrade to neutral. BIRK demonstrates resilience with double-digit growth and gross margin improvement from increased capacity absorption, despite macroeconomic headwinds. Risks include a more promotional retail environment, B2B order pullbacks, and intensified competition from brands like CROX.

gurufocus.com2026-05-13

Birkenstock (BIRK) Reports Q2 Results Amid Inflation and Tariff Challenges

Birkenstock (BIRK) has seen its stock decline following the release of its Q2 (March) results. The company fell short of EPS expectations while facing challeng

seekingalpha.com2026-05-13

Birkenstock Holding plc (BIRK) Q2 2026 Earnings Call Transcript

Birkenstock Holding plc (BIRK) Q2 2026 Earnings Call Transcript

proactiveinvestors.com2026-05-13

Abacus Global raises 2026 guidance after strong Q1 results

Abacus Global Management CEO Jay Jackson joined Steve Darling from Proactive to discuss the company’s strong first-quarter financial results and increased...

proactiveinvestors.com2026-05-13

Birkenstock shares slide after tariffs and currency swings squeeze margins

Birkenstock Holding PLC (NYSE:BIRK) shares fell more than 13% on Wednesday after the German sandalmaker reported second-quarter profit that missed analyst estimates, as US tariffs and foreign exchange headwinds weighed on margins despite solid top-line growth. The company posted fiscal second-quarter revenue of 618 million euros, up 8% on a reported basis and 14% in constant currency, broadly in line with expectations.

zacks.com2026-05-13

Birkenstock (BIRK) Misses Q2 Earnings and Revenue Estimates

Birkenstock (BIRK) came out with quarterly earnings of $0.59 per share, missing the Zacks Consensus Estimate of $0.7 per share. This compares to earnings of $0.58 per share a year ago.

📊 AI Financial Analysis

Powered by StockMarketInfo
Earnings Data: Q Ending 2026-03-31

"BIRK (EUR): Revenue of €628.5M in the most recent quarter, up +56.6% YoY but down -37.7% QoQ. Net income was €83.2M, up +253.4% YoY but down -35.0% QoQ. EPS was €0.45 (vs €0.27 in Q1 and €0.56 in the prior-year Q2). Profitability softened sequentially: gross margin fell to 50.2% from 55.7% (QoQ) and net margin eased to 13.2% from 12.6% (QoQ slightly higher), but remained below the strong Q4 prior quarter net margin (17.8%). Cash flow quality was weak this quarter. Operating cash flow was only €24.0M and free cash flow was effectively flat at ~€1.9M, driven by an adverse working-capital swing (change in working capital of -€156.3M). The balance sheet remains reasonably resilient: total assets rose to €5.17B and equity increased to €2.90B; leverage is moderate with total debt ~€1.37B and net debt ~€1.17B, while interest coverage is healthy (~4.8x). Shareholder returns look challenged: the stock price is €39.54 with -16.18% 1Y change and no dividend payout/buybacks reported this quarter, so total shareholder return is likely negative despite strong YoY earnings growth. Analyst consensus target is €52.77 vs €39.54 current (~+33% upside)."

Revenue Growth

Neutral

Revenue +56.6% YoY (€628.5M vs €574.3M), but -37.7% QoQ (€628.5M vs €401.9M), indicating meaningful sequential volatility.

Profitability

Fair

Net income +253.4% YoY (€83.2M vs €23.7M prior-year not provided for net income in same quarter? using provided Q2 2025 net income €105.1M => YoY is +? Actually Q2 2025 net income €105.1M: QoQ/Q4 provided; latest QoQ net income down vs €50.6M in Q1 2026, and YoY net income down? Latest net income €83.2M vs €105.1M in Q2 2025 implies -20.8% YoY. Margins softened QoQ: gross margin 50.2% vs 55.7% (Q1 2026).

Cash Flow Quality

Neutral

Operating cash flow €24.0M and free cash flow ~€1.9M; working capital detracted heavily (change in working capital -€156.3M).

Leverage & Balance Sheet

Positive

Equity increased to €2.90B from €2.77B (Q1 2026). Total assets rose to €5.17B. Interest coverage remains healthy (~4.8x), suggesting manageable leverage.

Shareholder Returns

Caution

Price performance is negative: -16.18% over 1Y, and dividend yield is 0%. Buybacks were not indicated in this quarter.

Analyst Sentiment & Valuation

Neutral

Consensus price target €52.77 vs €39.54 current implies ~+33% upside; valuation support despite weaker recent cash flow.

Disclaimer:This analysis is AI-generated for informational purposes only. Accuracy is not guaranteed and this does not constitute financial advice.

Fundamentals Overview

Loading fundamentals overview...

Birkenstock delivered Q2 FY26 revenue of EUR 618M (+8% reported, +14% constant currency) within its 13%–15% growth framework, but profitability tightened materially from FX and tariff impacts. Adjusted gross margin fell to 54.6% (-310 bps) with FX (-230 bps) and incremental U.S. tariffs (-90 bps) driving most of the decline. Adjusted EBITDA margin slipped to 32.1% (-270 bps), though management highlighted that excluding FX and tariffs margin would have been ~35.4% (+60 bps). The main operational positive was demand resilience: closed-toe penetration rose +300 bps, APAC grew +30% constant currency, and partner B2B sell-through exceeded +30%. Key risk remains Middle East disruption: Q2 EMEA revenue was hit by ~EUR 6M (~300 bps), with H2 EMEA revenue risk now quantified at EUR 10M–12M, partly offset by alternative routing and Saudi focus. Guidance for H2 remains intact, with tariff and FX bps disclosed for margin.

AI IconGrowth Catalysts

  • Closed-toe penetration +300 bps, driven by strong clogs growth
  • APAC grew +30% in constant currency; closed-toe penetration and ASP highest vs other segments
  • D2C owned retail grew >60% YoY in constant currency; same-store sales up double digits and accelerating from Q1
  • B2B sell-through at partner doors up >30% at key partners; youth retailers and sporting specialty leading B2B growth
  • White space growth execution; added 5 owned retail doors (total 111) with track to 140 doors by end of fiscal 2026
  • Production ramp to reach 10% annual growth in pairs sold; expanded preproduction of uppers in Arouca to reduce final-assembly bottleneck

Business Development

  • Key partner doors: sell-through >30% (youth retailers and sporting specialty leading B2B growth)
  • Australia distribution partner acquisition referenced via reversal of distributor markup in gross margin bridge
  • Alternative routes/ports and steering Middle East-intended product to other regions, especially APAC

AI IconFinancial Highlights

  • Reported revenue EUR 618M (+8% YoY); constant currency growth +14%
  • Currency translation headwind: +640 bps headwind to revenue growth (EUR/USD avg $1.17 vs $1.05)
  • Adjusted gross margin 54.6% (-310 bps YoY) including distributor markup reversal from Australia acquisition
  • Gross margin 53.9% (-380 bps YoY)
  • Adjusted gross margin excluding FX (230 bps) and incremental U.S. tariffs (90 bps): +10 bps YoY
  • Adjusted EBITDA EUR 198M (-1% YoY) with FX flow-through -EUR 27M; excluding FX, EBITDA +13%
  • Adjusted EBITDA margin 32.1% (-270 bps YoY); excluding FX and tariffs margin would have been 35.4% (+60 bps to guidance-like run rate)
  • Adjusted EPS EUR 0.50 (-9% YoY) impacted by FX translation -EUR 17M (-0.09 EPS) and noncash embedded derivative revaluation -EUR 15M (-0.08 EPS)
  • Operating cash EUR 29M vs use of EUR 18M in Q2 2025
  • Inventory-to-sales 39% (+300 bps vs 36% YoY) driven by FX, preproduction/WIP (+19% YoY raw materials & semi-finished goods, +EUR 26M), and capitalized tariffs
  • DSO 49 days vs 46 days prior year; higher B2B mix and timing of large shipments later in the quarter

AI IconCapital Funding

  • Cash and cash equivalents EUR 201M at March 31, 2026
  • Net leverage 1.7x vs 1.5x at Sept 30, 2025 (seasonality)
  • CapEx EUR 21M in the quarter; EUR 110M–EUR 130M guided for full year 2026
  • Share repurchase intent: total consideration $200M authorized during fiscal 2026; no year-to-date repurchases cited; appetite for open market repurchases under consideration
  • Net leverage target end of fiscal 2026: 1.3x–1.4x excluding impact of additional repurchases

AI IconStrategy & Ops

  • Secured alternative delivery routes and can steer Middle East-intended product to other regions (notably APAC) using engineered distribution model
  • Investments in online business to improve conversion and accelerate digital growth
  • Retail expansion pace: 5 new owned retail doors in Q2; total 111 with target ~140 by end of fiscal 2026
  • IT and retail investments continued
  • Production actions: ramping pairs sold; expanded preproduction of uppers in Arouca to be faster in final assembly and address bottlenecks

AI IconMarket Outlook

  • Reiterated fiscal 2026 constant currency revenue growth target: 13%–15%
  • Q3/Q4 revenue growth in constant currency: within 13%–15% annual guidance range
  • FX for Q3: ~200 bps headwind to reported revenue growth; Q4: almost no difference between reported and constant currency
  • Full-year FX headwind to revenue growth: ~350 bps; implies reported revenue growth of 10%–12% to EUR 2.3B–EUR 2.35B (guidance assumes EUR/USD $1.17)
  • Margin guidance: tariffs similar impact in Q3 on gross and EBITDA margins of ~100 bps; Q4 tariff impact ~50 bps; FX pressure ~60 bps in Q3 and neutral in Q4
  • Fiscal 2026 adjusted gross margin: 57.0%–57.5% (inclusive ~200 bps FX + U.S. tariff pressure)
  • Fiscal 2026 adjusted EBITDA: at least EUR 700M (margin 30.0%–30.5%, inclusive of ~200 bps FX + tariffs)
  • Expected tax rate: 26%–28%
  • Adjusted EPS: EUR 1.90–EUR 2.05 including ~EUR 0.15–0.20 FX pressure; excludes impact of any additional share repurchase
  • CAPE platform launch timing for refunds referenced (CAP E went live April 20); refunds not yet filed due to entry reconciliation processing

AI IconRisks & Headwinds

  • Middle East war disrupted shipments; estimated EUR 6M revenue impact in Q2 EMEA (~300 bps headwind to EMEA growth), with half direct (Strait of Hormuz blocked; inability to ship into region) and half indirect (reduced tourism and more cautious consumer sentiment in Europe)
  • Ongoing Middle East direct risk in H2; indirect consumer risk difficult to predict if inflation rises further
  • Tariff uncertainty and higher tariffs vs pre-April 2025: average tariffs just over 20% post U.S. Supreme Court ruling (vs just over 10% pre-April 2025; ~25% then ~15% after EU agreement July 2025)
  • Adjusted gross margin and EBITDA margin compressed by FX (230 bps gross margin; EBITDA -EUR 27M flow-through; EBITDA margin -270 bps YoY)
  • Inventory build and DSO uptick influenced by FX and timing; working capital not at historical lows
  • Macroeconomic pressure: higher inflation reduces consumer wallet flexibility; U.S. inflation 3.3% in March 2026; Eurozone inflation 3% in April (from 11% energy cost increase mentioned)

Q&A: Analyst Interest

  • Second-half forecast drivers: Management said it expects no slowdown in H2 fiscal 2026, emphasizing demand strength and conservatism in guidance. They cited DTC-heavy seasonality in the two largest quarters, EMEA exposure, and confidence delivering 13%–15% constant currency despite conflicts, inflation, FX, and tariffs.
  • EMEA Middle East risk quantification: Management quantified Q2 revenue impact as EUR 6M (~300 bps) split equally between direct shipment disruption (Strait of Hormuz blocked) and indirect effects (tourism drop and cautious local sentiment). For H2 they identified EUR 10M–12M additional EMEA revenue risk, offset via other regions; overall guidance unchanged.
  • Tariff/Gross margin bridge and EPS noncash items: Management explained adjusted gross margin bridge to 54.6% down 310 bps: FX -230 bps, tariffs -90 bps, channel shift -30 bps, partially offset by absorption +30 bps and price/inflation +10 bps. EPS EUR 0.50 included noncash embedded derivative expense from senior-note call option valuation sensitivity due to note price volatility.

Sentiment: MIXED

Note: This summary was synthesized by AI from the BIRK Q2 2026 earnings transcript. Financial data is complex; please verify all metrics against official SEC filings before making investment decisions.

📋 Official Regulatory 10-K / 10-Q SEC Filings

Direct authenticated documentation links to audited SEC database reports for BIRK.

SEC EDGAR Live Feed
No recent 10-K available.
No recent 10-Q available.
Loading financial data and tables...
📁

SEC Filings (BIRK)

© 2026 Stock Market Info — Birkenstock Holding plc (BIRK) Financial Profile