The Gap, Inc.

The Gap, Inc. (GAP) Market Cap

The Gap, Inc. has a market capitalization of $7.23B.

Price: $20.09

-0.29 (-1.42%)

Market Cap: 7.23B

NYSE · time unavailable

CEO: Richard Dickson

Sector: Consumer Cyclical

Industry: Apparel - Retail

IPO Date: 1980-03-17

Website: https://www.gapinc.com

The Gap, Inc. (GAP) - Company Information

Market Cap: 7.23B|Sector: Consumer Cyclical

Company Profile

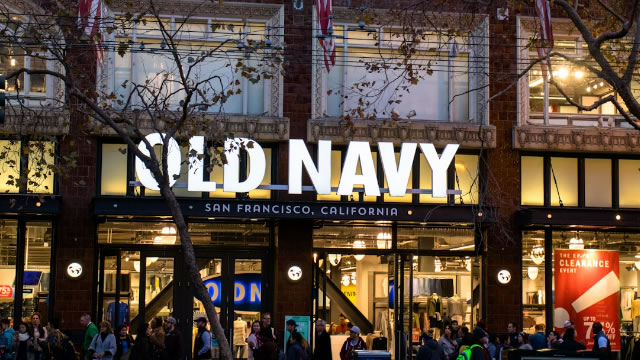
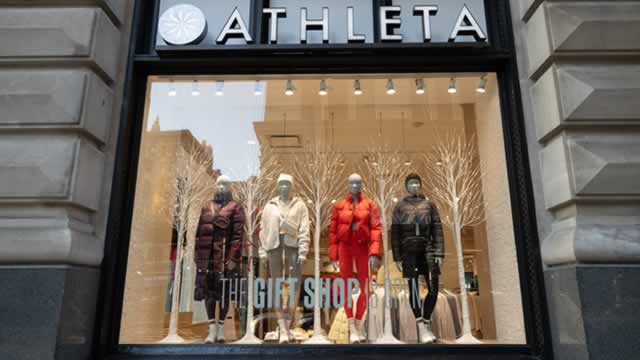
The Gap, Inc. operates as a prominent apparel retail enterprise, offering a diverse array of clothing, accessories, and personal care products for men, women, and children. These goods are marketed under its well-known brands: Old Navy, Gap, Banana Republic, and Athleta. Its extensive product line features staples such as denim, t-shirts, fleece wear, and khakis, alongside accessories like eyewear, jewelry, footwear, handbags, and fragrances. Athleta specifically caters to women and girls with fitness and lifestyle products designed for activities including yoga, training, sports, travel, and everyday wear. The company distributes its products through various sales channels, including its own company-operated stores, franchised locations, e-commerce websites, third-party collaborations, and catalogs. Furthermore, The Gap, Inc. has established franchise partnerships with independent operators, enabling the operation of Old Navy, Gap, Athleta, and Banana Republic stores and online platforms across Asia, Europe, Latin America, the Middle East, and Africa. As of December 31, 2021, the company's retail footprint comprised 2,835 corporate-owned stores and an additional 564 franchised outlets. Incorporated in 1969, The Gap, Inc. maintains its corporate headquarters in San Francisco, California.

Analyst Sentiment

70%
Buy

From 20 Active Polls

1Y Forecast: $22.33

▲ +11.1% Potential Upside

Consensus Target Metrics

Low Bound

$20

Median

$21

High Bound

$26

Average

$22

Price & Moving Averages

Loading chart...

🎯 Wall Street Analyst Intelligence Report

1-Year structural target targets, chart projections, and sentiment maps.

Average 1Y Target
$22.33
▲ +11.15% Upside
Low Target
$20.00
-0% Risk
Median Target
$21.00
5% Mid
High Target
$26.00
29% Max
Consensus
Hold
19 / 48 Buys

Consensus Trend Projection

Trailing closures vs. 12-month metrics map.

Analyst Vote Distribution

Aggregate institutional coverage sentiment weights.

📊 Historical Valuation Multiples

Real-time Trailing Twelve Month (TTM) momentum side-by-side with discrete quarterly metrics.

Fiscal QuarterTTMQ2 2026Q1 2026Q4 2025Q3 2025Q2 2025Q1 2025Q4 2024Q3 2024
Period EndingTrailing 12MMay 2, 2026Jan 31, 2026Nov 1, 2025Aug 2, 2025May 3, 2025Jan 31, 2025Oct 31, 2024Jul 31, 2024
Market Cap ($M)7,2329,05810,4378,5007,0278,6219,0747,8308,828
Enterprise Value ($M)10,71212,53813,43211,75410,42512,13112,21411,32712,387
Price to Earnings Ratio (P/E)7.766.7115.219.078.1211.2711.357.1110.67
Price/Earnings-to-Growth Ratio (PEG)2.041.561.071.362.431.09
Price to Sales Ratio (P/S)0.472.592.462.161.892.492.192.042.37
Price to Book Ratio (P/B)2.022.482.752.332.052.602.782.503.04
Price to Free Cash Flow Ratio (P/FCF)5.66116.1215.0055.5620.08-38.6618.1954.7619.19
Enterprise Value to Sales (EV/Sales)3.593.172.982.803.502.942.963.33
Enterprise Value to EBITDA (EV/EBITDA)5.8121.6936.9025.4423.6429.8129.9422.3027.96
Debt to Equity Ratio1.891.541.481.511.631.651.681.741.88

📘 Full Research Report

ℹ️

AI-Generated Research: This report is for informational purposes only.

📘 GAP INC (GAP) — Investment Overview

🧩 Business Model Overview

Gap Inc sells apparel through a multi-brand, omnichannel retail model anchored by differentiated store formats and a sizable digital presence. The value chain runs from design and product development to sourcing and logistics, followed by distribution to stores and fulfillment of e-commerce orders. Monetisation is driven by managing product assortment and seasonal calendars, controlling inventory flow (purchase timing, markdown discipline, and replenishment cadence), and leveraging retail and online demand through marketing, merchandising, and loyalty engagement.

💰 Revenue Streams & Monetisation Model

Revenue is primarily transactional: merchandise sales across its core brands (Gap, Old Navy, Banana Republic) with additional contribution from e-commerce fulfillment and third-party and outlet channels where applicable. There is limited true recurring revenue; instead, margins depend on product availability, full-price sell-through, and the ability to limit promotional intensity.

Key gross margin drivers include: (1) product mix (basics and denim/outerwear profiles typically support steadier pricing versus fashion-led categories), (2) sourcing costs and freight efficiency, (3) inventory quality and shrink/defect management, and (4) markdown timing. Operating margin is influenced by operating leverage from sales density in stores, fulfillment productivity, and shared overhead allocation across brands and distribution.

🧠 Competitive Advantages & Market Positioning

Gap Inc competes in mainstream apparel retail where merchandising execution, inventory discipline, and supply chain speed determine profitability. The company’s most defensible advantages are operational scale and distribution leverage, amplified by private-label resistance in basics and staple categories.

  • Scale/Distribution Leverage (Cost Advantage): Larger purchasing volumes and network-wide logistics improve cost per unit versus smaller apparel retailers, supporting better gross margin resilience during promotional cycles.
  • Private-Label Resistance (Assortment Control): Differentiation through owned product lines and staple positioning can reduce direct comparability to commodity assortments and support margin through more controlled fabric and construction choices.
  • Omnichannel Execution (Retail + Digital Synergy): Dense store coverage can help capture demand, while digital fulfillment and inventory visibility increase conversion and reduce stockouts and excess inventory.

Competitive benchmarking: Gap Inc’s primary competitors include American Eagle Outfitters (AEO), Abercrombie & Fitch (ANF), and H&M (H&M) / Zara (Inditex) in adjacent fashion categories. AEO and ANF compete strongly on brand-led fashion credibility and denim-centric merchandising, while H&M and Zara compete on rapid trend turnover and fast-fashion supply responsiveness. Gap’s focus is comparatively more anchored in accessible, everyday apparel and staples—where scale-driven sourcing, inventory management, and assortment control can matter more than pure trend speed.

🚀 Multi-Year Growth Drivers

Sustainable growth should be assessed through demand capture in mainstream apparel and continued operational improvement rather than relying on a single fashion cycle. Key drivers over a 5–10 year horizon include:

  • Omnichannel share gains: Continued consumer shift toward online purchasing, with stores functioning as demand capture points and fulfillment support.
  • Frictionless inventory productivity: Better forecasting, replenishment cadence, and inventory allocation can reduce markdown reliance and improve cash generation.
  • Assortment and brand portfolio optimization: Concentrating on categories where Gap’s merchandising strengths and supply chain capabilities translate into higher full-price sell-through.
  • Cost-to-serve improvements: Fulfillment efficiency, logistics productivity, and reduced waste/shrink can expand margins even without major top-line acceleration.
  • Category tailwinds in staples: Ongoing consumer need for replenishment basics (jeans, tees, activewear-adjacent staples) provides a durable baseline market within a broader apparel TAM.

⚠ Risk Factors to Monitor

  • Demand cyclicality and promotional dynamics: Apparel is sensitive to consumer confidence and discretionary spending, which can pressure pricing and drive higher markdowns.
  • Fashion and assortment execution risk: Mis-timed purchases, incorrect mix, or product quality issues can increase inventory obsolescence and reduce margins.
  • Competitive intensity: Fast-fashion players’ trend velocity and value retailers’ pricing power can compress share and gross margins.
  • Cost inflation: Wage, freight, and input cost volatility can outpace merchandising pricing if inventory cycles are poorly synchronized.
  • Capital intensity and lease exposure: Store footprint decisions and lease terms can limit operating flexibility during demand downturns.

📊 Valuation & Market View

Equity valuation for apparel retailers typically reflects durability of gross margin, operating leverage, and the trajectory of inventory productivity. Market participants often anchor on EV/EBITDA and P/S, with movements driven by:

  • Gross margin credibility: Evidence that markdowns are not structurally required to clear inventory.
  • Inventory turn and cash conversion: Ability to translate sales into working-capital efficiency and free cash flow.
  • Operating expense leverage: Whether digital and fulfillment expansion improves productivity faster than costs rise.
  • Stability of unit economics: Contribution margin trends across store and e-commerce channels.

🔍 Investment Takeaway

Gap Inc’s long-term investment case rests on operational scale advantages and inventory discipline in mainstream apparel, supported by omnichannel execution and assortment control through staple categories. The core question for sustained value creation is not incremental revenue growth alone, but whether the company can protect gross margins by improving inventory productivity and reducing promotional dependence while maintaining cost-to-serve efficiency across stores and digital fulfillment.


⚠ AI-generated — informational only. Validate using filings before investing.
📰 Market News & Coverage

15 Stories Available

Real-time institutional reporting and market updates for GAP.

zacks.com2026-07-22

Why Gap (GAP) is a Top Value Stock for the Long-Term

The Zacks Style Scores offers investors a way to easily find top-rated stocks based on their investing style. Here's why you should take advantage.

defenseworld.net2026-07-22

Bank of New York Mellon Corp Sells 63,160 Shares of The Gap, Inc. $GAP

Bank of New York Mellon Corp reduced its stake in The Gap, Inc. (NYSE: GAP) by 2.0% during the first quarter, according to its most recent filing with the Securities and Exchange Commission (SEC). The firm owned 3,132,774 shares of the company's stock after selling 63,160 shares during the period. Bank of New

zacks.com2026-07-16

GAP Declines 25% in 3 Months: Time to Buy or Wait for Now?

GAP trades at a discounted valuation as investors weigh weaker near-term guidance against AI investments and customer engagement initiatives.

seekingalpha.com2026-07-11

July Graham Value All-Stars (GVAS) Emit 10 Beaming Buys

July's GVAS Dogs list highlights ten fair-priced, high-yield large-cap stocks, including IRSA Inversiones, Weibo, Verizon, and AT&T, as ideal buys. Analyst targets project average net gains of 40.39% for the top ten GVAS stocks by July 2027, with risk profiles generally below market volatility. The dividend dogcatcher strategy favors stocks whose $1K dividend income exceeds share price, with 36 of 54 GVAS stocks meeting this ideal condition.

gurufocus.com2026-07-08

Gap Inc (GAP) Shares Fall 3.8% -- What GF Score of 73 Tells Investors

On July 08, 2026, Gap Inc (GAP) shares fell 3.8%, bringing the current price to $18.35. The stock has been under pressure, with a 52-week range of $18.11 to $29

zacks.com2026-07-07

Gap's Athleta Rebuild: When Will the Turnaround Gain Momentum?

GAP's Athleta rebuild remains in transition as inventory cleanup pressures sales, but new product wins point to possible momentum ahead.

zacks.com2026-07-03

Gap (GAP) is a Top-Ranked Value Stock: Should You Buy?

Whether you're a value, growth, or momentum investor, finding strong stocks becomes easier with the Zacks Style Scores, a top feature of the Zacks Premium research service.

youtube.com2026-06-27

Gap CEO explains the story that the brand wants to tell

Great brands don't just sell products. They create culture.

prnewswire.com2026-06-25

INVESTOR ALERT: Pomerantz Law Firm Investigates Claims On Behalf of Investors of The Gap Inc. - GAP

NEW YORK, June 25, 2026 /PRNewswire/ -- Pomerantz LLP is investigating claims on behalf of investors of The Gap Inc. ("Gap" or the "Company") (NYSE: GAP). Such investors are advised to contact Danielle Peyton at [email protected] or 646-581-9980, ext.

zacks.com2026-06-24

Gap Advances Digital Transformation With AI-Led Marketing Overhaul

GAP is leveraging AI, data analytics and strategic partnerships to personalize marketing, boost engagement and support long-term growth.

marketbeat.com2026-06-23

American Eagle's Q1 Beat Leaves Investors With a Bigger Question

American Eagle Outfitters TodayAEOAmerican Eagle Outfitters$17.75 -0.04 (-0.22%) As of 03:58 PM Eastern52-Week Range$9.49▼$28.46Dividend Yield2.82%P/E Ratio10.96Price Target$20.36Add to WatchlistAmerican Eagle Outfitters Inc. NYSE: AEO has posted consecutive earnings beats. Yet even after delivering another better-than-expected quarter on May 28, shares sold off as concerns about weakness in the core American Eagle brand and pressure on second-quarter gross margin overshadowed stellar performance at Aerie.

globenewswire.com2026-06-23

INVESTOR ALERT: Pomerantz Law Firm Investigates Claims On Behalf of Investors of The Gap Inc. - GAP

NEW YORK, June 23, 2026 (GLOBE NEWSWIRE) -- Pomerantz LLP is investigating claims on behalf of investors of The Gap Inc. (“Gap” or the “Company”) (NYSE: GAP). Such investors are advised to contact Danielle Peyton at  [email protected]  or 646-581-9980, ext. 7980.

zacks.com2026-06-22

Gap's Ninth Positive Comp: Is the Turnaround Still Accelerating?

GAP's turnaround gains traction as comps rise for a tenth straight quarter, fueled by denim strength, cultural campaigns and reduced discounting.

marketbeat.com2026-06-19

American Eagle's Q1 Beat Leaves Investors With a Bigger Question

American Eagle Outfitters TodayAEOAmerican Eagle Outfitters$17.82 +0.72 (+4.19%) As of 06/18/2026 03:59 PM Eastern This is a fair market value price provided by Massive. Learn more.52-Week Range$9.46▼$28.46Dividend Yield2.81%P/E Ratio11.00Price Target$20.36Add to WatchlistAmerican Eagle Outfitters Inc. NYSE: AEO has posted consecutive earnings beats.

prnewswire.com2026-06-18

INVESTOR ALERT: Pomerantz Law Firm Investigates Claims On Behalf of Investors of The Gap Inc. - GAP

NEW YORK, June 18, 2026 /PRNewswire/ -- Pomerantz LLP is investigating claims on behalf of investors of The Gap Inc. ("Gap" or the "Company") (NYSE: GAP). Such investors are advised to contact Danielle Peyton at [email protected] or 646-581-9980, ext.

📊 AI Financial Analysis

Powered by StockMarketInfo
Earnings Data: Q Ending 2026-05-02

"GAP reported Q1’26 revenue of $3.50B and net income of $339M (EPS: $0.92). Versus Q1’25, revenue grew +1.03% ($3.50B vs. $3.46B) and net income rose +75.7% ($339M vs. $193M). On a QoQ basis, revenue declined -17.4% ($3.50B vs. $4.24B) while net income increased +98.3% ($339M vs. $171M), indicating a meaningful improvement in operating profitability despite seasonal top-line softness. Profitability improved materially: net margin expanded to 9.7% from 5.6% YoY (and from 4.0% QoQ), while gross margin remained supportive at 40.5% (up vs. 38.1% QoQ). Cash generation in Q1’26 was positive with operating cash flow (OCF) of $213M and free cash flow (FCF) of $78M; however, FCF was down QoQ (vs. $696M in Q4’25) as cash declined $455M during the quarter. The balance sheet shows equity strength at $3.66B, but leverage remains elevated with total debt of $5.64B and net debt of ~$3.48B. Shareholder returns are favorable: the stock is up +48.2% over 1Y (strong momentum), and the dividend yield is ~0.7%. Analysts’ consensus price target ($32.67) sits above the current price ($27.02), supporting valuation upside."

Revenue Growth

Fair

YoY revenue was slightly higher (+1.03%) but QoQ revenue fell -17.4% (seasonal drawdown). Overall top-line trend is modest.

Profitability

Good

Net income surged +75.7% YoY to $339M and net margin expanded to 9.7% from 5.6% a year ago. QoQ net income also rose +98.3% alongside a sharp net margin improvement.

Cash Flow Quality

Neutral

OCF was positive at $213M and FCF was $78M, but FCF declined sharply vs Q4’25 ($696M). Dividend paid was ~$63M; buybacks of ~$401M supported liquidity use.

Leverage & Balance Sheet

Caution

Equity is stable at ~$3.66B, but leverage is still high (total debt ~$5.64B; net debt ~$3.48B). Assets rose QoQ, but debt remains a constraint.

Shareholder Returns

Strong

Total return backdrop is strong: price is up +48.2% over 1Y (well above 20% momentum threshold). Dividend yield is modest (~0.7%), but buybacks continue.

Analyst Sentiment & Valuation

Positive

Consensus target of $32.67 is above $27.02 current (~+21%), implying positive expectations versus near-term valuation.

Disclaimer:This analysis is AI-generated for informational purposes only. Accuracy is not guaranteed and this does not constitute financial advice.

Fundamentals Overview

Loading fundamentals overview...

Gap’s Q1 shows steady top-line momentum (+2% comps for the ninth straight quarter) and a clear bright spot in the Gap brand (+10% comps) driven by denim/fleece/kids, cultural storytelling, and reduced discounting. However, the call flags execution gaps that matter for forward earnings: Old Navy started soft on women’s seasonal dresses, with improvement only beginning in mid-May, and Athleta’s rebuild remains slower than planned after legacy product clearing took longer, pressuring sales (-12% net sales; -11% comp). Financially, margin deterioration is largely tariff-driven—gross margin down 130 bps with merchandise down 100 bps and ROD down 30 bps—though management emphasizes underlying merchandise expansion offset by a 200 bps tariff net impact. Despite lower sales expectations (+1% to +2%), the company raised full-year adjusted EPS to $2.30–$2.40, supported by interest/tax/share-count favorability and continued aggressive repurchases ($400M YTD). Key uncertainty centers on tariff/fuel and promotional rationality, not demand collapse.

AI IconGrowth Catalysts

  • Gap comp sales +10% on culturally relevant storytelling and destination categories (denim, fleece, kids/baby)
  • Gap achieved 3rd consecutive quarter of reduced discounting; expanded customer file
  • Old Navy active/denim/kids & baby continued growth and helped maintain top-3 denim and kids & baby ranking
  • Old Navy addressing underperformance in women’s seasonal dress assortment; mid-May price/message changes showed improvement
  • Athleta rebuild headwinds: legacy inventory clearing took longer than expected, pressuring Q1 sales and comps

Business Development

  • Old Navy partnership with Fanatics (global sports licensing) launched for a first-of-its-kind program beginning with Q2 rollout
  • Fashiontainment platform expansion tied to sports licensing opportunities with Fanatics as an example
  • Old Navy designer collaboration: Christopher John Rogers
  • Old Navy sequel tie-in: Devil Wears Prada special collection
  • Gap cultural activations and campaigns: Coachella “Hoodie House” and Sweats Like This music video (Young Miko)
  • Gap collaborations: Harlem’s Fashion Row, Awake New York, and Victoria Beckham (multi-season collaboration momentum)
  • Banana Republic capsule collaboration with the Explorers Club (archive reissue capsule)
  • AI shopping partnership: Google Gemini
  • Loyalty relaunch: Encore transitioning ~40 million customers to an engagement-based platform

AI IconFinancial Highlights

  • Net sales $3.5B (+1% YoY); comparable sales +2% (9th consecutive quarter of positive comps)
  • Reported EPS $0.90 vs prior-year EPS $0.51; adjusted EPS $0.38 (includes $300M legal settlement net gain and $50M charitable donation excluded on adjusted basis)
  • Gross margin 40.5% (-130 bps YoY) and ahead of guidance; merchandise margins -100 bps and ROD -30 bps
  • Tariff impact: net impact of tariffs of 200 bps; implies 100 bps underlying merchandise margin expansion (offset by credit-card dynamic headwinds and slight fuel-cost impact)
  • Reported operating margin 12.7%; adjusted operating margin 5.2% (-32 bps YoY primarily from net tariff impact)
  • Capital returns: share repurchases $400M YTD (~16M shares); dividend quarterly rate increased 6% to $0.175/share; second-quarter dividend approved at $0.175/share

AI IconCapital Funding

  • First-quarter capex $135M; fiscal 2026 capex/investment expectation ~$650M (stores, technology, supply chain)
  • Share repurchases: $400M repurchased YTD; ~$600M remaining under current authorization
  • Cash equivalents + short-term investments $2.6B (+15% YoY)
  • Free cash flow $78M; Q1 net cash from operating activities $213M (inclusive of legal settlement net gain and charitable donation)

AI IconStrategy & Ops

  • Gap: 10th consecutive quarter of positive comps; 30-store remodel plan for ~25% of North America specialty fleet by year end
  • Old Navy: Q2 focus on sharpening price points and customer messaging for seasonal women’s dress and broader seasonal assortment; monitoring continued adjustments after mid-May improvements
  • Athleta: continuing legacy product clearing; Q2 inventory clearing remains priority with smaller-scale new product introductions (Journey Travel Collection; new leg shapes in Heritage Elation)
  • Technology/product intelligence: AI used for merchandising decisions, inventory productivity, and replenishment; extended discovery via AI-powered shopping partnerships (Google Gemini)
  • Customer experience automation: Encore loyalty transition (~40M customers) from transaction-based to engagement platform

AI IconMarket Outlook

  • Fiscal 2026 net sales growth now guided at +1% to +2% (reduced sales expectations mainly from moderated Old Navy outlook)
  • Old Navy full-year comp now expected flat to up 1% (previously implied stronger start)
  • Gap full-year comps now expected in the single digits (with momentum from turnaround playbook)
  • Athleta second quarter expected trending similar to Q1; slower rebuild guidance
  • Banana Republic full-year comp growth expected to continue (unchanged vs prior outlook)
  • Fiscal 2026 gross margin: flat to up slightly; ROD deleverage ~50 bps for the year
  • Fiscal 2026 adjusted SG&A as % of sales roughly flat YoY; includes $150M cost savings; adjusted operating margin 7.3% to 7.5% (vs 7.3% last year)
  • Fiscal 2026 adjusted EPS raised to $2.30 to $2.40 (interest income, tax, and reduced share count)
  • Tariff assumption change: section 22 assumed at 10% on goods received after Feb 24 through July 24 deadline; net tariff relief expected ~50 bps year-over-year to gross and operating margin vs prior outlook (~$80M). Benefit weighted toward Q2 and Q3
  • Section 22 tariffs revert to IEPA rates for remainder of year; administration intent to reimpose higher tariffs after section 22 expiration referenced

AI IconRisks & Headwinds

  • Old Navy women’s seasonal dress assortment underperformed in Q1; underperformance expected to continue into Q2 until changes fully take hold
  • Athleta rebuild is taking longer than anticipated; legacy product clearing pressures sales and comps with Q2 trending similar to Q1
  • Tariff and fuel volatility: management cited 200 bps tariff net impact in Q1 and reserving tariff relief in full-year plan due to risk of sustained fuel inflation and promotional reinvestment
  • Credit card agreement lapping dynamic created the gap between net sales and comps; modest headwinds referenced in-quarter
  • Uncertainty on tariff refunds: Gap not part of first phase; no refund benefits included in outlook due to lack of certainty

Q&A: Analyst Interest

    Sentiment: MIXED

    Note: This summary was synthesized by AI from the GAP Q1 2026 earnings transcript. Financial data is complex; please verify all metrics against official SEC filings before making investment decisions.

    📋 Official Regulatory 10-K / 10-Q SEC Filings

    Direct authenticated documentation links to audited SEC database reports for GAP.

    SEC EDGAR Live Feed
    Loading financial data and tables...
    📁

    SEC Filings (GAP)

    © 2026 Stock Market Info — The Gap, Inc. (GAP) Financial Profile