Beyond Meat, Inc.

Beyond Meat, Inc. (BYND) Market Cap

Beyond Meat, Inc. has a market capitalization of $365.6M.

Price: $0.71

-0.08 (-9.75%)

Market Cap: 365.58M

NASDAQ · time unavailable

CEO: Ethan Brown

Sector: Consumer Defensive

Industry: Packaged Foods

IPO Date: 2019-05-02

Website: https://www.beyondmeat.com

Beyond Meat, Inc. (BYND) - Company Information

Market Cap: 365.58M|Sector: Consumer Defensive

Company Profile

Beyond Meat, Inc. manufactures, markets, and sells plant-based meat products in the United States and internationally. The company sells a range of plant-based meat products across the platforms of beef, pork, and poultry. It sells its products through grocery, mass merchandiser, club store, convenience store and natural retailer channels, and direct-to-consumer, as well as various food-away-from-home channels, including restaurants, foodservice outlets, and schools. The company was formerly known as Savage River, Inc. and changed its name to Beyond Meat, Inc. in September 2018. Beyond Meat, Inc. was founded in 2009 and is headquartered in El Segundo, California.

Analyst Sentiment

38%
Underperform

From 6 Active Polls

1Y Forecast: $44.55

▲ +6180.0% Potential Upside

Consensus Target Metrics

Low Bound

$3

Median

$25

High Bound

$122

Average

$45

Price & Moving Averages

Loading chart...

🎯 Wall Street Analyst Intelligence Report

1-Year structural target targets, chart projections, and sentiment maps.

Average 1Y Target
$44.55
▲ +6179.95% Upside
Low Target
$3.00
323% Risk
Median Target
$25.00
3424% Mid
High Target
$122.00
17098% Max
Consensus
Sell
1 / 21 Buys

Consensus Trend Projection

Trailing closures vs. 12-month metrics map.

Analyst Vote Distribution

Aggregate institutional coverage sentiment weights.

📊 Historical Valuation Multiples

Real-time Trailing Twelve Month (TTM) momentum side-by-side with discrete quarterly metrics.

Fiscal QuarterTTMQ1 2026Q4 2025Q3 2025Q2 2025Q1 2025Q4 2024Q3 2024Q2 2024
Period EndingTrailing 12MMar 28, 2026Dec 31, 2025Sep 27, 2025Jun 28, 2025Mar 29, 2025Dec 31, 2024Sep 28, 2024Jun 29, 2024
Market Cap ($M)366290127218261239248466435
Enterprise Value ($M)6675924311,4121,4221,3591,3381,5681,513
Price to Earnings Ratio (P/E)1.32-2.550.08-0.49-2.23-1.13-1.38-4.38-3.16
Price/Earnings-to-Growth Ratio (PEG)-0.25-0.14
Price to Sales Ratio (P/S)1.384.982.073.103.483.483.245.754.67
Price to Book Ratio (P/B)-15.32-13.76-1147.02-0.28-0.39-0.37-0.41-0.76-0.74
Price to Free Cash Flow Ratio (P/FCF)-2.72-38.39-2.56-5.23-7.43-7.81-7.01-19.36-25.13
Enterprise Value to Sales (EV/Sales)10.177.0020.1118.9719.7817.4619.3516.24
Enterprise Value to EBITDA (EV/EBITDA)-3.44-17.27-10.16-15.25-57.08-33.48-35.06-77.52-52.70
Debt to Equity Ratio-1.55-23.58-4576.32-1.67-1.87-1.88-2.03-2.00-2.07
⚠️

Valuation Model Suspended

API Payload Error: Inverted or negative baseline Free Cash Flow margin detected (-28.2%).

Troubleshooting Notice: The upstream financial data supplier has uploaded corrupted or inverted baseline metrics for BYND. The server sandbox cannot calculate an intrinsic value path from negative cash generation baselines.

📘 Full Research Report

ℹ️

AI-Generated Research: This report is for informational purposes only.

📘 BEYOND MEAT INC (BYND) — Investment Overview

🧩 Business Model Overview

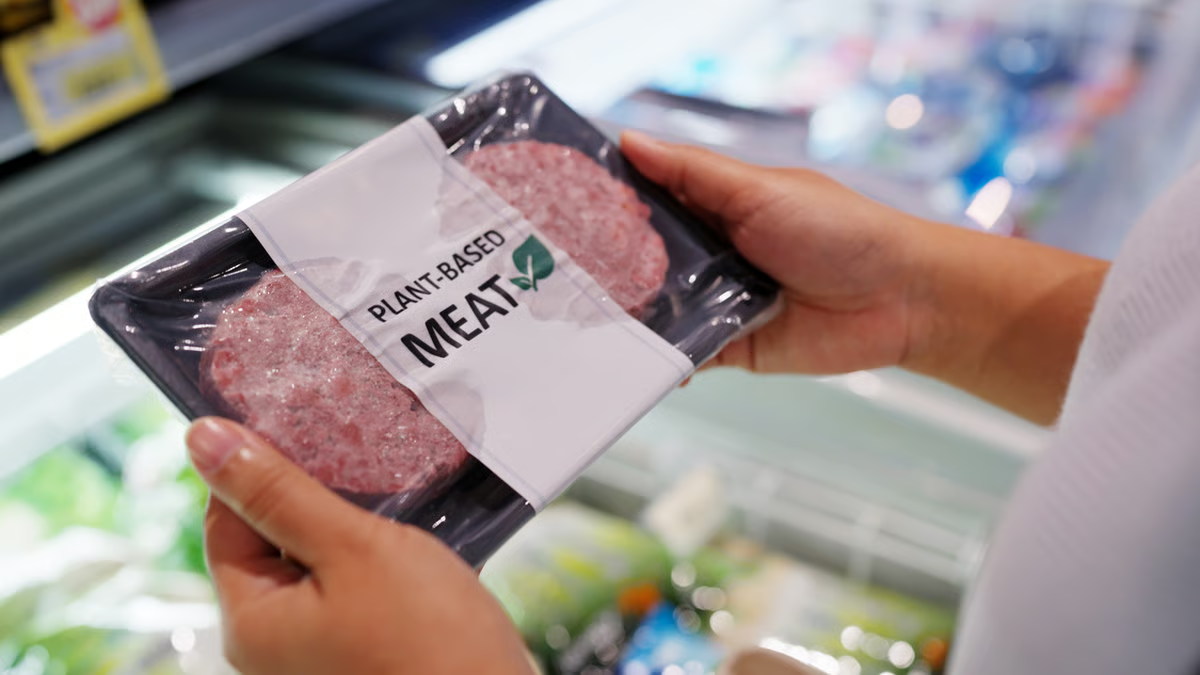
Beyond Meat develops and manufactures plant-based meat products and sells them through established retail and foodservice channels. The value chain centers on (1) ingredient sourcing (plant proteins, fats, binders, flavor systems), (2) formulation and process engineering to achieve texture and cooking behavior that approximates meat, (3) manufacturing execution to control yield and throughput, and (4) distribution into supermarkets and away-from-home customers (grocers, distributors, and restaurant operators).

“Customer stickiness” in this category is less about formal contracts and more about repeat purchase behavior and menu/assortment inertia: retailers and foodservice operators adopt products that (a) meet operational requirements (prep/cook consistency, shelf-life), (b) sustain consumer demand at acceptable gross margin, and (c) maintain reliable supply. That creates some switching friction, but it is not the same kind of durable lock-in seen in subscription software or regulated utilities.

💰 Revenue Streams & Monetisation Model

Revenue is primarily generated from product sales of branded plant-based meat items. Monetisation is predominantly transactional (unit sales) rather than recurring; however, meaningful operating leverage can emerge from volume scaling, fixed-cost absorption in manufacturing, and better channel efficiency when demand is stable.

Key margin drivers include:

  • Ingredient and input cost economics: plant protein inputs and specialty components influence gross margin.
  • Manufacturing yields and throughput: process stability and conversion efficiency affect cost per unit.
  • Freight and logistics: distribution costs and damage/returns matter for packaged chilled/frozen supply chains.
  • Channel mix: retail pricing dynamics versus foodservice case pricing and promotions can shift blended margins.

🧠 Competitive Advantages & Market Positioning

The competitive set is intense and fast-moving; durable advantage, when it exists, tends to be rooted in product engineering and cost-down execution rather than structural switching costs. The moat is best characterized as a combination of:

  • Intangible assets (process know-how & formulations): textured proteins require proprietary formulation and manufacturing learnings to deliver consistent sensory performance across supply and production runs.
  • Scale and operating execution: as volumes rise, fixed manufacturing overhead and quality costs can be absorbed more efficiently, improving unit economics.
  • Distribution/assortment relationships: once product lines are integrated into retailer and foodservice assortments, re-listing and re-training can create incremental friction for competitors (even though it remains contestable).

Competitive benchmarking:

  • Impossible Foods: strong focus on fermentation-adjacent ingredients and consumer-facing product iteration. The rivalry is largely product-performance and cost-down driven.
  • Tyson Foods (including plant-based offerings via partnerships/brands): the advantage is scale in protein supply chains and established distribution, with the ability to leverage existing manufacturing and logistics footprint.
  • Quorn Foods (MGP/other protein-based alternatives): competes in meat-analogue demand with different protein systems and product formats, often targeting texture and culinary versatility.

Positioning contrast: Beyond Meat competes directly in plant-based meat categories dominated by large food manufacturers with distribution leverage (Tyson) and well-capitalized plant-based peers (Impossible), while also facing alternative protein substitutes (e.g., mycoprotein-based offerings like Quorn). The differentiating battleground remains cost per kilogram of protein delivered to texture—paired with consistent execution through manufacturing and channel operations.

🚀 Multi-Year Growth Drivers

Over a 5–10 year horizon, growth is tied to structural shifts in protein consumption and product penetration:

  • Category expansion of plant-based protein: total addressable demand grows when products move from trial purchases to repeat consumption and broader menu inclusion.
  • Retail and foodservice normalization: shelf-space gains, broader distribution coverage, and deeper menu integration can lift unit volumes beyond niche assortments.
  • Cost-down learning curves: scaling manufacturing, improving yields, and optimizing formulations can expand the economic case versus meat alternatives.
  • Regulatory and labeling frameworks: clarity in labeling and standards can reduce friction for retailers and foodservice operators when communicating product attributes.
  • Innovation cycle: ongoing product improvements (better culinary performance, reduced cook variability, and broader SKU coverage) can support customer retention within channels.

⚠ Risk Factors to Monitor

  • Margin compression from competition: peers and large incumbents can use scale and supply-chain advantages to price aggressively, pressuring gross margin and operating leverage.
  • Input cost volatility: ingredient price swings and supply constraints can undermine unit economics without offsetting formulation or process improvements.
  • Technological substitution: cell-based protein and other protein modalities could shift consumer preferences and retailer allocation, reducing growth rates.
  • Regulatory and labeling developments: changes in definitions/requirements can affect product placement, advertising practices, and customer perception.
  • Capital intensity and execution risk: maintaining manufacturing performance, quality, and supply reliability requires continued investment; missteps can drive costly write-offs and inventory issues.
  • Channel dependency: retailers can rationalize SKUs and promotions, and foodservice operators can reprice or swap suppliers quickly, limiting durability of demand.

📊 Valuation & Market View

Equity markets typically value plant-based food companies using sales-based frameworks (e.g., EV/Revenue or price-to-sales) when profitability is uncertain, with EV/EBITDA or enterprise value to gross margin becoming more relevant as margins stabilize. The valuation sensitivity generally concentrates on:

  • Path to sustainable gross margin improvement: evidence of durable cost reductions versus temporary promotional effects.
  • Operating leverage credibility: whether overhead and fulfillment costs grow slower than revenue.
  • Channel momentum: sustained distribution breadth and repeat purchase indicators implied by sell-through trends.
  • Balance sheet and liquidity discipline: cash burn profile and funding requirements influence risk premia.

In this sector, multiple expansion typically depends less on top-line growth alone and more on translating volume into consistent unit economics.

🔍 Investment Takeaway

Beyond Meat offers exposure to a growing plant-based protein category, with potential value creation hinging on execution: improving ingredient-to-texture economics, sustaining manufacturing yields, and converting distribution into repeat purchasing. The core competitive advantage is not classic switching-cost lock-in, but rather formulation/process know-how, scale-driven cost-down, and operational reliability within retail and foodservice channels. The investment case warrants a close focus on margin resilience, competitive pricing pressure, and whether the company can reach durable profitability without excessive balance-sheet strain.


⚠ AI-generated — informational only. Validate using filings before investing.

📰 Market News & Coverage

15 Stories Available

Real-time institutional reporting and market updates for BYND.

globenewswire.com2026-06-02

Beyond Meat® Launches Beyond Immerse™ in New York

Company's first functional beverage line begins to roll out in influential New York market with bold new packaging Professional basketball player Josh Hart joins as Beyond Immerse ambassador to headline a summer of performance-focused fitness activations and events EL SEGUNDO, Calif., June 02, 2026 (GLOBE NEWSWIRE) -- Beyond Meat, Inc. (NASDAQ: BYND), otherwise known as Beyond The Plant Protein Company™, today announced the initial launch of Beyond Immerse, its first functional beverage line, into retail and foodservice locations in the New York metro area.

fool.com2026-05-19

Are Protein Drinks the Turnaround Catalyst That Beyond Meat Stock Needs?

Beyond Meat is positioning its line of protein drinks as a central pillar in its turnaround strategy. The company has been posting declining sales and poor gross margins, and it needs wins in new product categories.

fool.com2026-05-12

Beyond Meat Is Trading Near Its Lows. Is It Finally Time to Buy?

The maker of meat alternatives is aiming for a turnaround. Yet the company continues to post large net losses.

globenewswire.com2026-05-11

Beyond Meat® Announces Inducement Grants Under Nasdaq Listing Rule 5635(c)(4)

EL SEGUNDO, Calif., May 11, 2026 (GLOBE NEWSWIRE) -- Beyond Meat, Inc. (NASDAQ: BYND), otherwise known as Beyond The Plant Protein Company™ (the “Company”), announced today that on May 10, 2026, the Human Capital Management and Compensation Committee of the Company's Board of Directors (the “Committee”) granted an option to purchase 237,718 shares of the Company's common stock and 180,051 restricted stock units (“RSUs”) to Tony Kalajian under the Beyond Meat, Inc. 2026 Employment Inducement Equity Incentive Plan (the “2026 Inducement Plan”) in connection with Mr.

zacks.com2026-05-08

3 AgTech & Food Innovation Stocks to Watch as Food Systems Evolve

DE, ADM & TSN tap AgTech and food innovation trends as demand grows for smarter farming, sustainable ingredients and protein solutions.

benzinga.com2026-05-08

Beyond Meat Shares Pause Following Post-Earnings Selloff

Beyond Meat Inc (NASDAQ:BYND) shares are trading marginally higher during Friday's premarket session as the stock tries to stabilize after its post-earnings slide below $1.00. Here's what investors need to know.

fool.com2026-05-07

Small-Cap Stocks Are Plunging. Are Stalled Iran Negotiations Responsible?

Negotiations over the Iran war appeared to take a step backward. The Russell 2000 fell sharply, in part due to its increased exposure to interest rates and inflation.

seekingalpha.com2026-05-07

Beyond Meat: Continued Disappointment

Beyond Meat continues to struggle with declining revenues, net losses, and heavy dilution. Q1 revenue fell 15.3% year-over-year to $58.2 million, with volumes down 19.5% and Q2 guidance missing Street expectations, signaling ongoing operational weakness. BYND's cash burn improved to $7.5 million in Q1, but working capital eroded, and debt-for-equity swaps have massively diluted shareholders, with shares outstanding rising from 77 million to 515 million in a year.

feeds.benzinga.com2026-05-07

Stock Market Today: Do, S&P 500, Nasdaq Futures Gain As Trump Celebrates Record Gains— Fortinet, Whirlpool, Core Scientific In Focus (UPDATED)

U.S. stock futures rose on Thursday after Wednesday's record rally. This followed President Donald Trump's celebration of record stock market gains.

seekingalpha.com2026-05-06

Beyond Meat, Inc. (BYND) Q1 2026 Earnings Call Transcript

Beyond Meat, Inc. (BYND) Q1 2026 Earnings Call Transcript

zacks.com2026-05-06

Beyond Meat (BYND) Reports Q1 Loss, Beats Revenue Estimates

Beyond Meat (BYND) came out with a quarterly loss of $0.1 per share versus the Zacks Consensus Estimate of a loss of $0.12. This compares to a loss of $0.67 per share a year ago.

marketwatch.com2026-05-06

Restaurants really don't want to sell fake meat — and Beyond Meat is suffering

Beyond Meat's stock fell further on Wednesday after the maker of meat alternatives offered a weak forecast.

reuters.com2026-05-06

Beyond Meat forecasts muted second-quarter sales on weak demand

Beyond Meat forecast current-quarter revenue below Wall Street expectations on Wednesday, as it grapples with ​sluggish demand for its once-iconic plant-based products.

benzinga.com2026-05-06

Beyond Meat Stock Drops After Q1 Earnings — Here's Why

Beyond Meat Inc. (NASDAQ:BYND) shares were down after the company reported first-quarter results after Wednesday's closing bell and guided for second-quarter revenue below the analyst estimate.

globenewswire.com2026-05-06

Beyond Meat® Reports First Quarter 2026 Financial Results

EL SEGUNDO, Calif., May 06, 2026 (GLOBE NEWSWIRE) -- Beyond Meat, Inc. (NASDAQ: BYND), otherwise known as Beyond The Plant Protein CompanyTM (the “Company” or “Beyond Meat”), today reported financial results for its first quarter ended March 28, 2026.

📊 AI Financial Analysis

Powered by StockMarketInfo
Earnings Data: Q Ending 2026-03-28

"BYND reported Q1 2026 revenue of $58.2M and net loss of $(28.5)M (EPS: $(0.06)). On a YoY basis, revenue fell from $68.7M in Q1 2025 to $58.2M in Q1 2026 (−15.3% YoY) and net loss narrowed in absolute terms versus Q1 2025’s loss of $(52.9)M (improvement of +46.2% in losses). QoQ, revenue declined from $61.6M in Q4 2025 to $58.2M (−5.4% QoQ), and net income swung from Q4’s $412.8M profit to a $(28.5)M loss in Q1 2026 (a sharp deterioration sequentially). Profitability remains highly pressured: gross margin improved slightly to 3.4% in Q1 2026 versus 0.6% in Q1 2025, but the company is still loss-making with operating margin at −70.6% and net margin at −48.9% for the quarter. Cash flow quality is mixed: operating cash flow was $(5.0)M in Q1 2026 and free cash flow was $(7.6)M, continuing the trend of negative cash generation. Balance sheet resilience has improved versus the prior quarter with cash rising to $191.0M, but total equity remains thin at $87.9M and leverage is elevated (long-term debt $79.2M vs prior periods with unusual equity changes). Total shareholder returns are likely weak given the stock is down −67.9% over 1 year (no >20% momentum tailwind). No dividend is paid and buybacks are not evident in the cash flow data."

Revenue Growth

Neutral

Revenue decreased to $58.2M in Q1 2026 (−15.3% YoY vs $68.7M in Q1 2025; −5.4% QoQ vs $61.6M in Q4 2025).

Profitability

Neutral

Despite gross margin improvement (3.4% in Q1 2026 vs 0.6% in Q1 2025), the company remains deeply unprofitable (operating margin −70.6%, net margin −48.9% in Q1 2026). Net income improved YoY (loss of $(28.5)M vs $(52.9)M), but deteriorated sharply QoQ (profit in Q4 2025 to loss in Q1 2026).

Cash Flow Quality

Neutral

Operating cash flow was $(5.0)M and free cash flow $(7.6)M in Q1 2026, indicating continued cash burn. No dividends; buybacks not shown.

Leverage & Balance Sheet

Caution

Cash was $191.0M in Q1 2026 (up from $203.9M in Q4), but total stockholders’ equity is only $87.9M and retained earnings remain heavily negative. Balance-sheet resilience appears better in liquidity, yet leverage remains meaningful (total debt $85.6M).

Shareholder Returns

Neutral

1-year price performance is strongly negative (−67.9%), providing no momentum support. Dividend yield is 0 and no clear buybacks were reflected.

Analyst Sentiment & Valuation

Neutral

Street target implies upside versus the $0.82 current price (consensus target $44.55; high $122), though the distribution suggests high uncertainty—valuation support is speculative given operating losses.

Disclaimer:This analysis is AI-generated for informational purposes only. Accuracy is not guaranteed and this does not constitute financial advice.

Fundamentals Overview

Loading fundamentals overview...

BYND’s Q1 2026 shows material operating leverage: net revenue fell 15.3% YoY to $58.2M, but gross margin rebounded to 3.4% from -10.1% and the adjusted EBITDA loss narrowed to -$27.8M (47.7% of revenue). Management attributes margin improvement being “obscured” by Q4 2025 high-cost inventory flow-through and unfavorable fixed-cost absorption from low volume, implying timing risk rather than a broken cost program. Operating expenses dropped to $43.1M (from $57.4M), with a ~$14M YoY reduction narrative tied to workforce/SG&A streamlining and legal expense cessation. Cash use was reduced sharply to $11.8M, with $205.8M cash balance and ongoing convertible note conversions after quarter-end. Strategically, Beyond is shifting to functional food/beverage via Beyond Immerse (New York launch this summer) with Big Geyser, while expanding frozen retail (Kroger rollout for chicken and breakfast sausage) and continuing China exit plans. Guidance is limited to Q2 net revenue $60M–$65M; margins remain qualitative.

AI IconGrowth Catalysts

  • Beyond Immerse launch (lightly carbonated functional drink) positioned to address protein, fiber, vitamin, and electrolyte needs via one platform; 20g protein, 7g fiber, antioxidants and electrolytes, 100 calories; “launch in earnest across New York this summer.”
  • Frozen retail portfolio expansion: Beyond Chicken Pieces Spicy Buffalo rolled out at over 2,000 Kroger stores nationwide; plus nationwide rollout of Beyond Breakfast Sausage lineup (Links and Patties, original/spicy) at Kroger and Sprouts, “soon” Whole Foods Market.
  • Product renovation/innovation in center-of-plate: Beyond Steak Filet gaining “enthusiastic following” DTC (Beyond Test Kitchen) with expectation to expand into certain retail markets as production ramps later in 2026.

Business Development

  • Big Geyser named as distributor for Beyond Immerse; described as #1 non-alcoholic beverage distributor in New York with footprint of 26,000+ outlets across grocery, drug, convenience, mass merchandisers, club, and food service.
  • Kroger distribution commitments: Beyond Chicken Pieces Spicy Buffalo at 2,000+ Kroger stores; Beyond Breakfast Sausage rollout at Kroger (plus Sprouts; Whole Foods Market “soon”).
  • Clean Label Project certifications referenced: Beyond Chicken Pieces Spicy Buffalo and Beyond Breakfast Sausage (Links/Patties) described as first plant-based chicken/breakfast sausages to earn Clean Label Project certification; company states it holds 20+ Clean Label Project certifications.
  • Accreditation/validation: Beyond Burger IV and Beyond Steak recognized as Climate Solutions under the Climate Solution Framework (Exponential Roadmap Initiative and Oxford Net Zero).

AI IconFinancial Highlights

  • Net revenues $58.2M, flat vs expectations but down 15.3% YoY (from $68.7M); driven by -19.5% volume of products sold, partially offset by +5.4% net revenue per pound.
  • Gross margin improved to 3.4% from -10.1% YoY; sequential improvement cited, but management says reported improvement is “significantly below” achievable target due to Q4 2025 inventory flow-through during low volume/overhead absorption.
  • Adjusted EBITDA loss narrowed to -$27.8M (-(47.7%) of net revenues) vs -$50.5M (-(73.5%) of net revenues) YoY.
  • Loss from operations reduced to $41.1M from $64.4M YoY; net loss $28.5M or $0.06/share vs $61.1M or $0.80/share YoY.
  • Operating expenses $43.1M vs $57.4M YoY; includes incremental share-based comp $3.7M from convertible debt exchange; includes $0.8M non-routine SG&A; $0.4M amortization of partial campus lease termination; $0.2M incremental legal/arbitration fees. Management attributes reductions to lower donation costs, lower legal expenses, and reduced salary-related expenses.
  • Other income net $12.6M vs $3.3M YoY driven by non-cash gains from derivative liability remeasurement and gain on debt extinguishment from conversion of some 2030 convertible notes; partially offset by increased interest expense from delayed draw term loan and FX transaction losses.

AI IconCapital Funding

  • Cash and cash equivalents (incl. restricted) $205.8M as of Mar 28, 2026; down ~$11.8M vs 2025 ending balance.
  • Lowest quarterly cash use in over 2 years: cash use for Q1 of $11.8M; net cash used in operating activities $5.0M vs $26.1M prior-year period.
  • Capital expenditures $2.5M vs $4.5M prior-year.
  • Net cash used in financing activities $4.5M vs $0.6M prior-year, mainly due to withholding tax payments tied to equity awards in the convertible debt exchange.
  • Subsequent to quarter-end: additional $62.6M aggregate principal of 2030 convertible notes converted into ~52.1M shares of common stock; additional $3.9M anti-dilution restricted stock units granted to management under the convertible debt exchange.

AI IconStrategy & Ops

  • Transformation office outcomes: consolidated production network; activated continuous production line in Columbia, Missouri to internalize volume previously outsourced; investments to improve year-over-year conversion costs; RFP actions to reduce material costs, secure secondary sourcing, and enhance formulations.
  • Warehouse/logistics: consolidated warehouses and lowered logistics costs; exited less profitable lines.
  • China exit: finalized plans to exit China; shutdown-related expenses ~ $0.5M included in Q1 gross profit; expected “substantially complete by end of year.”
  • Inventory and line discipline: realized “significant reductions in inventory.”
  • Operating expense reduction: approximately $14M YoY reduction in operating expenses attributed to workforce reductions and SG&A streamlining, cessation of certain legal expenses, and other transformation efficiencies (management narrative).
  • Plant conversion/cost trajectory: management references conversion cost improvements and incremental COGS improvement, with Q&A stating something like “8% COGS … in terms of improvement.”

AI IconMarket Outlook

  • Q2 2026 net revenue guidance range: approximately $60M to $65M.
  • Margin guidance withheld: management expects gross margin to head “in a good direction” sequentially in next quarter without providing a numerical target.

AI IconRisks & Headwinds

  • U.S. and international food service remain weak: management states encouraging signs are “not yet” present in U.S. or international food service.
  • Category headwinds: plant-based meat category cited as continuing headwind; weak category demand and loss of distribution in U.S. retail and food service channels.
  • QSR customer churn: reduced burger/chicken sales to QSR customers drove volume decline; specific non-repeat of prior-year QSR chicken customer.
  • Gross margin recovery timing risk: Q1 gross margin improvement obscured by flow-through of Q4 2025 high-cost inventory and unfavorable fixed cost absorption from lower volumes; elevated sensitivity to volume/absorption.
  • China transition execution risk: China shutdown expenses embedded in Q1 and expected completion by end of 2026 (potential remaining costs).
  • Cash consumption/financing sensitivity: net cash use reduced but still occurs; financing includes convertible note dynamics and withholding tax cash outflows.

Q&A: Analyst Interest

  • Topic: Q2 gross margin direction and how to think about sequential improvement despite Q1 inventory flow-through. Management said margin should improve as Q2 is seasonally higher volume, high-cost inventory drag from Q1 should fade, and the mix benefits from core “summer grilling” products. They expect gradual, not step-change, conversion/efficiency benefits.
  • Topic: Marketing rollout plan for Beyond Immerse and adjacent functional beverages given cash constraints. Management emphasized “leverage” from board/operator expertise (named examples tied to beverage leaders) and “focus” via intentional New York launch with Big Geyser, plus an athlete/active-person narrative using nutrition system messaging rather than broad, low-efficiency advertising.
  • Topic: Conversion and COGS progress under transformation, including magnitude of cost improvements. Management highlighted ongoing right-sizing and reduced restructuring/legal drag, while Q&A added a directional reference to roughly “8%” COGS improvement driven by work in Columbia, Pennsylvania, and other plants, describing gains as reduction of “noise” so conversion improvements show in results.

Sentiment: MIXED

Note: This summary was synthesized by AI from the BYND Q1 2026 earnings transcript. Financial data is complex; please verify all metrics against official SEC filings before making investment decisions.

📋 Official Regulatory 10-K / 10-Q SEC Filings

Direct authenticated documentation links to audited SEC database reports for BYND.

SEC EDGAR Live Feed
Loading financial data and tables...
📁

SEC Filings (BYND)

© 2026 Stock Market Info — Beyond Meat, Inc. (BYND) Financial Profile