Caterpillar Inc.

Caterpillar Inc. (CAT) Market Cap

Caterpillar Inc. has a market capitalization of $375.33B.

Price: $814.81

5.67 (0.70%)

Market Cap: 375.33B

NYSE · time unavailable

CEO: Joseph E. Creed

Sector: Industrials

Industry: Agricultural - Machinery

IPO Date: 1929-12-02

Website: https://www.caterpillar.com

Caterpillar Inc. (CAT) - Company Information

Market Cap: 375.33B|Sector: Industrials

Company Profile

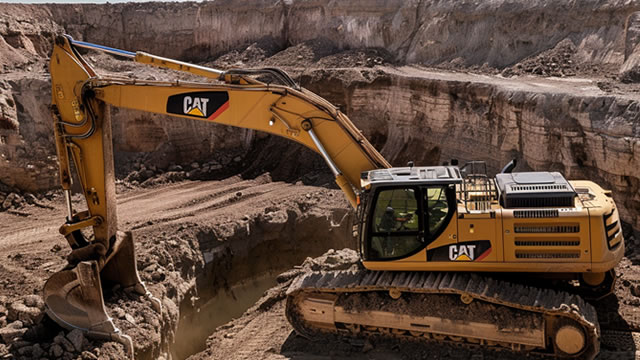
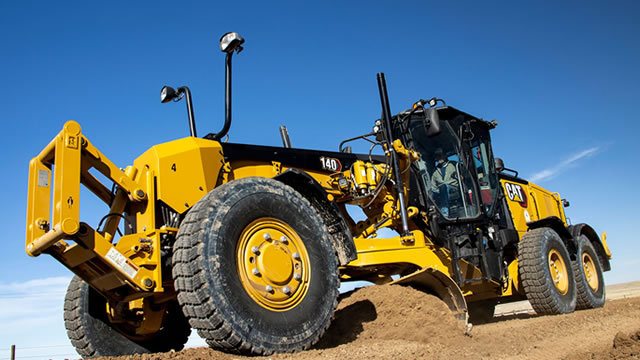
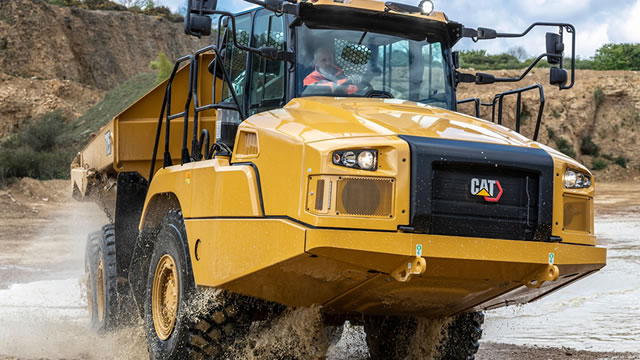
Caterpillar Inc., a global enterprise founded in 1925 and headquartered in Deerfield, Illinois (having previously operated as Caterpillar Tractor Co. until its rebranding in 1986), is a premier manufacturer and vendor of heavy construction and mining equipment, diesel and natural gas power units, and industrial gas turbines across the world. The company's extensive offerings are organized into several operational divisions: Construction Industries: This segment delivers a broad spectrum of machinery for construction projects, including asphalt pavers, versatile backhoe and skid steer loaders, various sizes of excavators (from compact to heavy-duty), compactors, road-building equipment like cold planers and motorgraders, pipelayers, site preparation tractors, telehandlers, and utility vehicles, alongside a range of wheel loaders and track-type equipment. Resource Industries: Dedicated to the mining sector, this division supplies powerful equipment such as electric rope and hydraulic shovels, draglines, rotary drills, specialized hard rock vehicles, and a diverse fleet of mining, off-highway, and articulated trucks. It also offers longwall miners, wheel dozers, fleet management systems, autonomous vehicle solutions, crucial machinery components, selected work tools, and comprehensive safety and performance solutions for mining operations. Energy & Transportation: This segment focuses on power generation and propulsion systems. It provides reciprocating engines, generator sets, integrated power solutions, industrial turbines and associated services, remanufactured engines and parts, centrifugal gas compressors, and diesel-electric locomotives with related components and services. These products serve critical sectors including marine, oil and gas, industrial applications, and electric power generation. Financial Products: This segment supports customers with a variety of financial services, such as operating and finance leases, installment sale agreements, working capital loans, and wholesale financing schemes. It also offers insurance and risk management products tailored for vehicles, power generation facilities, and marine vessels. All Other: This encompassing segment is responsible for manufacturing essential consumables and components like filters, fluids, undercarriage parts, and ground engaging tools.

Analyst Sentiment

63%
Buy

From 30 Active Polls

1Y Forecast: $943.33

▲ +15.8% Potential Upside

Consensus Target Metrics

Low Bound

$769

Median

$900

High Bound

$1218

Average

$943

Price & Moving Averages

Loading chart...

🎯 Wall Street Analyst Intelligence Report

1-Year structural target targets, chart projections, and sentiment maps.

Average 1Y Target
$943.33
▲ +15.77% Upside
Low Target
$769.00
-6% Risk
Median Target
$900.00
10% Mid
High Target
$1218.00
49% Max
Consensus
Buy
31 / 56 Buys

Consensus Trend Projection

Trailing closures vs. 12-month metrics map.

Analyst Vote Distribution

Aggregate institutional coverage sentiment weights.

📊 Historical Valuation Multiples

Real-time Trailing Twelve Month (TTM) momentum side-by-side with discrete quarterly metrics.

Fiscal QuarterTTMQ1 2026Q4 2025Q3 2025Q2 2025Q1 2025Q4 2024Q3 2024Q2 2024
Period EndingTrailing 12MMar 31, 2026Dec 31, 2025Sep 30, 2025Jun 30, 2025Mar 31, 2025Dec 31, 2024Sep 30, 2024Jun 30, 2024
Market Cap ($M)375,332328,300267,244223,592182,342156,622175,648189,380160,328
Enterprise Value ($M)414,326367,294300,594257,588217,648191,648207,168221,643193,298
Price to Earnings Ratio (P/E)40.3832.2027.8124.3920.9219.5415.6119.2114.96
Price/Earnings-to-Growth Ratio (PEG)3.283.781.2823.062.66
Price to Sales Ratio (P/S)5.3018.8513.9712.6811.0110.9910.8311.769.61
Price to Book Ratio (P/B)20.2317.5912.5410.829.778.679.019.769.36
Price to Free Cash Flow Ratio (P/FCF)32.78212.2284.9248.7284.15422.1674.5566.5469.65
Enterprise Value to Sales (EV/Sales)21.0915.7114.6013.1413.4512.7813.7611.58
Enterprise Value to EBITDA (EV/EBITDA)26.6193.2273.2863.5962.5659.4153.0558.8546.38
Debt to Equity Ratio2.502.312.032.012.182.141.971.952.18

📘 Full Research Report

ℹ️

AI-Generated Research: This report is for informational purposes only.

📘 CATERPILLAR INC (CAT) — Investment Overview

🧩 Business Model Overview

Caterpillar designs and manufactures heavy equipment used across construction, mining, and material handling. The value chain runs from (1) product engineering and manufacturing to (2) equipment sales to end customers and dealers, followed by (3) a durable aftermarket ecosystem: parts, maintenance, remanufacturing, diagnostics, and service contracts. A meaningful portion of lifetime value is earned after the initial sale because equipment fleets require recurring support and have long operating lives, creating ongoing demand for genuine parts, trained technicians, and turnaround capacity.

The company also monetizes usage and risk-management through financing and leasing via Caterpillar Financial Services, which improves customer affordability and can deepen customer relationships during fleet build-outs and replacements.

💰 Revenue Streams & Monetisation Model

Revenue is primarily driven by three channels:
  • Equipment sales (cyclical): Initial purchases of machinery and engines, exposed to construction and mining capex cycles.
  • Aftermarket (structurally resilient): Parts, service, and remanufacturing, supported by a large installed base and high replacement/maintenance requirements.
  • Financing/leasing (credit-linked): Portfolio income from customer financing, with returns influenced by credit performance and equipment resale dynamics.
Margin profile is shaped by the aftermarket mix: aftermarket demand tends to hold up better during downturns because fleets still need repairs and maintenance to remain operational. Parts and service also benefit from brand recognition in the field, a broad dealer/service footprint, and operational know-how that is difficult to replicate.

🧠 Competitive Advantages & Market Positioning

Caterpillar’s moat is most visible in its installed-base and service network economics, creating a durable “switching-cost” dynamic:
  • Switching costs / installed-base lock-in: Fleets built on CAT equipment create repeat demand for compatible parts, trained service, and validated repair workflows. Moving away from an installed fleet typically involves operational downtime, retraining, parts inventory changes, and reliability trade-offs.
  • Aftermarket distribution and service coverage: A global dealer and service model supports fast parts availability, preventive maintenance, and remanufacturing—an execution advantage during both high- and low-demand periods.
  • Economies of scale and manufacturing depth: Scale in component sourcing, process engineering, and platform standardization supports cost competitiveness across cycles.
  • Intangible assets: Field experience, durability engineering, and OEM validation for remanufacturing and diagnostics build credibility that dealers and customers rely on.
Competitive benchmarking (primary rivals):
  • Komatsu (Japan): strong product engineering and aftermarket capability, competing heavily in mining and construction equipment.
  • Deere (US): major presence in agricultural and select construction equipment, with a service model concentrated around different end markets.
  • Volvo Construction Equipment (Sweden/brands under Volvo umbrella): competes in construction equipment platforms and customer segments.
Caterpillar’s positioning differs from these rivals through its broad cross-segment footprint (construction, mining, and material handling) paired with a particularly deep aftermarket/service engine. Competitors can win equipment orders, but taking sustained share often requires matching installed-base service economics and dealer execution—barriers that rise as fleets scale and age.

🚀 Multi-Year Growth Drivers

Over a 5–10 year horizon, growth is driven by a mix of cycle-resistant themes and structural spend needs:
  • Infrastructure renewal and expansion: Public and private investment cycles in roads, ports, rail, energy networks, and urban development sustain demand for heavy equipment fleets and replacements.
  • Mining productivity requirements: As mines reach deeper, harder-to-access deposits, customers prioritize fleet uptime, operating cost reduction, and throughput—supporting aftermarket intensity and equipment upgrades.
  • Fleet replacement cycles: Long asset lives create recurring demand when equipment reaches economic end-of-life, with aftermarket durability and remanufacturing supporting customer lifetime value.
  • Electrification and technology enablement: Transition toward lower-emissions jobsite operations increases demand for advanced powertrain solutions, telematics, fleet management, and service diagnostics. This tends to expand the addressable aftermarket services layer for equipment operators.
  • Dealer-led capture of utilization economics: Better service responsiveness and maintenance planning increase uptime, reinforcing the value proposition of OEM-aligned service ecosystems.
TAM expansion is reinforced by global need for material handling, earthmoving, and productive capacity—while unit growth is typically moderated by replacement timing and investment cycles.

⚠ Risk Factors to Monitor

Key structural and operational risks include:
  • Cyclical capex exposure: Equipment demand correlates with construction and mining investment, which can compress volumes during credit tightening or commodity downcycles.
  • Capital intensity and execution risk: Manufacturing scale and product development require significant investment, increasing sensitivity to demand swings and cost inflation.
  • Technological disruption in propulsion and jobsite power: Electrification of equipment fleets and changes in operating models (including charging and duty-cycle requirements) could shift product economics and require rapid capability adaptation.
  • Competitive share gains during downturns: Rivals can use aggressive pricing or financing to win equipment orders, pressuring margins if the company’s mix does not compensate.
  • Credit and residual value risk: Financing/leasing returns depend on customer credit quality and equipment resale values, which can deteriorate in severe recessions.
  • Regulatory and trade exposure: Emissions regulations, safety requirements, and cross-border trade constraints can alter product costs and supply chain stability.

📊 Valuation & Market View

Market valuation for industrial OEMs like Caterpillar typically reflects a blend of:
  • Cycle-adjusted earnings power: Investors look at through-the-cycle profitability and operating leverage rather than spot results.
  • Aftermarket mix and durability: Higher aftermarket contribution can support more stable valuation multiples versus pure-equipment peers.
  • Cash flow generation: Free cash flow resilience and working-capital discipline matter given inventory and receivables dynamics across the cycle.
  • Financing earnings quality: Credit performance and portfolio risk shape perceived downside protection and risk-adjusted returns.
Drivers that tend to move the needle include the aftermarket share trend, sustainability of service margin structure, equipment order-to-cash efficiency, and the stability of financing losses and residual values.

🔍 Investment Takeaway

Caterpillar’s long-term investment case rests on a durable installed-base moat supported by aftermarket parts and service coverage, global dealer execution, and deep customer switching costs tied to fleet compatibility and operational uptime. While equipment demand remains cyclical, the company’s monetisation model—blending product sales with structurally supported aftermarket and credit-linked returns—can sustain attractive risk-adjusted performance across industrial cycles, provided execution remains strong and financing risk is managed prudently.

⚠ AI-generated — informational only. Validate using filings before investing.
📰 Market News & Coverage

15 Stories Available

Real-time institutional reporting and market updates for CAT.

fool.com2026-07-31

Caterpillar Will Remain an Important AI Stock for a Long Time

Power generators are a key part of AI data centers, and Caterpillar is one of the top providers. Companies also need Caterpillar's equipment to build the data centers.

zacks.com2026-07-31

Caterpillar is Set to Report Q2 Earnings: Buy, Sell or Hold the Stock?

Caterpillar Inc. CAT is expected to deliver year-over-year improvement in both earnings and revenues when it reports second-quarter 2026 results on August 4, before the opening bell.

invezz.com2026-07-31

Caterpillar stock has slumped: can earnings spark a rebound?

Caterpillar stock has pulled back substantially, moving from the year-to-date high of $1,073 to the current $809. It has dropped in the past six consecutive weeks, its longest streak in years.

defenseworld.net2026-07-31

2,312 Shares in Caterpillar Inc. $CAT Bought by BankChampaign National Association

BankChampaign National Association bought a new position in shares of Caterpillar Inc. (NYSE: CAT) during the first quarter, according to its most recent disclosure with the Securities and Exchange Commission. The fund bought 2,312 shares of the industrial products company's stock, valued at approximately $1,638,000. Caterpillar accounts for about 1.6% of BankChampaign National

defenseworld.net2026-07-31

Ashton Thomas Securities LLC Purchases 1,411 Shares of Caterpillar Inc. $CAT

Ashton Thomas Securities LLC raised its position in Caterpillar Inc. (NYSE: CAT) by 217.4% in the first quarter, according to the company in its most recent disclosure with the Securities and Exchange Commission (SEC). The fund owned 2,060 shares of the industrial products company's stock after acquiring an additional 1,411 shares during the

etftrends.com2026-07-30

Why an Aging Power Grid Is Fueling a New ETF Bet

Recent headlines about slowing AI spending and volatile tech stocks miss a bigger story. The U.S. power grid isn't ready for what's coming.

zacks.com2026-07-30

Unlocking Q2 Potential of Caterpillar (CAT): Exploring Wall Street Estimates for Key Metrics

Looking beyond Wall Street's top-and-bottom-line estimate forecasts for Caterpillar (CAT), delve into some of its key metrics to gain a deeper insight into the company's potential performance for the quarter ended June 2026.

fool.com2026-07-30

Here's Why Caterpillar Is a Buy Before Earnings

Caterpillar looks like a risky pre-earnings play, but the recent dip could prove inviting for long-term investors.

schaeffersresearch.com2026-07-29

The Week Ahead: Jobs Data, Top 10 Earnings Reports to Watch

Next week keeps up the earnings barrage, a heavy dose of earnings from some of the market's largest companies, led by pharma giant Eli Lilly (LLY) and industrial bellwether Caterpillar (CAT).

fool.com2026-07-29

Jensen Huang Says AI Needs "1,000 Times More Power Than We Currently Have." These 3 Industrial Stocks Will Deliver It.

The industry's biggest future bottleneck won't be memory chips but rather a lack of electricity.

gurufocus.com2026-07-29

Caterpillar Stock Drops 6.2% as Baird Cuts AI Outlook

Caterpillar (CAT), a manufacturer of construction, mining and power-generation equipment, fell approximately 6.2% in Wednesday's regular-session trading as of 1

fool.com2026-07-29

Is a Caterpillar Stock Split Inevitable?

Caterpillar reached a 52-week high of $1,073 per share in late June. The company is benefitting from AI infrastructure build-outs.

247wallst.com2026-07-29

Fast Money Host Warns Hyperscaler CapEx Binge Is ‘Issuing Near Junk’ as Data Center Buildout Shows Cracks

A Fast Money host is sounding alarms that the AI buildout is quietly cracking under the weight of debt that even the bond market seems reluctant to absorb, and the ripple effects could reach far beyond Silicon Valley balance sheets.

prnewswire.com2026-07-29

Caterpillar Invests in the Future of Manufacturing Talent in Illinois

Investment will focus on reducing barriers to training, defining in-demand skills for future jobs and connecting individuals to careers in manufacturing IRVING, Texas, July 29, 2026 /PRNewswire/ -- Caterpillar Inc. (NYSE: CAT) today announced the launch of its workforce commitment in Illinois, the most recent investment in its five-year, $100 million Building the Future Workforce Initiative. With an allocation of up to $10 million, the funding aims to prepare workers across Illinois for the modern manufacturing and industry technician jobs of the future.

benzinga.com2026-07-29

This Caterpillar Analyst Is No Longer Bullish; Here Are Top 5 Downgrades For Wednesday

Top Wall Street analysts changed their outlook on these top names. For a complete view of all analyst rating changes, including upgrades, downgrades and initiations, please see our analyst ratings page.

📊 AI Financial Analysis

Powered by StockMarketInfo
Earnings Data: Q Ending 2026-03-31

"CAT (Caterpillar) delivered Q1 2026 revenue of $17.415B and net income of $2.549B, with EPS of $5.50. On a YoY basis (vs Q1 2025), revenue rose +22.3% (from $14.249B) and net income rose +27.3% (from $2.003B). QoQ (vs Q4 2025), revenue declined -9.0% (from $19.133B) while net income edged down -6.2% (from $2.401B), consistent with seasonality/volume normalization. Profitability was mixed over the last four quarters: net margin increased to ~14.6% in Q1 2026 (from ~12.5% in Q4 2025), indicating margin expansion off a softer top line. Operating income fell QoQ ($3.085B vs $2.660B), and EBITDA improved to $3.680B. Cash flow quality remains strong: operating cash flow was $1.870B and free cash flow was $1.547B in Q1 2026, supported by net income but pressured by a sharp working-capital/investment cycle. Shareholder returns were substantial: Q1 2026 cash outflows included dividends of $0.703B and buybacks of $5.028B. Balance sheet resilience improved in liquidity terms—cash fell sequentially, but total assets were $95.55B and total equity remained stable at ~$18.66B. Total shareholder return is highly supportive given price momentum: the stock is up +173.9% YoY, far exceeding the >20% threshold."

Revenue Growth

Strong

YoY revenue growth of +22.3% in Q1 2026 (vs Q1 2025), but QoQ revenue declined -9.0% (vs Q4 2025), suggesting solid annual demand with seasonal softness.

Profitability

Good

Net income grew faster than revenue YoY (+27.3% net income vs +22.3% revenue). Net margin improved to ~14.6% in Q1 2026 from ~12.5% in Q4 2025, indicating margin expansion.

Cash Flow Quality

Good

Q1 2026 operating cash flow was $1.870B and free cash flow $1.547B. Sequentially weaker vs Q4 2025, but still positive alongside net income, dividends, and heavy buybacks.

Leverage & Balance Sheet

Good

Total assets were $95.55B with equity of ~$18.66B. Liquidity turned lower sequentially (cash down sharply), but the balance sheet shows no evidence of stress in equity levels.

Shareholder Returns

Excellent

Strong capital appreciation (+173.9% 1y_change) plus ongoing shareholder payouts (dividends of $703M and buybacks of $5.028B in Q1 2026).

Analyst Sentiment & Valuation

Good

Consensus target ($731.87) is below the current price context ($794.65), implying limited upside per analysts despite strong momentum; high momentum should support sentiment in the near term.

Disclaimer:This analysis is AI-generated for informational purposes only. Accuracy is not guaranteed and this does not constitute financial advice.

Fundamentals Overview

Loading fundamentals overview...

Caterpillar delivered a strong Q1 2026 start with $17.4B revenue (+22% YoY) and adjusted profit per share of $5.54 (+30%), alongside a record $63B backlog (+79% YoY). Margin rose only modestly (+30 bps to 18.0%) because tariff costs, while lower than January estimates, remain material ($600M in Q1; $2.2B-$2.4B expected full-year). By segment, Construction margin expanded (+160 bps) despite tariffs (~550 bps impact), while Power & Energy fell (-170 bps; tariffs ~270 bps impact) and Resource compressed sharply (-700 bps; tariffs ~500 bps impact) amid timing/volume and discount realization headwinds. Management raised full-year sales growth to low double digits and expects improved earnings versus January, supported by resilient end markets, robust order rates, and continued data-center prime power momentum. Capital returns are heavy ($5.7B deployed, including a $4.5B ASR), while the key strategic lever—nearly 3x reciprocating capacity by 2029—supports longer-term services and backlog visibility.

AI IconGrowth Catalysts

  • Pro Power agreement to provide up to 2.1 gigawatts of large gas generator sets for prime power (orders enter backlog on a rolling basis; deliveries expected over the next 5 years), supporting long-term services growth
  • Power generation demand strength: 48% sales growth driven by large gensets/turbines for data center prime power mix shift
  • CONEXPO launch of CAT compact streamlined customer experience to expand relevance in the compact equipment industry (aimed at CI 2030 target of 1.25x sales to users)
  • Large reciprocating engine capacity expansion scaling from 2x (2024 levels) to nearly 3x (to begin as soon as possible, primarily 2027-2029) supporting long-term backlog and services
  • Acquisition completion of RPMGlobal (mining software) to expand integrated solutions for mining safety/productivity

Business Development

  • Sixth Pro Power prime power agreement with at least 1 gigawatt of Caterpillar equipment for data center, oil and gas and industrial applications (specific customers not named)
  • RPMGlobal acquisition (mining software technology) completed in February

AI IconFinancial Highlights

  • Sales/revenues: $17.4B, up 22% YoY (in line with expectations); adjusted profit per share (EPS): $5.54, up 30% YoY (better than anticipated)
  • Backlog: $63B record level, up $28B (+79%) YoY; all 3 primary segments contributed to year-over-year and sequential backlog growth
  • Adjusted operating profit margin: 18.0%, only +30 bps YoY; stronger than expected mainly from favorable manufacturing costs including lower-than-anticipated tariff costs
  • Tariff costs introduced since beginning of 2025: approximately $600M in the quarter, favorable vs $800M January estimate (due to computation adjustment related to 2025 tariff costs); tariff cost benefit cited as about $0.31 to adjusted profit per share
  • Profit per share: $5.47 GAAP; adjusted profit per share $5.54 excluding restructuring costs ($0.07 vs $0.05 last year); discrete tax benefit of $0.15 in Q1
  • Segment margin bps: Power & Energy 170 bps decrease YoY (tariffs ~270 bps impact); Construction margin 160 bps increase YoY (tariffs ~550 bps impact); Resource margin 700 bps decrease YoY (tariffs ~500 bps impact plus lower-than-expected volume/discount timing affecting price realization)

AI IconCapital Funding

  • Shareholder deployment: $5.7B in Q1 via share repurchases and dividends
  • Share repurchases: $5.0B (after dividend payment), including $4.5B accelerated share repurchase (ASR) lasting up to 9 months
  • Cash/liquidity: enterprise cash balance $4.1B plus $1.3B in slightly longer-dated liquid marketable securities
  • MP&E free cash flow: nearly $600M in Q1 (about +$350M YoY); CapEx spend about $700M

AI IconStrategy & Ops

  • Operational transparency change: dealer inventory reporting now excludes total machines analysis; Power/Energy and Resource inventory changes treated as timing/commissioning pipeline rather than demand, while Construction inventory more reflective of lot availability
  • Capacity strategy: large reciprocating engine capacity increased from 2x 2024 levels to nearly 3x; additional investment primarily 2027-2029; MP&E capex expected to average 4%-5% of MP&E sales through 2030
  • Data center/prime power alignment: backlog growth tied to longer-term customer commitments, including orders extending into 2028
  • Technology investment drivers: higher SG&A and R&D expenses in Resource Industries tied to strategic technology investments, including autonomy

AI IconMarket Outlook

  • Full-year 2026 sales/revenues: low double-digit growth (increased vs prior quarter outlook)
  • Full-year adjusted operating profit margin: near bottom of target range including tariffs; top half excluding tariff costs; higher than January expectation due to improved outlook
  • Full-year 2026 tariff costs: $2.2B to $2.4B (vs $2.6B last quarter)
  • Q2 2026 tariff costs: ~ $700M (vs ~$400M last year); expected allocation: ~50% Construction Industries, 25% Power & Energy, 25% Resource Industries
  • Restructuring costs: approx. $300M to $350M for 2026
  • Estimated annual effective tax rate: ~23% for 2026 excluding discrete items
  • MP&E free cash flow: expected higher than $9.5B in 2025
  • CapEx forecast 2026: approx. $3.5B

AI IconRisks & Headwinds

  • Tariffs remain a fluid risk; although mitigation actions are ramping in back half of 2026, tariff cost estimates include $2.2B-$2.4B full-year and ~$700M for Q2
  • Geopolitical uncertainty and elevated energy prices increase operating volatility
  • Timing headwinds in demand/deliveries: Construction EAME sales to users slightly below expectations due to timing in key projects; Resource Industries sales to users +6% but below expectations primarily due to timing of customer deliveries; Asia/Pacific outside China about flat and below expectations due to timing of customer deliveries

Q&A: Analyst Interest

    Sentiment: POSITIVE

    Note: This summary was synthesized by AI from the CAT Q1 2026 earnings transcript. Financial data is complex; please verify all metrics against official SEC filings before making investment decisions.

    📋 Official Regulatory 10-K / 10-Q SEC Filings

    Direct authenticated documentation links to audited SEC database reports for CAT.

    SEC EDGAR Live Feed
    No recent 10-K available.
    No recent 10-Q available.
    Loading financial data and tables...
    📁

    SEC Filings (CAT)

    © 2026 Stock Market Info — Caterpillar Inc. (CAT) Financial Profile