Entegris, Inc.

Entegris, Inc. (ENTG) Market Cap

Entegris, Inc. has a market capitalization of .

No quote data available.

CEO: David W. Reeder

Sector: Technology

Industry: Semiconductors

IPO Date: 2000-07-11

Website: https://www.entegris.com

Entegris, Inc. (ENTG) - Company Information

Market Cap: -|Sector: Technology

Company Profile

Entegris, Inc. develops, manufactures, and supplies microcontamination control products, specialty chemicals, and advanced materials handling solutions in North America, Taiwan, China, South Korea, Japan, Europe, and Southeast Asia. It operates in three segments: Specialty Chemicals and Engineered Materials (SCEM); Microcontamination Control (MC); and Advanced Materials Handling (AMH). The SCEM segment offers high-performance and high-purity process chemistries, gases, and materials, as well as delivery systems to support semiconductor and other advanced manufacturing processes. The MC segment provides solutions to filter and purify critical liquid chemistries and gases used in semiconductor manufacturing processes and other high-technology industries. The AMH segment develops solutions to monitor, protect, transport, and deliver critical liquid chemistries, wafers, and other substrates for application in the semiconductor, life sciences, and other high-technology industries. The company's customers include logic and memory semiconductor device manufacturers, semiconductor equipment makers, gas and chemical manufacturing companies, and wafer grower companies; and flat panel display equipment makers, panel manufacturers, and manufacturers of hard disk drive components and devices, as well as their related ecosystems. It also serves manufacturers and suppliers in the solar industries, electrical discharge machining customers, glass and glass container manufacturers, aerospace manufacturers, and manufacturers of biomedical implantation devices. Entegris, Inc. was founded in 1966 and is headquartered in Billerica, Massachusetts.

Analyst Sentiment

67%
Buy

From 11 Active Polls

1Y Forecast: $152.71

▲ +0.0% Potential Upside

Consensus Target Metrics

Low Bound

$105

Median

$156

High Bound

$205

Average

$153

Price & Moving Averages

Loading chart...

🎯 Wall Street Analyst Intelligence Report

1-Year structural target targets, chart projections, and sentiment maps.

Average 1Y Target
$152.71
▲ +21.77% Upside
Low Target
$105.00
-16% Risk
Median Target
$156.00
24% Mid
High Target
$205.00
63% Max

Consensus Trend Projection

Trailing closures vs. 12-month metrics map.

Analyst Vote Distribution

Aggregate institutional coverage sentiment weights.

Sentiment volume allocation data unavailable.

Historical valuation matrix unavailable.

📘 Full Research Report

ℹ️

AI-Generated Research: This report is for informational purposes only.

📘 ENTEGRIS INC (ENTG) — Investment Overview

🧩 Business Model Overview

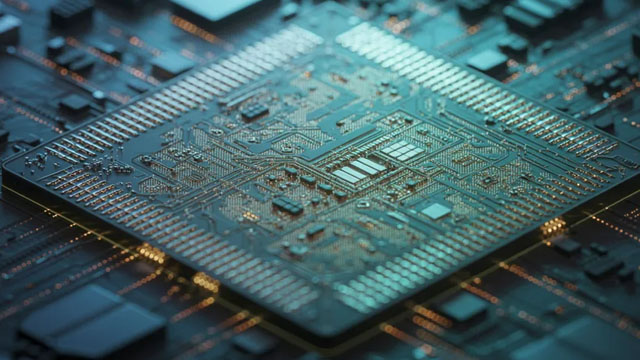
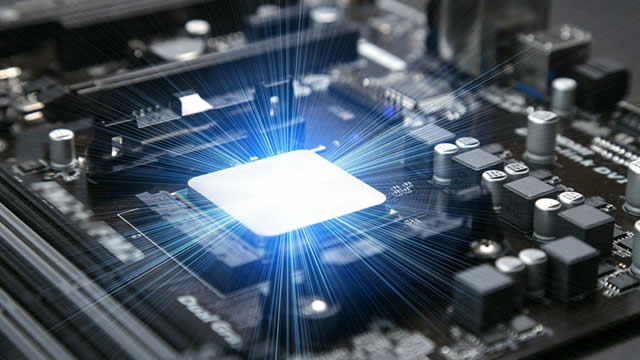
Entegris supplies engineered systems and process materials that help manufacturers control contamination and deliver chemicals with high precision. The value proposition is less about a single product and more about integrating components across the value chain of “how products are made”—from filtration and purification to precision dispensing, handling, and metrology/monitoring used in semiconductor fabs and other high-purity manufacturing environments.

In semiconductors, Entegris’ offerings typically support three recurring needs: (1) maintaining ultra-low particle and impurity levels, (2) enabling stable and repeatable delivery of specialty chemicals and gases, and (3) meeting strict cleanliness and reliability requirements during scaling to smaller geometries. Because fabs qualify components at a detailed engineering level, Entegris’ systems tend to become part of a production line’s established process flow.

💰 Revenue Streams & Monetisation Model

Revenue is driven primarily by semiconductor and advanced electronics end markets, complemented by Life Sciences and other high-purity applications. Monetisation occurs through a combination of:

  • Product sales (systems and consumables): engineered components used repeatedly in manufacturing steps (e.g., filtration, purification media, precision handling components).
  • Customer-driven build cycles: new fab qualification and expansion cycles create higher demand for qualified systems and supporting inventories.
  • Solution specialization: many items are customized to customer process requirements, supporting comparatively resilient margins versus commoditized filtration/handling categories.

Margin drivers are typically linked to (1) product mix toward engineered systems and mission-critical components, (2) sustained process performance requirements that reduce price competition, and (3) manufacturing execution in precision components where quality and yield matter to customers.

🧠 Competitive Advantages & Market Positioning

Entegris’ core moat is high switching costs and process qualification barriers, reinforced by technical know-how in contamination control. Semiconductor customers must validate materials, flow characteristics, and cleanliness performance to stringent specifications; once qualified, components often remain in place through multiple process generations.

This “qualification lock-in” functions similarly to switching costs, while Entegris’ ability to engineer for low-particle/low-impurity outcomes creates a differentiation that is difficult to replicate quickly—especially when process windows narrow with technology scaling.

  • Competitor 1: Parker Hannifin — competes in filtration and fluid handling solutions. Entegris tends to be more focused on semiconductor-specific contamination control and engineered process integration, rather than broad industrial fluid power coverage.
  • Competitor 2: Donaldson Company — competes in filtration technologies. Entegris’ differentiation is driven by semiconductor-grade performance requirements and application-specific qualification with process chemicals and gases.
  • Competitor 3: Mott Corporation — competes in porous materials and filtration. Entegris more directly ties these capabilities to complete manufacturing workflows (handling, purification/dispensing, and contamination control systems) for semiconductor and advanced electronics.

Compared with these rivals, Entegris’ market position is characterized by deeper semiconductor process alignment, which raises both switching friction (qualification effort and downtime risk) and the probability that Entegris becomes the “default” vendor for contamination-critical steps.

🚀 Multi-Year Growth Drivers

Over a 5–10 year horizon, growth prospects are supported by secular demand drivers that increase the importance of contamination control and precision chemical handling:

  • Semiconductor technology scaling: smaller geometries and more complex process stacks increase sensitivity to particles and trace impurities, sustaining the demand for higher-performance filtration, purification, and handling solutions.
  • Fab productivity requirements: production yields and defect control become more economically important, increasing the value of reliable, qualified process components.
  • Advanced packaging and heterogeneous integration: expanding process diversity increases the number of chemical-handling and contamination-critical steps across manufacturing lines.
  • Growth in high-purity manufacturing beyond semiconductors: Life Sciences and other industries that require stringent purity standards provide additional TAM for filtration and purification systems.

The TAM expansion is primarily “process-intensity-led” rather than purely “capex-led”: even when cycle timing changes, the directional requirement for contamination control becomes more stringent as manufacturing complexity increases.

⚠ Risk Factors to Monitor

  • Semiconductor cycle sensitivity: fab investment cycles can influence order timing and inventory build patterns, affecting near-term revenue visibility.
  • Customer qualification timelines: while qualification supports stickiness, it can also elongate the path from design wins to revenue realization.
  • Technology/process substitution risk: changes in manufacturing approaches (materials, chemistries, integration techniques) could alter specifications and demand for certain product categories.
  • Supply chain and quality execution: precision components require consistent manufacturing quality; any disruption can affect customer confidence and acceptance.
  • Competition and pricing pressure: vendors with overlapping capabilities may bid aggressively during certain procurement cycles, particularly where performance requirements overlap.

📊 Valuation & Market View

Market valuation for this type of industrial technology supplier is typically anchored to a blend of revenue durability, gross margin structure, and operating leverage as product mix shifts toward engineered, qualification-driven offerings. Analysts often compare performance using EV/EBITDA and P/S, with sensitivity to:

  • Growth rate and mix: differentiation that sustains pricing power and margin resilience.
  • Operating margin stability: evidence of scale benefits and disciplined cost structure.
  • End-market exposure: the extent of semiconductor-related revenue versus other high-purity applications.

🔍 Investment Takeaway

Entegris is positioned as a specialized supplier of contamination control and precision chemical handling for high-purity manufacturing. Its investment case centers on qualification-driven switching costs, engineered performance, and a product portfolio that aligns tightly with semiconductor process scaling and yield economics. The long-term thesis is that demand for low-particle/low-impurity manufacturing will keep increasing, and that Entegris’ process alignment makes market share gains more likely than “commodity-style” penetration by competitors.


⚠ AI-generated — informational only. Validate using filings before investing.

📊 AI Financial Analysis

Powered by StockMarketInfo
Earnings Data: Q Ending 2026-03-28

"ENTG reported Q1 2026 results with Revenue of $0.812B and Net Income of $92.0M (EPS $0.60). On a YoY basis, Revenue rose from $0.773B in Q1 2025 to $0.812B in Q1 2026 (+5.1%), while Net Income increased from $62.9M to $92.0M (+46.2%). QoQ, Revenue slightly declined from $0.824B in Q4 2025 to $0.812B (-1.5%), whereas Net Income improved from $49.4M to $92.0M (+86.2%). Profitability strengthened meaningfully: Q1 2026 net margin expanded to 11.3% from 6.0% in Q4 2025 and 8.1% in Q1 2025. Gross margin also improved to 46.9% in Q1 2026 versus 38.4% in Q4 2025 (and 46.1% in Q1 2025), indicating a more favorable cost/profit mix quarter-over-quarter. Operating income and EBITDA rose to $142M and $142M respectively. Cash generation remained solid: operating cash flow was $183M and free cash flow was also $183M in Q1 2026, with dividends paid of $15.4M. Balance sheet resilience looks stable with total assets of $8.48B and equity of $4.16B; leverage remains elevated (net debt ~$3.31B), but liquidity is strong (cash ~$443M; current ratio ~3.21). Shareholder returns appear very strong given the stock’s momentum (+116.1% 1-year). The dividend yield is modest, so the total-return profile is primarily capital appreciation. Analyst valuation context is supportive (consensus price target ~$139.8 vs current ~$146), implying limited upside versus the current run-rate."

Revenue Growth

Positive

Revenue was $811.9M in Q1 2026, +5.1% YoY (vs $773.2M) but -1.5% QoQ (vs $823.9M). Top-line is growing, but with minor sequential softness.

Profitability

Strong

Net margin jumped to 11.3% in Q1 2026 from 6.0% in Q4 2025 and 8.1% in Q1 2025. Net income +46.2% YoY and +86.2% QoQ indicate strong earnings leverage.

Cash Flow Quality

Good

Q1 2026 operating cash flow was $183M with free cash flow $183M (strong coverage vs net income). Dividends were $15.4M; no buybacks reported in the provided period.

Leverage & Balance Sheet

Positive

Total assets were $8.48B and equity $4.16B (higher than Q4 2025). Leverage remains meaningful (net debt ~$3.31B; debt-to-equity ~0.90), but liquidity is robust (current ratio ~3.21).

Shareholder Returns

Strong

1-year price momentum is very strong at +116.1%, which should dominate total returns. Dividend yield is low (~0.09%), so capital appreciation is the key driver.

Analyst Sentiment & Valuation

Positive

Consensus target (~$139.8) is slightly below the current price (~$146.1), suggesting valuation is not deeply discounted despite strong fundamentals.

Disclaimer:This analysis is AI-generated for informational purposes only. Accuracy is not guaranteed and this does not constitute financial advice.

Fundamentals Overview

Loading fundamentals overview...

ENTG delivered a solid Q1 2026 with revenue up 5% to $812M, and profitability beating guidance: GAAP/non-GAAP gross margin at 46.9% and non-GAAP EPS of $0.86. Management framed margins as structurally improving, while acknowledging normalization items (about 50 bps of one-time items in Q1 and a tax reserve release driving an anomalously low GAAP tax rate). Q2 guidance calls for gross margin 46.25%–47.25% and a non-GAAP tax rate normalizing to ~15%, while maintaining mid-single-digit demand visibility: MSI mid- to high single-digit for the rest of 2026 (75% of business) and improving fab/WFE spend (25%). The main operational lever is manufacturing network optimization (Chandler facility closure) and ongoing fixed-cost absorption as utilization rises; new facilities (KSP, Colorado) remain key short-term margin headwinds in 2026 but should improve by year-end and into 2027. Financially, free cash flow of $144M enabled continued deleveraging, targeting net leverage near ~3x by end-2026.

AI IconGrowth Catalysts

  • APS segment +7% YoY, driven by growth in liquid filtration, advanced deposition, and selective etch tied to new technology node ramps
  • Liquid filtration posted its third consecutive record quarter
  • DRAM AI-driven demand accelerating; expects DRAM capital investments to continue at pace to support accelerated DRAM MSI growth beyond 2026
  • 2nm ramp increasing in 2026, with expectation of strong growth in 2nm wafer output and higher Entegris content per wafer
  • NAND expected to improve in latter half of 2026 into 2027 as wafer starts improve; key NAND driver is layer scaling raising content per wafer

Business Development

    AI IconFinancial Highlights

    • Revenue $812M, +5% YoY and above midpoint of guidance range
    • Adjusted gross margin and non-GAAP EPS exceeded guidance; GAAP and non-GAAP gross margin 46.9% (both GAAP/non-GAAP) with ~50 bps of one-time items expected not to recur at similar levels
    • Q1 sequential gross margin improvement driven by productivity/efficiency, favorable product mix, and useful life accounting change
    • Adjusted EBITDA $226M, 27.8% of revenue; above guidance
    • Non-GAAP EPS $0.86 exceeded guidance range; GAAP diluted EPS $0.60
    • Tax: GAAP tax rate 1% vs non-GAAP 8% due to unforecasted release of a tax reserve
    • Q2 outlook: gross margin 46.25%–47.25% (GAAP and non-GAAP); >200 bps YoY improvement at midpoint; non-GAAP tax rate normalized to ~15%
    • Full-year 2026 modeling items: non-GAAP tax rate ~15%, CapEx $250M, depreciation ~ $140M, net interest slightly below $190M

    AI IconCapital Funding

    • Free cash flow $144M (~18% of sales) despite normal working-capital seasonality
    • Term loan repayment: reduced term loan by ~$50M in the quarter; total $300M reduction in 2025; ~$400M remaining term loan balance
    • Net debt $3.3B; net leverage 3.6x at quarter-end
    • Guidance/deleveraging target: reduce net leverage to ~3x by end of 2026

    AI IconStrategy & Ops

    • Closed another subscale manufacturing facility during Q1 in Chandler, Arizona; continuing manufacturing network optimization
    • Gross margin structural improvement expected to continue via simplifying/refining manufacturing network, higher productivity, fixed-cost absorption, and improved yields
    • Discussed facility dilutiveness: KSP dilutive in 2026 with expected break-even by year-end (+/−) and still dilutive in 2027 but less so (improving after exiting Q4 2026 run-rate into 2027); Colorado qualification this year with expectation of very little 2026 revenue and ramp starting early 2027
    • Measured pace for network optimization to balance order-book strength and customer lead-time needs

    AI IconMarket Outlook

    • Industry MSI growth: now expects mid- to high single-digit MSI growth for remainder of 2026 (correlates to ~75% of business)
    • MSI assumptions: improved DRAM outlook, similar unit outlook vs last quarter in advanced logic and NAND, and continued mixed outlook within mainstream logic
    • CapEx-related portion (~25% of business): increasing fab construction and WFE expectations throughout 2H 2026 contributing more meaningfully to growth profile; supports growth into 2027
    • Q2 sales guidance: $815M–$845M (approx +5% YoY at midpoint)
    • Q3 revenue: expect ~+5% sequential from midpoint of Q2 guidance range (visibility to be refined on Q2 call)
    • Investor Day: early November 2026 in New York City (save-the-date to follow)

    AI IconRisks & Headwinds

    • Mainstream/consumer electronics demand remains mixed due to memory availability and pricing pressuring price-sensitive computer products (offset by power management/data center strength and ancillary AI-related strength)
    • China: Q1 China modestly down; management attributed decline largely to CapEx-related order dislocations in H1 2025 tied to tariffs; expects solid H2 and solid 2026 China after normalizing
    • Potential macro/geopolitical supply-cost volatility: Iran-Middle East conflict causing early raw-material cost pressure (notably noble gases and resins); described as possibly temporary but could require pricing renegotiation if persistent
    • Operational ramp risk: new facilities (KSP and Colorado) are expected to be dilutive in 2026 (KSP toward end of year improves; Colorado ramp expected early 2027)

    Q&A: Analyst Interest

    • CapEx cycle timing and segment mix: Management explained how ~25% of revenue is CapEx-related (1/3 WFE, 2/3 fab construction) and described three demand waves after fab upcycles, mapping which Entegris product lines typically ramp at ~9–12, 12–18, and ~24 months post-groundbreaking.
    • Gross margin path and normalization: Analysts asked how gross margin evolves in 2H and 2027. Management stated Q1 gross margin 46.9% benefited from ~50 bps one-time items; normalized Q1 ~46.4%. They guided Q2 midpoint 46.75% with ~150 bps from useful-life change and ~125 bps from manufacturing improvements plus incremental staffing/project costs to enable future capacity.
    • Regional/regulatory demand softness and China dynamics: Asked about China competition and activity shifts. Management cited China modestly down in Q1, driven mainly by CapEx-related order patterns dislocated by tariffs in the first half of last year; excluding these, China would be more normal. They emphasized strong competitive position in filtration/franchise and expected solid 2H 2026.

    Sentiment: MIXED

    Note: This summary was synthesized by AI from the ENTG Q1 2026 earnings transcript. Financial data is complex; please verify all metrics against official SEC filings before making investment decisions.

    Loading financial data and tables...
    © 2026 Stock Market Info — Entegris, Inc. (ENTG) Financial Profile