Super Micro Computer, Inc.

Super Micro Computer, Inc. (SMCI) Market Cap

Super Micro Computer, Inc. has a market capitalization of $25.04B.

Price: $41.64

-5.26 (-11.22%)

Market Cap: 25.04B

NASDAQ · time unavailable

CEO: Charles Liang

Sector: Technology

Industry: Computer Hardware

IPO Date: 2007-03-29

Website: https://www.supermicro.com

Super Micro Computer, Inc. (SMCI) - Company Information

Market Cap: 25.04B|Sector: Technology

Company Profile

Super Micro Computer, Inc., together with its subsidiaries, develops and manufactures high performance server and storage solutions based on modular and open architecture in the United States, Europe, Asia, and internationally. Its solutions range from complete server, storage systems, modular blade servers, blades, workstations, full racks, networking devices, server sub-systems, server management software, and security software. The company provides application-optimized server solutions, rackmount and blade servers, storage, and subsystems and accessories; and server software management solutions, such as Server Management Suite, including Supermicro Server Manager, Supermicro Power Management software, Supermicro Update Manager, SuperCloud Composer, and SuperDoctor 5. In addition, it offers server subsystems and accessories comprising server boards, chassis, power supplies, and other accessories. Further, the company provides server and storage system integration, configuration, and software upgrade and update services; and technical documentation services, as well as identifies service requirements, creates and executes project plans, and conducts verification testing and technical documentation, and training services. Additionally, it offers help desk and on-site product support services for its server and storage systems; and customer support services, including ongoing maintenance and technical support for its products. The company provides its products to enterprise data centers, cloud computing, artificial intelligence, and 5G and edge computing markets. It sells its products through direct and indirect sales force, distributors, value-added resellers, system integrators, and original equipment manufacturers. The company was incorporated in 1993 and is headquartered in San Jose, California.

Analyst Sentiment

40%
Underperform

From 18 Active Polls

1Y Forecast: $38.60

▼ -7.3% Potential Upside

Consensus Target Metrics

Low Bound

$26

Median

$40

High Bound

$45

Average

$39

Price & Moving Averages

Loading chart...

🎯 Wall Street Analyst Intelligence Report

1-Year structural target targets, chart projections, and sentiment maps.

Average 1Y Target
$38.60
▼ -7.30% Upside
Low Target
$26.00
-38% Risk
Median Target
$40.00
-4% Mid
High Target
$45.00
8% Max
Consensus
Hold
8 / 22 Buys

Consensus Trend Projection

Trailing closures vs. 12-month metrics map.

Analyst Vote Distribution

Aggregate institutional coverage sentiment weights.

📊 Historical Valuation Multiples

Real-time Trailing Twelve Month (TTM) momentum side-by-side with discrete quarterly metrics.

Fiscal QuarterTTMQ1 2026Q4 2025Q3 2025Q2 2025Q1 2025Q4 2024Q3 2024Q2 2024
Period EndingTrailing 12MMar 31, 2026Dec 31, 2025Sep 30, 2025Jun 30, 2025Mar 31, 2025Dec 31, 2024Sep 30, 2024Jun 30, 2024
Market Cap ($M)25,04313,61517,46931,48129,29020,37418,06024,77848,129
Enterprise Value ($M)30,50719,07918,28732,09028,89920,34418,54524,95848,643
Price to Earnings Ratio (P/E)19.967.0410.9046.7737.5246.8314.0814.6040.48
Price/Earnings-to-Growth Ratio (PEG)0.071.491.34
Price to Sales Ratio (P/S)0.741.331.386.275.094.433.184.178.99
Price to Book Ratio (P/B)3.291.802.504.834.653.192.894.228.88
Price to Free Cash Flow Ratio (P/FCF)-3.66-2.03-387.17-33.1534.8334.30-67.5667.96-73.39
Enterprise Value to Sales (EV/Sales)1.861.446.405.024.423.274.209.08
Enterprise Value to EBITDA (EV/EBITDA)17.2927.3233.37126.29109.61141.6447.0747.22154.79
Debt to Equity Ratio3.100.890.700.740.760.390.310.390.40
⚠️

Valuation Model Suspended

API Payload Error: Inverted or negative baseline Free Cash Flow margin detected (-2.8%).

Troubleshooting Notice: The upstream financial data supplier has uploaded corrupted or inverted baseline metrics for SMCI. The server sandbox cannot calculate an intrinsic value path from negative cash generation baselines.

📘 Full Research Report

ℹ️

AI-Generated Research: This report is for informational purposes only.

📘 SUPER MICRO COMPUTER INC (SMCI) — Investment Overview

🧩 Business Model Overview

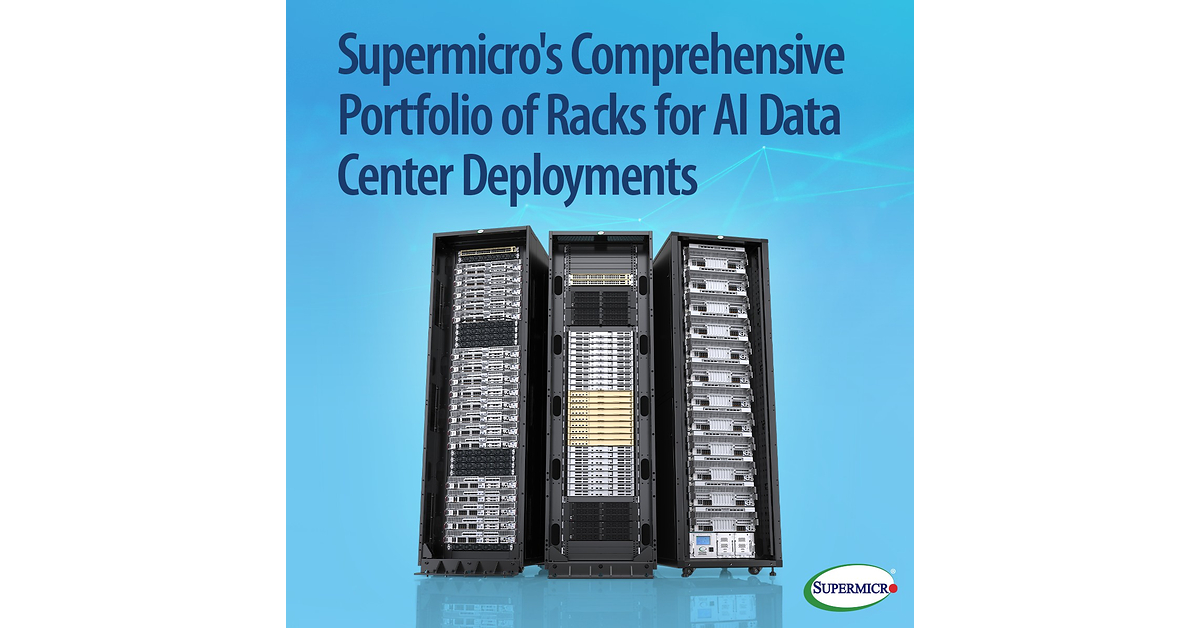
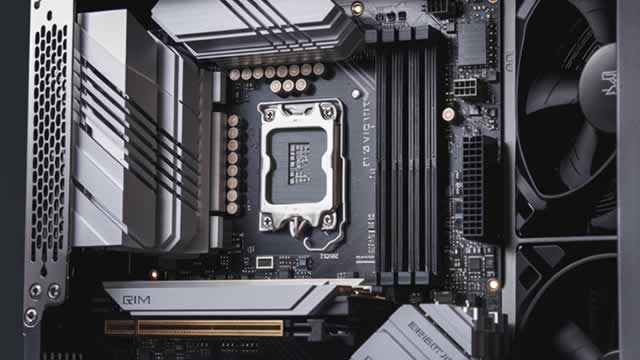
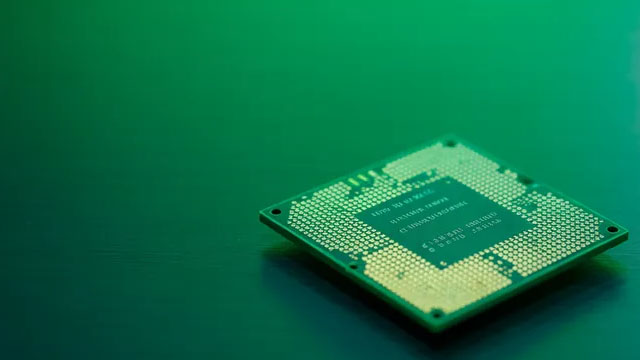
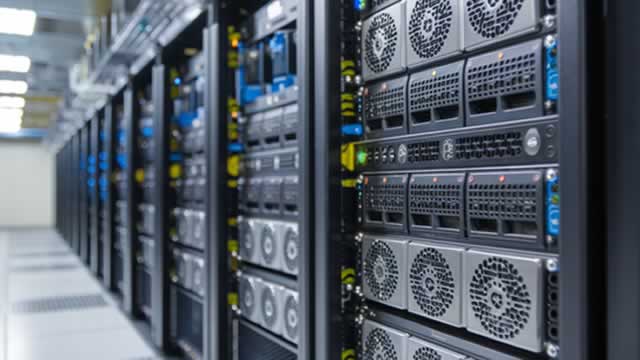
Super Micro Computer designs and manufactures server and storage systems for data centers, with a strong focus on high-density infrastructure used in cloud, enterprise, and AI workloads. The business model is built around taking widely adopted compute “building blocks” (CPUs, GPUs, networking, storage controllers) and integrating them into optimized, rack-scale platforms with platform-level engineering (thermal design, power delivery, backplanes, and system management).

Value creation sits at the intersection of (1) configurable system architecture aligned to major component roadmaps, (2) fast time-to-platform through ODM/OEM capabilities and flexible motherboard/system designs, and (3) the ability to deliver reference-like systems that customers can qualify quickly for large deployments. Customers typically purchase systems in project-based batches, but the qualification and integration process can create repeat demand for successive hardware refresh cycles.

💰 Revenue Streams & Monetisation Model

Revenue is primarily tied to the sale of servers, storage, and rack-optimized AI infrastructure. Monetisation is driven by system configuration choices (CPU/GPU mix, memory and storage density, networking enablement, and cooling/power design) and by the breadth of SKUs that allow matching platform performance to customer workload requirements.

Margins typically hinge on:

  • Gross margin mix across system configurations and component pricing dynamics.
  • System-level value capture from higher-density designs (e.g., efficient power/thermal architectures) that can command better ASPs and reduce customer engineering effort.
  • Build-to-order and component availability, which affects production efficiency and inventory risk.
  • Services contribution (where applicable) from warranty, maintenance, and systems management-related support, which generally provides a smaller but steadier earnings component versus base hardware sales.

🧠 Competitive Advantages & Market Positioning

SMCI’s strongest competitive positioning is rooted in an operational and ecosystem moat rather than long-dated proprietary software.

  • Cost/Execution advantage (scale-enabled platform engineering): Competitors face the challenge of designing and supplying high-density systems that remain aligned with rapidly changing GPU/CPU/network roadmaps. SMCI’s platform approach, broad SKU catalog, and engineering emphasis on power and thermal efficiency support competitive total system economics.
  • Switching friction via qualification and integration: Data center customers undertake rigorous qualification of servers (firmware, drivers, management tooling, rack/power integration, thermal behavior). Once an environment is validated, procurement often continues for subsequent refreshes—creating practical switching costs even without proprietary lock-in.
  • Component and vendor ecosystem alignment: SMCI’s value proposition depends on timely integration with leading compute and networking components. Strong relationships across the supply chain reduce lead-time and integration risk relative to smaller, less experienced system integrators.

Competitive benchmarking (primary rivals):

  • Dell Technologies and HP Enterprise (HPE): Broad enterprise/cloud server portfolios with extensive channel reach and integrated services. Their strength often lies in end-to-end enterprise solutions; SMCI typically differentiates through high-density, data-center-optimized system engineering.
  • Lenovo: Significant scale in enterprise hardware with robust OEM/ODM relationships. Lenovo competes strongly on breadth and deployment footprint; SMCI tends to focus more intensively on platform configurations suited to AI infrastructure requirements.
  • Inspur (and other China-based server OEMs): Competes on system scale and ODM/OEM manufacturing economics. SMCI’s positioning emphasizes rapid platform tailoring, thermals/power design for high utilization, and system-management maturity that supports large deployments.

Overall, SMCI’s “moat” is best characterized as a cost-and-execution advantage coupled with qualification-driven stickiness, rather than network effects or long-duration intangible asset protection.

🚀 Multi-Year Growth Drivers

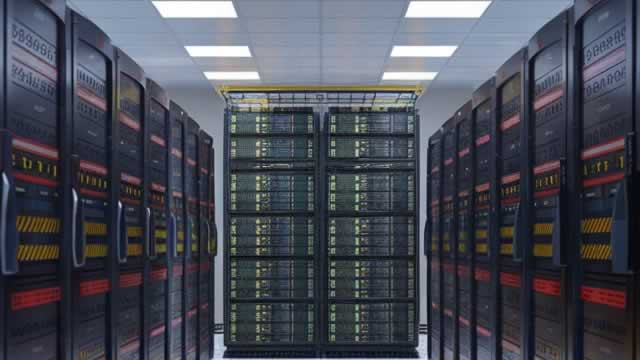
Over a 5–10 year horizon, SMCI’s addressable opportunity is tied to the expansion of compute infrastructure for AI training and inference, plus the operational constraints of running that compute inside power- and cooling-limited facilities.

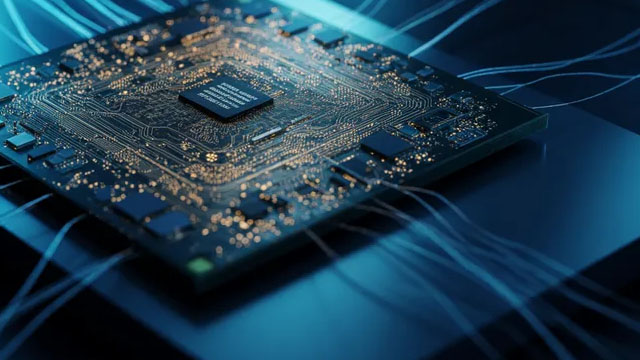
  • AI infrastructure buildout: Growth in accelerated compute deployments increases demand for servers and rack-scale systems that can sustain high utilization and manage thermal load efficiently.
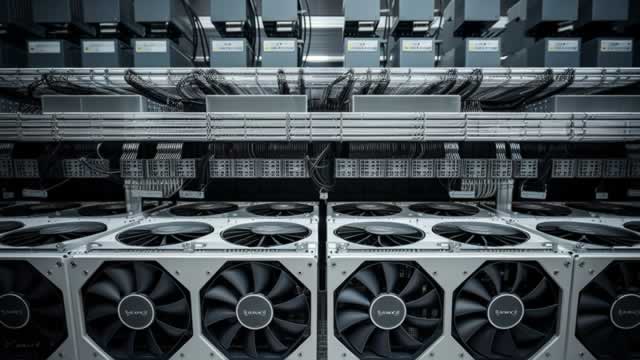
  • Energy efficiency and density optimization: As data centers push higher rack power and density, platform-level power delivery and thermal design become differentiators. Systems that reduce facility friction can support higher effective compute throughput per site.
  • Rack-scale standardization: Customers increasingly standardize on repeatable rack configurations for faster deployment. Systems integrators that provide configurable yet stable platforms can gain share as procurement cycles scale.
  • Global hyperscale and enterprise cloud capex: Continued migration to cloud and expansion of internal compute capacity extends demand beyond a single cycle.
  • Edge and distributed inference: While smaller than hyperscale deployments, distributed inference expands demand for efficient server and storage platforms optimized for constrained environments.

⚠ Risk Factors to Monitor

  • Component and supply-chain volatility: GPU/CPU/networking availability, lead times, and component pricing can pressure gross margins and working capital.
  • Inventory and demand forecasting risk: Hardware businesses face sharp swings in configuration mix; misalignment between builds and demand can lead to inventory write-downs or slower turns.
  • Concentration of large customer programs: Large deployments can drive revenue concentration, and procurement timing can influence results materially across cycles.
  • Competitive intensity: Enterprise server majors and aggressive ODM/OEM competitors can reallocate product focus quickly, especially around AI reference platforms.
  • Technological shift risk: Architectural changes in accelerators, memory hierarchies, interconnects, and thermal/power requirements can require continuous platform redesign.
  • Export controls and compliance: International sales may face changing regulatory restrictions on advanced computing components and end users.
  • Cybersecurity and systems-management assurance: As servers become more tightly managed, firmware and management software quality and security posture remain important to enterprise buyers.

📊 Valuation & Market View

The market typically values server and infrastructure hardware through growth and margin durability rather than long-duration recurring revenue models. Common valuation framing includes:

  • EV/EBITDA (or EV/EBITDA-like metrics): Sensitive to gross margin trends and operating leverage from revenue scaling.
  • P/S: Often used when earnings are volatile due to component cycle effects; it tends to reflect expectations for sustained demand and improving system mix.
  • Gross margin trajectory and mix: Investors generally monitor platform mix, service contribution, and supply-chain efficiency.

The key valuation drivers for SMCI usually center on: (1) whether high-density AI platforms support sustainable margin structure, (2) execution against product readiness aligned with major component roadmaps, and (3) disciplined working-capital management through demand variability.

🔍 Investment Takeaway

SMCI offers an institutional, infrastructure-focused investment thesis built on cost-efficient high-density platform engineering and qualification-driven customer stickiness. The multi-year opportunity rests on AI-driven compute expansion and data center constraints around power and thermals—areas where platform-level integration can translate into share gains and repeat deployments. The main offsets are hardware-cycle volatility, supply-chain sensitivity, and fast-moving competitive and technological change.


⚠ AI-generated — informational only. Validate using filings before investing.

📰 Market News & Coverage

15 Stories Available

Real-time institutional reporting and market updates for SMCI.

benzinga.com2026-06-05

3 Good AI Stocks to Take Profits On Right Now

On the surface, the artificial intelligence corner of the stock market appears robust right now, with the benchmark S&P Kensho Global Artificial Intelligence Enablers Index up 49.9% for the year to date, as of the first week of June.

gurufocus.com2026-06-05

Why Super Micro Stock Plummeting Today

Super Micro Computer (SMCI) fell about 10% on Friday after stronger U.S. payroll data lifted Treasury yields and kept rate-cut hopes under pressure, according t

247wallst.com2026-06-05

Live Nasdaq Composite: Chip Selloff and Rising Yields Weigh on Nasdaq After Jobs Report Stuns

Live Updates The analyst who called NVIDIA in 2010 just named his top 10 AI stocks This analyst's 2025 picks are up 106% on average. He just named his top 10 stocks to buy in 2026. Get them here FREE. SpaceX to the Moon 1 hour ago Live Morgan Stanley is making the case that... Live Nasdaq Composite: Chip Selloff and Rising Yields Weigh on Nasdaq After Jobs Report Stuns

marketbeat.com2026-06-04

The Great AI Server Rotation Puts Hewlett Packard Enterprise and Super Micro in Focus

Hewlett Packard Enterprise's NYSE: HPE blowout Q2 earnings and accelerated long-term targets expose a severe valuation mismatch in the artificial intelligence (AI) hardware sector as enterprise adoption broadens beyond hyperscalers.

zacks.com2026-06-04

Super Micro (SMCI) Up 36.8% Since Last Earnings Report: Can It Continue?

Super Micro (SMCI) reported earnings 30 days ago. What's next for the stock?

fool.com2026-06-04

Why Nano Nuclear Energy Powered 23.5% Higher in May

Investor enthusiasm soared after an early May announcement and sustained throughout the month.

schaeffersresearch.com2026-06-04

Futures Struggle for Direction as Semiconductor Stocks Retreat

Stock futures are mixed amid semiconductor, with the Nasdaq heading for chip stock-fueled selloff

fool.com2026-06-03

Why Super Micro Computer Stock Jumped 68% in May

The AI infrastructure provider is getting back to growth.

247wallst.com2026-06-03

Super Micro Computer Sinks 9%, Gorilla Technology Tumbles 20% Despite $2 Billion India AI Infrastructure Deal

Shares of Super Micro Computer (NASDAQ: SMCI) and Gorilla Technology Group (NASDAQ: GRRR) are both selling off hard in midday trading on Wednesday, June 3. SMCI stock is down 9% to $45.80, while GRRR stock has tumbled 20% to $17.45. The catalyst is, ironically, a positive one. Super Micro Computer and Gorilla Technology announced a roughly $2... Super Micro Computer Sinks 9%, Gorilla Technology Tumbles 20% Despite $2 Billion India AI Infrastructure Deal

prnewswire.com2026-06-02

Supermicro introduceert DCBBS-blauwdrukken voor NVIDIA Vera Rubin NVL72 en NVIDIA HGX™ Rubin NVL8, ontworpen voor schaalvergroting van 5 MW tot 1 GW als end-to-end totaaloplossing

End-to-end blauwdruk, schaalbaar van een vermogenscapaciteit van 5 MW tot 1 GW, inclusief volledige infrastructuur aan de faciliteitszijde voor implementaties

seekingalpha.com2026-06-02

Super Micro Computer, Inc. (SMCI) Presents at Bank of America 2026 Global Technology Conference Transcript

Super Micro Computer, Inc. (SMCI) Presents at Bank of America 2026 Global Technology Conference Transcript

gurufocus.com2026-06-02

Super Micro Jumps After $2 Billion AI Deal and Major Computex Unveils

Super Micro Computer (SMCI) shares jumped about 6% in Tuesday morning trading after investors reacted to a wave of AI-related product news and stronger signals

proactiveinvestors.com2026-06-02

Gorilla Technology closes $2B Supermicro AI supply deal in India

Gorilla Technology Group Inc. (NASDAQ:GRRR) has closed an artificial intelligence infrastructure supply arrangement valued at approximately $2 billion in India with Super Micro Computer Inc (NASDAQ:SMCI), covering delivery of 20,736 B300 cards, 5,120 B200 cards, networking equipment and related infrastructure to support Gorilla's Yotta AI project. The San Jose- and London-headquartered company said the arrangement underpins deployments tied to large-scale AI data center and GPU programs in India, including hyperscale and sovereign AI initiatives.

fool.com2026-06-02

Why Super Micro Stock Just Popped

Super Micro stock costs a fraction of what investors pay for HPE, and less than half the cost of Dell stock.

seekingalpha.com2026-06-02

Super Micro's Next Chapter Is Bigger Than Servers

Super Micro's Vera Rubin and DCBBS strategy position the company closer to the next AI infrastructure spending cycle. Q3 gross margin recovered to 10.1%, while enterprise revenue mix increased from 15% to 28%. Management expects DCBBS to contribute roughly 25% of profitability, supporting future margin expansion and earnings quality.

📊 AI Financial Analysis

Powered by StockMarketInfo
Earnings Data: Q Ending 2026-03-31

"SMCI reported Q3’26 revenue of $10.24B and net income of $1.02B (EPS $0.81). On a YoY basis, revenue fell vs Q3’25 ($10.24B vs $4.60B), implying strong YoY growth of ~+122%, while net income increased ($1.02B vs $0.109B), or ~+834%. Sequentially (QoQ), results weakened: revenue declined from Q2’26 ($12.68B to $10.24B), about -19%, and net income dropped from $400.6M to $1.02B, which is +154% QoQ. Profitability improved over the last reported quarter versus both prior periods’ profitability levels: net margin in Q3’26 was ~9.93% versus ~3.16% in Q2’26 and ~2.36% in Q3’25. Gross margin also rose to ~9.95% from ~6.30% in Q2’26 and ~9.57% in Q3’25, indicating margin expansion. Cash flow quality deteriorated sharply in Q3’26: operating cash flow was -$6.62B and free cash flow was -$6.70B, driven by a major working-capital drag (especially payables/inventory/receivables movements). Despite this, the balance sheet appears resilient with total assets of ~$23.45B and equity of ~$7.58B. Total shareholder returns likely remain mixed given the market performance is down over the last year (1y_change -10.44%) and no dividend is indicated; no buybacks/dividends were recorded in this quarter."

Revenue Growth

Good

YoY revenue rose sharply (~+122% vs 2025-03-31), but QoQ revenue declined (~-19% vs 2025-12-31), indicating volatility in the demand and shipment cadence.

Profitability

Good

Margins expanded materially in the latest quarter: net margin ~9.93% vs ~3.16% QoQ and ~2.36% YoY; EPS increased to $0.81 from $0.67 (QoQ) and $0.18 (YoY).

Cash Flow Quality

Neutral

Operating cash flow swung to -$6.62B and free cash flow to -$6.70B in Q3’26, a major deterioration vs prior quarters; working capital was a primary driver.

Leverage & Balance Sheet

Neutral

Total assets increased to ~$23.45B with equity stable at ~$7.58B. Leverage remains meaningful (total debt ~$6.75B; net debt ~$5.46B), but the capital base is intact.

Shareholder Returns

Caution

Market performance is negative over 1Y (-10.44%) and no dividends are shown. Buybacks are not evident in Q3’26 (repurchases = 0), limiting capital return visibility.

Analyst Sentiment & Valuation

Fair

With price ~$28.56 and consensus target ~$40.2, there is implied upside (~+41%). However, 1Y price momentum is weak, tempering enthusiasm.

Disclaimer:This analysis is AI-generated for informational purposes only. Accuracy is not guaranteed and this does not constitute financial advice.

Fundamentals Overview

Loading fundamentals overview...

SMCI delivered a sharp non-GAAP gross margin rebound in Q3 FY26 to 10.1% (+370 bps vs Q2’s 6.4%), supported by mix improvements and lower tariff/expedite/reserve pressure. However, revenue of $10.2B (-19% QoQ) still reflected customer site readiness delays, pushing some revenue into later quarters; management reiterated backlog at record levels and expects deferred revenue recognition when customer deployments complete. Operating leverage partially benefited from higher enterprise-channel penetration (28% of revenue vs 15% prior quarter). On Q4 guidance, the company expects gross margin to step down to 8.2%-8.4% due to customer mix, even as AI GPU-related platforms remain >80% of revenue. Financial risk shifted to liquidity/working capital: cash used in operations was -$6.6B, cash conversion cycle rose to 106 days, inventory climbed to $11.1B, and net debt surged to $7.5B. Compliances/investigations are ongoing, but management said no restatement is expected as of now.

AI IconGrowth Catalysts

  • Gross margin recovery to 10.1% non-GAAP; +370 bps vs Q2 non-GAAP 6.4%
  • Direct Liquid Cooling (DLC) optimization to improve time-to-online (TTO) for AI data center buildouts
  • NeoCloud / sovereign AI / Agent AI demand strength and AI GPU platforms driving scale
  • Data Center Building Block Solutions (DCBBS) expansion with end-to-end offerings (cooling, networking, power, management software, services)
  • Software traction: SuperCloud Composer revenue growing from <$10M/quarter to $34M last quarter and >$46M booked for this quarter

Business Development

  • NVIDIA partnership: shipping rack-scale systems including GB300 NVL72 (MNB-300 HGXQ), B200 NVL4, and inferencing RTX-optimized product lines
  • Preparing early availability for Vera Rubin systems (NVL72 SuperCluster)
  • AMD momentum: MI350 platform momentum; preparation for next-gen AMD Helios (EPYC Venice and MI400 series)
  • Intel and Arm collaboration: Xeon 6+ platform development and Arm AGI GPU-based solutions for agentic AI workloads
  • Broadcom referenced as an ongoing vendor relationship

AI IconFinancial Highlights

  • Revenue: $10.2B (+123% YoY, -19% QoQ); impacted by customer site readiness delay and industry component constraints (CPU/GPU/memory)
  • Non-GAAP gross margin: 10.1% vs 6.4% in Q2 = +370 bps; attributed to customer/product mix plus lower tariffs, expedite fees, and reduced inventory reserve charges
  • GAAP diluted EPS: $0.72 vs guidance at least $0.52; non-GAAP diluted EPS: $0.84 vs guidance at least $0.60
  • GAAP operating expenses: $393M (+34% YoY, +21% QoQ); non-GAAP operating expenses: $278M (+29% YoY, +16% QoQ; driven by higher headcount-related expenses
  • Tax: GAAP tax rate 20.8%, non-GAAP tax rate 21.1% (Q3 tax provision $127M GAAP; $156M non-GAAP)
  • Working capital deterioration: cash conversion cycle increased to 106 days (from 54); inventory days +43 to 106; DSO +36 to 85; DPO +27 to 85

AI IconCapital Funding

  • Operating cash flow: -$6.6B (vs -$24M prior quarter); key drivers: reduction of $10B in accounts payable, +$581M inventory, partially offset by -$2.6B accounts receivable
  • Closing inventory: $11.1B vs $10.6B (Q2)
  • CapEx: $80M; free cash flow: -$6.7B for the quarter
  • Cash position: $1.3B at quarter end
  • Net debt: $7.5B vs $787M net debt in prior quarter (bank + convertible note debt $8.8B)
  • Liquidity actions: set up and commenced usage of $1.8B Taiwan revolving credit facility; used U.S. revolving credit facility and nonrecourse AR sale facility

AI IconStrategy & Ops

  • Backlog: stated as at another record high; orders driven by AI infrastructure demand with AI GPU-related platforms contributing >80% of revenue
  • Enterprise mix shift: enterprise channel revenue $2.8B = 28% of revenue vs 15% in prior quarter; enterprise up 46% YoY and 45% QoQ
  • OEM appliance / large data center mix: $7.4B = 72% of revenue vs 85% prior quarter (up 183% YoY, -31% QoQ)
  • Supply chain / margin protection: managed inventory dynamically; took actions to reduce tariff-related cost pressure
  • Manufacturing/automation: advancing DFM and more factory automation to improve yield and build products faster
  • Capacity expansions: Taiwan, Malaysia, Netherlands ramping; new Silicon Valley DCBBS campus ~1 mile from HQ with 8 new buildings; DLC-2 clean room and advanced optical photonics-based device validation/production facilities
  • Production run-rate target: on track to produce >6,000 racks per month (AOR rack referenced in transcript)

AI IconMarket Outlook

  • Q4 FY2026 net sales: $11.0B to $12.5B
  • Q4 FY2026 EPS: GAAP diluted $0.53 to $0.67; non-GAAP diluted $0.65 to $0.79
  • Q4 FY2026 gross margin: 8.2% to 8.4% (expected customer mix)
  • Q4 FY2026 GAAP operating expenses: ~ $433M (includes ~$114M stock-based comp excluded from non-GAAP); other income/expense net expense ~$36M
  • Q4 tax assumptions: GAAP 19.4%, non-GAAP 20.4%; share count assumption: GAAP 695M, non-GAAP 712M
  • Q4 CapEx: $30M to $50M; FY2026 net sales target: $38.9B to $40.4B

AI IconRisks & Headwinds

  • Revenue pushout risk: $10.2B quarter impacted by customer site readiness; management expects deferred revenue recognized in coming quarters but timing depends on customer readiness
  • Gross margin volatility: Q4 guidance implies pullback to 8.2%-8.4% from Q3 10.1% non-GAAP despite recent recovery
  • Component shortages: stated industry-wide constraints in CPU, GPU, memory; management noted memory/SSD prices more than triple and Intel CPU shortages; duration uncertain
  • Working capital stress: cash conversion cycle rose to 106 days with higher DSO and inventory days; net debt increased sharply to $7.5B
  • Export/compliance headline risk: DOJ indictment/alleged diversion to China of certain products; investigations ongoing and could affect filings/operations (though management stated no restatement expected as of then)

Q&A: Analyst Interest

  • Investigation/export-control overhang: Management explained the company was surprised/disappointed by alleged diversion to China of certain products, stated independent directors hired Munger, Tolles & Olson and AlixPartners, said no company employees beyond named DOJ-indicted individuals were involved, and emphasized no restatement expected and preparation for 10-Q pending BDO review.
  • DCBBS contribution and margin drivers: Analysts asked how DCBBS profit contribution evolved versus prior commentary (first-half ~4%). Management declined detailed quarterly percentage but reiterated DCBBS traction and expected at least 20% of net income from DCBBS (including management software) within two years; also tied margins to DCBBS mix and enterprise focus.
  • Working capital and customer readiness effects: Management confirmed deferred revenue timing depends on when customers/data centers are ready, with uncertain split between June vs September. For working capital, they linked GPU/rack transitions to capital needs being manageable under steady growth, but cautioned capital markets might be needed if growth accelerates sharply.

Sentiment: MIXED

Note: This summary was synthesized by AI from the SMCI Q3 2026 (ended March 31, 2026) earnings transcript. Financial data is complex; please verify all metrics against official SEC filings before making investment decisions.

📋 Official Regulatory 10-K / 10-Q SEC Filings

Direct authenticated documentation links to audited SEC database reports for SMCI.

SEC EDGAR Live Feed
Loading financial data and tables...
📁

SEC Filings (SMCI)

© 2026 Stock Market Info — Super Micro Computer, Inc. (SMCI) Financial Profile