Marathon Petroleum Corporation

Marathon Petroleum Corporation (MPC) Market Cap

Marathon Petroleum Corporation has a market capitalization of $76.49B.

Price: $262.01

β–Ό -5.04 (-1.89%)

Market Cap: 76.49B

NYSE Β· time unavailable

CEO: Maryann T. Mannen

Sector: Energy

Industry: Oil & Gas Refining & Marketing

IPO Date: 2011-06-24

Website: https://www.marathonpetroleum.com

Marathon Petroleum Corporation (MPC) - Company Information

Market Cap: 76.49B|Sector: Energy

Company Profile

Marathon Petroleum Corporation, together with its subsidiaries, operates as an integrated downstream energy company primarily in the United States. It operates in two segments, Refining & Marketing, and Midstream. The Refining & Marketing segment refines crude oil and other feedstocks at its refineries in the Gulf Coast, Mid-Continent, and West Coast regions of the United States; and purchases refined products and ethanol for resale. Its refined products include transportation fuels, such as reformulated gasolines and blend-grade gasolines; heavy fuel oil; and asphalt. This segment also manufactures aromatics, propane, propylene, and sulfur. It sells refined products to wholesale marketing customers in the United States and internationally, buyers on the spot market, and independent entrepreneurs who operate primarily Marathon branded outlets, as well as through long-term fuel supply contracts to direct dealer locations primarily under the ARCO brand. The Midstream segment transports, stores, distributes, and markets crude oil and refined products through refining logistics assets, pipelines, terminals, towboats, and barges; gathers, processes, and transports natural gas; and gathers, transports, fractionates, stores, and markets natural gas liquids. As of December 31, 2021, the company operated 7,159 brand jobber outlets in 37 states, the District of Columbia, and Mexico through independent entrepreneurs. Marathon Petroleum Corporation was founded in 1887 and is headquartered in Findlay, Ohio.

Analyst Sentiment

52%
Hold

From 19 Active Polls

1Y Forecast: $239.50

β–Ό -8.6% Potential Upside

Consensus Target Metrics

Low Bound

$174

Median

$231

High Bound

$285

Average

$240

Price & Moving Averages

Loading chart...

🎯 Wall Street Analyst Intelligence Report

1-Year structural target targets, chart projections, and sentiment maps.

Average 1Y Target
$239.50
β–Ό -8.59% Upside
Low Target
$174.00
-34% Risk
Median Target
$230.50
-12% Mid
High Target
$285.00
9% Max
Consensus
Buy
25 / 33 Buys

Consensus Trend Projection

Trailing closures vs. 12-month metrics map.

Analyst Vote Distribution

Aggregate institutional coverage sentiment weights.

πŸ“Š Historical Valuation Multiples

Real-time Trailing Twelve Month (TTM) momentum side-by-side with discrete quarterly metrics.

Fiscal QuarterTTMQ1 2026Q4 2025Q3 2025Q2 2025Q1 2025Q4 2024Q3 2024Q2 2024
Period EndingTrailing 12MMar 31, 2026Dec 31, 2025Sep 30, 2025Jun 30, 2025Mar 31, 2025Dec 31, 2024Sep 30, 2024Jun 30, 2024
Market Cap ($M)76,49072,03348,62658,40051,32845,60144,64053,92361,002
Enterprise Value ($M)108,665104,20879,31289,94979,69073,92670,18879,31786,672
Price to Earnings Ratio (P/E)16.6935.247.9210.6610.55-154.0630.0821.6710.07
Price/Earnings-to-Growth Ratio (PEG)β€”5.76β€”3.571.46β€”β€”β€”0.63
Price to Sales Ratio (P/S)0.562.081.491.681.521.451.351.541.61
Price to Book Ratio (P/B)4.614.302.813.423.092.782.522.852.86
Price to Free Cash Flow Ratio (P/FCF)13.41346.3125.7635.1426.40-62.7231.9552.2022.14
Enterprise Value to Sales (EV/Sales)β€”3.012.432.582.362.352.122.262.29
Enterprise Value to EBITDA (EV/EBITDA)8.7747.0922.1625.0926.4848.9633.9734.3224.81
Debt to Equity Ratio2.602.051.982.001.811.961.621.551.41

⚑ MPC Growth Runway Model

Standard long term linear growth fade

Multi-Stage Discounted Cash Flow Sandbox

Market Price$262.01
Intrinsic Value$462.15
Market Alignment
Undervalued by 76.4%relative to calculated intrinsic value
9.00%
Exp: 5%5%
i

Growth runway slowdown

This value provides a time window for the growth rate to decline beyond Stage 1 toward the terminal rate. Longer windows are most useful for companies with high growth starting conditions or strong competitive advantages. This option stretches out the growth rate slowdown across 5, 10, or 15-year steps. A high-growth starting condition (exceeding a 25% initial growth rate) automatically applies a curve decay to simulate realistic, rapid market saturation.
i

Terminal growth rate

With long-term inflation between 3-5%, revenue must grow by that baseline to maintain flat real-world market share. This value sets the permanent terminal growth rate to factor into the valuation beyond the growth slowdown runway toward maturity.

3-Stage Financial Runway Horizon

🧠 Perpetuity Horizon Engine (Stage 3: Post-2035)

Terminal FCF Base$12.38B
Perpetuity TV Value$232.88B
Discounted TV (PV)$98.37B
TV Weighting %60.5%
⚠️
Financial Model Disclaimer & Risk Disclosure: This interactive scenario simulator is an educational sandbox provided strictly for informational and analytical research purposes. Core historical financial statements and consensus estimates are sourced directly via Financial Modeling Prep (FMP). All downstream outputs are entirely deterministic, hypothetical projections generated by combining automated mathematical formulas (including linear interpolation and Gaussian bell-curve decay models) with user-selected variables and third-party financial data inputs. Users assume all liability for trading decisions executed based on these sandbox calculations.

πŸ“˜ Full Research Report

ℹ️

AI-Generated Research: This report is for informational purposes only.

πŸ“˜ MARATHON PETROLEUM CORP (MPC) β€” Investment Overview

🧩 Business Model Overview

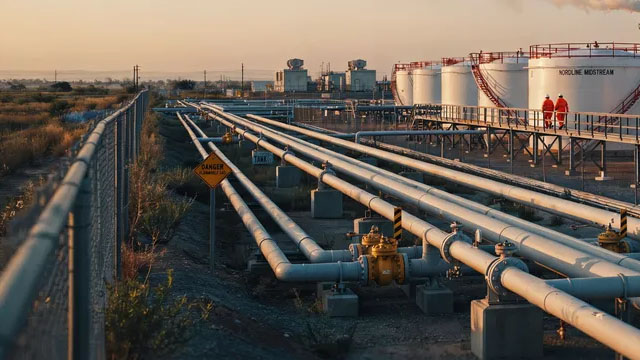
Marathon Petroleum Corp operates an integrated North American energy value chain: (1) upstream production of crude oil and related hydrocarbons, (2) refining of crude into transportation and industrial fuels, and (3) marketing/distribution of refined products through logistics assets and customer channels.

This structure matters because it links the cost of feedstock (crude and liquids) to the value of outputs (refined products) within the same geography and operational footprint. The refining and marketing segments monetize commodity-linked spreads, while the upstream segment provides both volume and input flexibility. Logistics assets (pipelines, terminals, and refinery-to-market connections) reduce the marginal cost and downtime associated with moving products to demand centers.

πŸ’° Revenue Streams & Monetisation Model

Revenue is primarily generated through three channels:

  • Refining throughput and product sales: monetization centers on refining margins (the spread between crude feedstock costs and refined product realizations), driven by product yield quality, refinery reliability, and pricing differentials.
  • Upstream production and commodity sales: crude and NGL-related volumes generate revenue directly tied to commodity prices, with realized economics influenced by operating performance and differential pricing.
  • Marketing and distribution: refined product sales to commercial and industrial customers, supported by distribution networks; margins reflect the ability to capture regional pricing while managing supply costs and logistics constraints.

Margin structure is cyclical at the commodity level, but company-level drivers tend to be structural: refinery utilization and reliability, maintenance discipline, feedstock selection, and logistical efficiency that reduces basis and transportation costs.

🧠 Competitive Advantages & Market Positioning

MPC’s durability is less about proprietary technology and more about geographic cost advantage and logistical infrastructure moats. The core economics rely on staying positioned close to both low-cost feedstock sources and stable demand centers.

  • Low-Cost Feedstock & Operational Integration: proximity to North American crude supply and the ability to align crude sourcing with refinery configuration can reduce input-cost volatility relative to players dependent on longer-haul or less-flexible supply chains.
  • Logistical Infrastructure (Pipelines/Terminals/Refinery Connectivity): transportation and storage assets create practical barriers to entry by lowering the installed cost to serve specific markets and improving reliability of product movement.
  • Scale and Throughput Reliability: large, complex refinery operations reward disciplined maintenance and process capability; competitors face higher friction in matching consistently high utilization and product slate optimization.

Competitive benchmarking (industry focus contrast):

  • Valero Energy (refining-led, global scale): similarly benefits from large-scale refining and logistics; however, MPC’s integrated North American footprint and feedstock/refining alignment emphasize regional execution and infrastructure depth.
  • Phillips 66 (refining and midstream emphasis): competes on refining economics and logistics; MPC’s advantage is reinforced by upstream-to-downstream integration and the ability to manage crude and product flows within its geographic network.
  • PBF Energy (refining focus, select downstream assets): competes on refining margins and operational performance; MPC’s infrastructure breadth and integration can support more resilient supply and distribution economics across product cycles.

πŸš€ Multi-Year Growth Drivers

Longer-duration growth in refining and logistics is typically driven by operating improvements and capital allocation discipline rather than guaranteed volume expansion. The most relevant multi-year drivers include:

  • Resilient demand for refined products: transportation fuels, industrial uses, and heating requirements sustain a base level of demand even as the energy transition evolves.
  • Refinery optimization and feedstock flexibility: continual improvement in reliability, turnaround planning, and product yield supports higher netbacks when industry margins are favorable and helps protect margins during weaker cycles.
  • Infrastructure and logistics utilization: pipeline and terminal networks tend to monetize through recurring throughput needs; incremental value can come from better scheduling, reduced downtime, and improved market access.
  • Selective capital allocation: disciplined maintenance and targeted upgrades can sustain competitive throughput economics relative to peers and preserve asset life in a capital-intensive industry.

The β€œTAM expansion” lens for MPC is not user-count growth but rather value capture within a mature systemβ€”maintaining or improving the share of industry refining margin that accrues to well-positioned, logistically advantaged assets.

⚠ Risk Factors to Monitor

  • Commodity and spread risk: refining margins and crude differentials drive earnings volatility; unfavorable cracks or sustained feedstock/output pricing dislocation can pressure cash flows.
  • Regulatory and environmental compliance: emissions rules, product specifications, and permitting can raise sustaining capex and introduce operational constraints.
  • Capital intensity and execution risk: maintaining complex assets and funding upgrades require disciplined capex planning; execution delays can affect utilization and unit costs.
  • Demand-side structural shifts: electrification and efficiency improvements can gradually alter product demand mix, raising the need for flexibility in product slate and asset configuration.
  • Operational risk: refinery outages, process disruptions, and turnaround timing can create margin leakage and working-capital strain.

πŸ“Š Valuation & Market View

Equity valuation for integrated refiners and upstream/downstream operators typically follows cash-flow sensitivity rather than stable earnings multiples. Investors commonly frame value using:

  • EV/EBITDA and cash-flow yield during cycles, adjusted for commodity spread assumptions.
  • Discounted cash flow with scenarios for refining margins, crude differentials, and maintenance/upgrade capex.
  • Operational leverage metrics tied to utilization, reliability, and cost per barrel/ton of throughput.

The key drivers that move the market view are expected durability of refining margins, evidence of sustained operating performance (reliability and cost discipline), and a credible capital allocation path that preserves asset competitiveness through cycle variation.

πŸ” Investment Takeaway

MPC’s core thesis rests on a structural advantage typical of high-quality energy infrastructure: geographic cost positioning and logistics-enabled value capture around a complex refining system, supported by integration with North American crude supply. While earnings remain inherently commodity-cycle exposed, the competitive edge is anchored in asset footprint, operational reliability, and the practical barriers created by pipelines/terminals and market accessβ€”factors that are difficult for new entrants or less-positioned competitors to replicate quickly.


⚠ AI-generated β€” informational only. Validate using filings before investing.

πŸ“° Market News & Coverage

15 Stories Available

Real-time institutional reporting and market updates for MPC.

zacks.comβ€’2026-06-04

Why Is Marathon Petroleum (MPC) Up 8.7% Since Last Earnings Report?

Marathon Petroleum (MPC) reported earnings 30 days ago. What's next for the stock?

zacks.comβ€’2026-06-03

Can MPC's West Coast Assets Become a Bigger Earnings Driver?

MPC's West Coast refining footprint, led by the region's largest refinery, may gain value as California fuel supply stays constrained.

zacks.comβ€’2026-06-03

Best Growth Stocks to Buy for June 3rd

PBI, CNC and MPC made it to the Zacks Rank #1 (Strong Buy) growth stocks list on June 3rd, 2026.

zacks.comβ€’2026-06-01

Oil Stocks Look Poised for Another Leg Higher

Peace talks between the US and Iran have again collapsed and oil stocks look ready to rally again. Marathon Petroleum, Valero Energy and Phillips 66 all boast top Zacks Ranks and strong price momentum.

zacks.comβ€’2026-06-01

Is Marathon Petroleum (MPC) a Buy as Wall Street Analysts Look Optimistic?

Investors often turn to recommendations made by Wall Street analysts before making a Buy, Sell, or Hold decision about a stock. While media reports about rating changes by these brokerage-firm employed (or sell-side) analysts often affect a stock's price, do they really matter?

zacks.comβ€’2026-06-01

Looking for Earnings Beat? Buy These 5 Top-Ranked Stocks

ALB, ROAD, STRL, SIMO and MPC with a top rank are set to beat on earnings in their upcoming releases.

zacks.comβ€’2026-06-01

Best Growth Stocks to Buy for June 1st

PBI, CNC and MPC made it to the Zacks Rank #1 (Strong Buy) growth stocks list on June 1st, 2026.

seekingalpha.comβ€’2026-05-31

Oil Be Buying: My Absolute Favorite Energy Stocks

Energy remains a top investment focus due to global demand, constrained supply growth, and attractive sector valuations versus the S&P 500. I highlight my preferred picks across the energy supply chain: LandBridge, Viper Energy, Helmerich & Payne, Diamondback Energy, Western Midstream, and Marathon Petroleum. VNOM offers high cash returns to shareholders, while WES and MPC provide strong yields and capital return strategies, each excelling in their respective niches.

zacks.comβ€’2026-05-29

3 Energy Growth Stocks Riding Supply Risks and Strong Demand

MPC, NBR and SU are three energy stocks with buy ranks and strong growth characteristics for investors to consider now.

zacks.comβ€’2026-05-28

What Makes Marathon Petroleum (MPC) a New Strong Buy Stock

Marathon Petroleum (MPC) has been upgraded to a Zacks Rank #1 (Strong Buy), reflecting growing optimism about the company's earnings prospects. This might drive the stock higher in the near term.

zacks.comβ€’2026-05-28

Best Momentum Stock to Buy for May 28th

HLIO, MPC and INTT made it to the Zacks Rank #1 (Strong Buy) momentum stocks list on May 28, 2026.

zacks.comβ€’2026-05-28

Best Growth Stocks to Buy for May 28th

PBI, CNC and MPC made it to the Zacks Rank #1 (Strong Buy) growth stocks list on May 28, 2026.

zacks.comβ€’2026-05-28

Best Value Stock to Buy for May 28th

MPC made it to the Zacks Rank #1 (Strong Buy) value stocks list on May 28, 2026.

zacks.comβ€’2026-05-28

New Strong Buy Stocks for May 28th

MPC, BG, EZPW, LXFR and PHIN have been added to the Zacks Rank #1 (Strong Buy) List on May 28, 2026.

zacks.comβ€’2026-05-27

Here is What to Know Beyond Why Marathon Petroleum Corporation (MPC) is a Trending Stock

Recently, Zacks.com users have been paying close attention to Marathon Petroleum (MPC). This makes it worthwhile to examine what the stock has in store.

πŸ“Š AI Financial Analysis

Powered by StockMarketInfo
Earnings Data: Q Ending 2026-03-31

"MPC reported Q1 2026 revenue of $34.57B and net income of $0.51B (EPS $1.73). On a YoY basis, revenue declined vs Q1 2025 ($31.52B) by about +9.7% YoY, while net income improved meaningfully from -$0.07B to +$0.51B (turnaround of ~$0.59B). QoQ, revenue rose from $33.57B in Q2 2025 to $34.57B in Q1 2026 (roughly +3.8% vs the prior quarter in this sequence), and net income increased from $0.12B (Q2 2025) to $0.51B. Profitability strengthened sharply: net margin improved from -0.2% in Q1 2025 to 1.5% in Q1 2026, and operating margin rose to ~4.1% (up from ~1.1% in Q1 2025). Gross margin also increased to ~9.6% in Q1 2026. Cash flow remains a key support for shareholder returns. Q1 2026 operating cash flow was $1.12B and free cash flow was $0.21B, with dividends paid of $0.30B and buybacks of $0.75B. Balance sheet resilience looks reasonable for an integrated refiner: total assets increased to $88.2B with equity at $23.4B. Total shareholder return is strongly positive given price momentum: the stock is up 72.2% over 1 year, and the dividend yield is modest (~0.4%)."

Revenue Growth

Neutral

Revenue was $34.57B in 2026-03-31 vs $31.52B in 2025-03-31 (+9.7% YoY). QoQ vs 2025-12-31 revenue of $32.57B implies roughly +6.2% sequentially, indicating improving demand/realizations.

Profitability

Strong

Net income swung from -$0.07B (2025-03-31) to +$0.51B (2026-03-31). Net margin expanded to 1.48% from -0.23%, and operating margin rose to 4.06% from 1.12%, signaling margin recovery over the 4-quarter window.

Cash Flow Quality

Positive

Operating cash flow was $1.12B and free cash flow $0.21B in Q1 2026. Dividends ($0.30B) and buybacks ($0.75B) remained active, but FCF coverage appears thinner than prior quarters (FCF down vs Q4 2025 at $1.89B).

Leverage & Balance Sheet

Positive

Total assets rose to $88.2B from $85.6B in Q4 2025. Equity was stable to slightly higher ($23.4B). Total debt is elevated (~$34.3B) with net debt ~ $32.2B, but interest coverage remains >3.5x.

Shareholder Returns

Strong

Strong capital appreciation: 1-year price change of +72.2% (well above +20% momentum threshold). Shareholder payouts were supported by dividends (~0.4% yield) and substantial buybacks ($0.75B in Q1 2026).

Analyst Sentiment & Valuation

Neutral

Consensus target of $216.63 vs current price $213.69 implies modest upside. Valuation appears demanding on earnings (P/E ~35x) but more reasonable vs book dynamics are reflected in provided ratios; overall sentiment is positive but not deeply undervalued.

Disclaimer:This analysis is AI-generated for informational purposes only. Accuracy is not guaranteed and this does not constitute financial advice.

Fundamentals Overview

Loading fundamentals overview...

MPC delivered a strong Q1 2026 print driven by Refining & Marketing execution under extreme refining volatility. Core operating metrics were standout: 89% utilization, nearly 100% capture (and 99% cited), and the lowest unplanned downtime in a decade while completing ~40% of full-year planned maintenance. Financially, adjusted EPS was $1.65 and adjusted EBITDA was $2.8B, nearly $800M higher YoY, largely from R&M. Geopolitical shocks tightened refined product supply (~6M bpd, ~6% of global capacity), lifting cracks, while management emphasized insulation from global crude disruptions via predominantly U.S./Canada crude sourcing and export optionality. Capex is being directed to yield and jet optionality: Garyville added >30,000 bpd jet in March; El Paso yield enhancements expected in 2Q; Robinson jet flexibility in 3Q (~10,000 bpd). Capital return momentum remains aggressive with >$1B returned in Q1 and a new $5B authorization. Risks center on secondary/derivative volatility and steep backwardation management.

AI IconGrowth Catalysts

  • Garyville jet capacity: brought more than 30,000 bpd incremental jet production online in March 2026
  • El Paso yield improvement investment: expected to enhance specialty gasoline production for El Paso, Phoenix, and Mexico markets (timing into 2Q)
  • Robinson Jet flexibility investment: expected to come online in 3Q 2026, adding ~10,000 bpd incremental jet fuel production
  • International LPG trading footprint expansion and long-term delivered demand contracting tied to MPLX Gulf Coast fractionation facilities

Business Development

  • South Korean customer E1 agreement: secured long-term delivered demand for up to 40% of volumes MPC will purchase from MPLX’s new Gulf Coast fractionation facilities (adjacent to MPC’s Galveston Bay refinery)
  • MPLX 2026 growth capex program: over $2.4 billion (not a customer, but named projects: Titan and Harmon Creek III)
  • DOE-related SPR crude purchases: purchased approximately 10 million barrels of advantaged SPR crude directly from the DOE to run in 2Q (and potentially some with the subsequent SPR bid mentioned as having come out)

AI IconFinancial Highlights

  • Adjusted EPS: $1.65 (Q1 2026)
  • Adjusted EBITDA: $2.8 billion; Refining & Marketing adjusted EBITDA per barrel: $5.37
  • Cash flow from operations excluding working capital changes: $1.7 billion
  • Refining & Marketing Q1 adjusted EBITDA: approximately $1.4 billion
  • Refineries ran at 89% utilization with nearly 100% capture; capture referenced again in prepared remarks as 99% for the quarter
  • Unplanned downtime: lowest level in the decade (no explicit bps, but strongest statement on downtime improvement)
  • Adjusted EBITDA YoY: higher by nearly $800 million, primarily driven by Refining & Marketing
  • Refining turnaround costs: $530 million; executed roughly 40% of full-year activity in Q1
  • Second quarter R&M utilization guidance: ~94% (implied supported by the Q1 turnaround pull-forward)
  • Renewable diesel: uplifted by stronger margin environment and clean fuel production tax credits recognized from β€œ45 regulatory guidance” (no explicit percentage/amount given)

AI IconCapital Funding

  • Shareholder returns in Q1: returned over $1 billion to shareholders (inclusive of $750 million share repurchases)
  • Incremental $5 billion share repurchase authorization announced on the call
  • Consolidated cash at quarter-end: roughly $2.2 billion (MPC cash $645 million; MPLX cash over $1.5 billion)
  • Working capital use of cash: $573 million in Q1 (inventory build from lower throughput partially offset by higher crude pricing)
  • Capital allocation framework: return target framework referenced (payout ratio 62%); MPC commitments to capital on the MPC side referenced as $1.5 billion (with growth/dividend coverage discussed, no quarter-specific draw stated)

AI IconStrategy & Ops

  • Operational excellence: 89% utilization, nearly 100% capture, and lowest unplanned downtime in a decade while completing ~40% of full-year planned maintenance in Q1
  • Turnaround timing: pulled forward ~40% of full-year activity into Q1 to prepare for strong Q2 demand environment; no reduction in scope
  • Commercial execution: planning to expand the crack in the quarter; sustain performance through reliability, discipline spending, and continuous improvement
  • Crude sourcing insulation: crude sourcing mainly from U.S. and Canada to reduce exposure to global crude disruption
  • Portfolio optimization / exports under volatility: increased exports; product and crude logistics reallocations in response to spread opportunities

AI IconMarket Outlook

  • Q2 R&M outlook: plan utilization at about 94%
  • Geopolitical supply impact assumption: ~6 million bpd (~6% of global refined products capacity) offline during the Middle East conflict; timeline for return depends on damage and resumption of crude flows
  • MPC confidence: β€œguidance for the second quarter” and confidence throughout the year given long-term supply/demand view and operational/commercial execution (no numeric crack spread guidance provided)
  • MPLX expectations for 2026 exit: Titan sour gas trading expansion expected to exit 2026 with >400 million cubic feet per day treating capacity; Harmon Creek III startup in 3Q bringing processing capacity to 8.1 billion cubic feet per day; Permian Secretariat I processing plant ramping 9–12 months to 1.4 billion cubic feet per day

AI IconRisks & Headwinds

  • Renewed risk to secondary products and derivatives used to manage price volatility: Q1 headwinds cited as timing impact of derivatives and market-driven secondary headwinds
  • Competition/market volatility: SEC-level risk implied through β€œextreme volatility” and need to manage prompt/backwardation and inventory levels
  • Backwardation monitoring risk: β€œextremely steep” backwardation referenced; management watching inventories to avoid excess
  • West Coast supply flow disruption risk: challenges attributed to β€œlack of flows into the state from the Iran conflict,” which management indicated could be leaned into via positioning but remains a regional risk factor

Q&A: Analyst Interest

  • Utilization guidance / β€œunder the hood” Q2 confidence: Management said Q2 planning is ~94% utilization, driven by pulling forward ~40% of turnarounds into Q1 without scope changes. They emphasized organizational effectiveness, technology use, and commercial execution, plus β€œlowest unplanned downtime in the first quarter” as a reliability signal for sustaining through the year.
  • Refining macro vs capture durability in cracks: Management argued refining macro remains constructive long-term due to demand strength and supply balance after 2026. They linked Q1 results to exceptional capture generation in extreme volatility, highlighted insulation via U.S./Canada crude sourcing, and provided examples of advantaged inland barrel access and product export flexibility.
  • Cash return pacing during elevated margins / windfall question: Management reaffirmed no change to capital allocation priorities, emphasizing MPC’s ability to generate cash through cycles while supporting $1.5 billion MPC capital commitments and the dividend. They framed share buybacks as the primary return vehicle and indicated Q2 cash strength supports continued buyback cadence.

Sentiment: POSITIVE

Note: This summary was synthesized by AI from the MPC Q1 2026 earnings transcript. Financial data is complex; please verify all metrics against official SEC filings before making investment decisions.

πŸ“‹ Official Regulatory 10-K / 10-Q SEC Filings

Direct authenticated documentation links to audited SEC database reports for MPC.

SEC EDGAR Live Feed
Loading financial data and tables...
πŸ“

SEC Filings (MPC)

Β© 2026 Stock Market Info β€” Marathon Petroleum Corporation (MPC) Financial Profile