The Williams Companies, Inc.

The Williams Companies, Inc. (WMB) Market Cap

The Williams Companies, Inc. has a market capitalization of $88.01B.

Price: $71.96

β–Ό -0.47 (-0.65%)

Market Cap: 88.01B

NYSE Β· time unavailable

CEO: Chad J. Zamarin

Sector: Energy

Industry: Oil & Gas Midstream

IPO Date: 1981-12-31

Website: https://www.williams.com

The Williams Companies, Inc. (WMB) - Company Information

Market Cap: 88.01B|Sector: Energy

Company Profile

The Williams Companies, Inc., together with its subsidiaries, operates as an energy infrastructure company primarily in the United States. It operates through Transmission & Gulf of Mexico, Northeast G&P, West, and Gas & NGL Marketing Services segments. The Transmission & Gulf of Mexico segment comprises Transco and Northwest natural gas pipelines; and natural gas gathering and processing, and crude oil production handling and transportation assets in the Gulf Coast region, as well as various petrochemical and feedstock pipelines. The Northeast G&P segment engages in the midstream gathering, processing, and fractionation activities in the Marcellus Shale region primarily in Pennsylvania and New York, and the Utica Shale region of eastern Ohio. The West segment comprises gas gathering, processing, and treating operations in the Rocky Mountain region of Colorado and Wyoming, the Barnett Shale region of north-central Texas, the Eagle Ford Shale region of South Texas, the Haynesville Shale region of northwest Louisiana, and the Mid-Continent region, which includes the Anadarko, Arkoma, and Permian basins; and operates natural gas liquid (NGL) fractionation and storage facilities in central Kansas near Conway. The Gas & NGL Marketing Services segment provides wholesale marketing, trading, storage, and transportation of natural gas for natural gas utilities, municipalities, power generators, and producers; risk and asset management; and NGL marketing services. The company owns and operates 30,000 miles of pipelines, 29 processing facilities, 7 fractionation facilities, and approximately 23 million barrels of NGL storage capacity. The Williams Companies, Inc. was founded in 1908 and is headquartered in Tulsa, Oklahoma.

Analyst Sentiment

81%
Strong Buy

From 25 Active Polls

1Y Forecast: $83.75

β–² +16.4% Potential Upside

Consensus Target Metrics

Low Bound

$73

Median

$84

High Bound

$98

Average

$84

Price & Moving Averages

Loading chart...

🎯 Wall Street Analyst Intelligence Report

1-Year structural target targets, chart projections, and sentiment maps.

Average 1Y Target
$83.75
β–² +16.38% Upside
Low Target
$73.00
1% Risk
Median Target
$83.50
16% Mid
High Target
$98.00
36% Max
Consensus
Buy
27 / 34 Buys

Consensus Trend Projection

Trailing closures vs. 12-month metrics map.

Analyst Vote Distribution

Aggregate institutional coverage sentiment weights.

πŸ“Š Historical Valuation Multiples

Real-time Trailing Twelve Month (TTM) momentum side-by-side with discrete quarterly metrics.

Fiscal QuarterTTMQ1 2026Q4 2025Q3 2025Q2 2025Q1 2025Q4 2024Q3 2024Q2 2024
Period EndingTrailing 12MMar 31, 2026Dec 31, 2025Sep 30, 2025Jun 30, 2025Mar 31, 2025Dec 31, 2024Sep 30, 2024Jun 30, 2024
Market Cap ($M)88,00789,01073,45477,41476,73272,94765,98255,67251,689
Enterprise Value ($M)117,359118,362102,752105,331104,401100,25892,85982,01977,896
Price to Earnings Ratio (P/E)31.0024.4025.0229.9135.1326.3933.9419.7132.23
Price/Earnings-to-Growth Ratio (PEG)β€”β€”2.665.42β€”2.3710.011.45β€”
Price to Sales Ratio (P/S)7.3829.3822.9726.4827.7023.9324.0520.9822.13
Price to Book Ratio (P/B)6.776.855.746.186.175.845.314.484.20
Price to Free Cash Flow Ratio (P/FCF)121.89364.79-151.45159.62160.53173.27157.8599.2473.84
Enterprise Value to Sales (EV/Sales)β€”39.0632.1336.0437.6932.8933.8530.9233.35
Enterprise Value to EBITDA (EV/EBITDA)16.5577.2652.5156.4860.1454.0261.4643.8154.32
Debt to Equity Ratio4.142.332.292.242.302.202.172.182.14

⚑ WMB Growth Runway Model

Standard long term linear growth fade

Multi-Stage Discounted Cash Flow Sandbox

Market Price$71.96
Intrinsic Value$18.12
Market Alignment
Overvalued by 74.8%relative to calculated intrinsic value
9.00%
Exp: 3%3%
i

Growth runway slowdown

This value provides a time window for the growth rate to decline beyond Stage 1 toward the terminal rate. Longer windows are most useful for companies with high growth starting conditions or strong competitive advantages. This option stretches out the growth rate slowdown across 5, 10, or 15-year steps. A high-growth starting condition (exceeding a 25% initial growth rate) automatically applies a curve decay to simulate realistic, rapid market saturation.
i

Terminal growth rate

With long-term inflation between 3-5%, revenue must grow by that baseline to maintain flat real-world market share. This value sets the permanent terminal growth rate to factor into the valuation beyond the growth slowdown runway toward maturity.

3-Stage Financial Runway Horizon

🧠 Perpetuity Horizon Engine (Stage 3: Post-2035)

Terminal FCF Base$3.93B
Perpetuity TV Value$73.94B
Discounted TV (PV)$31.23B
TV Weighting %59.5%
⚠️
Financial Model Disclaimer & Risk Disclosure: This interactive scenario simulator is an educational sandbox provided strictly for informational and analytical research purposes. Core historical financial statements and consensus estimates are sourced directly via Financial Modeling Prep (FMP). All downstream outputs are entirely deterministic, hypothetical projections generated by combining automated mathematical formulas (including linear interpolation and Gaussian bell-curve decay models) with user-selected variables and third-party financial data inputs. Users assume all liability for trading decisions executed based on these sandbox calculations.

πŸ“˜ Full Research Report

ℹ️

AI-Generated Research: This report is for informational purposes only.

πŸ“˜ WILLIAMS INC (WMB) β€” Investment Overview

🧩 Business Model Overview

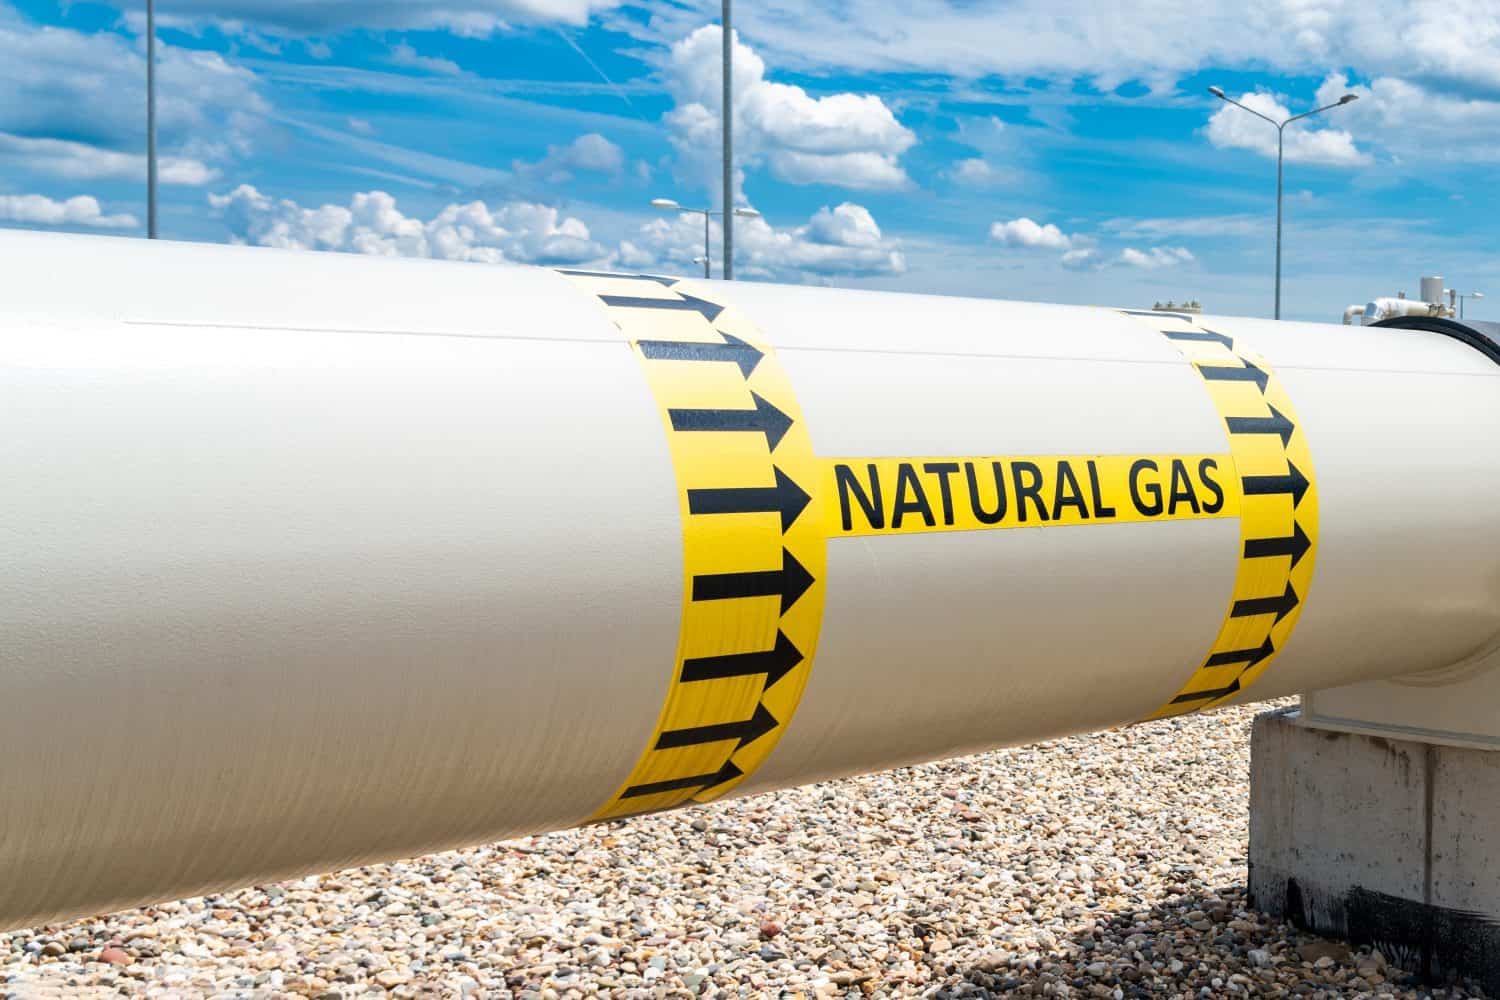
WILLIAMS INC is a fee-based natural gas and liquids midstream operator. The value chain centers on moving U.S. natural gas from supply basins to regional demand and export markets, while also capturing value from processing and moving associated natural gas liquids (NGLs) and related liquids.

Most cash flows are generated through owning and operating pipeline transportation, gathering, storage, and processing/fractionation infrastructure. Customers (producers, marketers, utilities, industrial users, and LNG-related counterparties) pay for capacity and logistics through contractual tariff structures. This creates β€œuse-it-or-pay” style economics in many segments, with revenue tied to contracted capacity and delivered volumes rather than direct commodity trading.

πŸ’° Revenue Streams & Monetisation Model

WMB monetizes infrastructure primarily through:

  • Natural gas transportation tariffs: recurring revenue streams linked to transporting contracted volumes through long-lived assets (pipelines, interconnects, and related systems).
  • Storage and peaking services: capacity-driven fees that help balance seasonal demand and supply dynamics.
  • Processing/fractionation economics: margin capture from separating NGLs from natural gas and moving them to downstream markets; returns are driven by throughput and processing spreads (less β€œpure” commodity exposure than an upstream producer, but still sensitive to margin conditions).
  • Other midstream services: including terminal/logistics-related cash flows tied to throughput and contracted arrangements.

Margin structure is dominated by logistics availability and contract coverage. In most midstream models, the major determinant of sustainability is how much cash flow is anchored by take-or-pay / firm service arrangements and how efficiently assets can be maintained to preserve throughput.

🧠 Competitive Advantages & Market Positioning

WMB’s competitive position is best understood as a combination of geographic cost advantage and logistical infrastructure moat.

  • Geographic cost advantage (low-cost feedstock to demand access): U.S. shale and associated production create abundant natural gas supply in North America. Pipeline operators that are positioned to move gas from these supply regions to high-value demand corridors (including Gulf Coast and other consumption/export-oriented centers) benefit from structural pricing differentials and the economics of delivered molecules.
  • Logistical infrastructure moat (asset gravity and rights-of-way): Natural gas pipelines and terminals face high barriers to entry due to permitting, eminent domain/right-of-way constraints, long construction timelines, and substantial capital needs. Competitors cannot easily replicate system reach or capacity in a short time horizon.
  • Switching costs (shipper lock-in to network): Once a shipper’s production and demand are matched to pipeline routing, volumes are difficult to redirect without incurring incremental logistics cost or losing firm access. Capacity contracting and network constraints effectively raise switching frictions.

Competitive benchmarking:

  • Enbridge (ENB): broader cross-border and liquids/pipeline exposure with a distinct footprint and different regional mix; competes for midstream capacity but does not substitute one-to-one for WMB’s specific U.S. gas transportation corridor coverage.
  • Kinder Morgan (KMI): large U.S. gas and product pipeline operator with overlapping gas transportation customers in some regions; competitive pressure tends to show up where rights-of-way and demand-center access are directly comparable.
  • Enterprise Products Partners (EPD): strong presence in U.S. natural gas and NGL logistics and processing; rivalry centers on capturing throughput and contracting volumes across similar downstream NGL demand outlets.

WMB’s industry focus remains centered on natural gas transportation and associated midstream services within U.S. demand corridorsβ€”an approach that emphasizes corridor access, throughput durability, and contracted infrastructure value rather than merchant trading.

πŸš€ Multi-Year Growth Drivers

Over a 5–10 year horizon, growth is supported by structural infrastructure demand rather than only organic consumption growth:

  • LNG and export-linked gas flows: expansion of export capacity and associated supply chains increases the need for dependable U.S. pipeline transportation, storage, and balancing.
  • U.S. power and industrial flexibility: natural gas plays a role in balancing electricity generation and supporting industrial load; infrastructure that delivers firm capacity benefits from the reliability requirement.
  • Pipeline network optimization and debottlenecking: additional capacity from incremental system improvements can be value-accretive relative to building entirely new networks.
  • NGL-related value capture: higher efficiency in processing and connectivity to NGL outlets supports cash flow diversification beyond commodity transport alone.
  • Contracting discipline and backlog buildout: growth projects tied to customer commitments improve the visibility of future cash flows and reduce the risk of β€œvolume on paper.”

The TAM is fundamentally the infrastructure requirement to connect North American gas supply to durable demand centers. As long as domestic gas remains a low-cost energy input and export/demand corridors expand, pipeline logistics and processing remain essential.

⚠ Risk Factors to Monitor

  • Regulatory and tariff risk: FERC rate-setting, regulatory determinations, and shifting policy priorities can alter the economics of pipeline returns.
  • Capital intensity and project execution: Midstream requires ongoing capital for reliability, integrity, and growth. Cost overruns or schedule delays can compress returns.
  • Volume and throughput risk: Production mix changes, regional supply shifts, or customer-specific decisions can reduce transported volumes or processing utilization.
  • Commodity-driven margin volatility (processing/NGL spreads): While transportation is largely fee-based, processing economics can reflect changes in NGL value and feedstock composition.
  • Safety, environmental, and liability: Integrity management, emissions, and incident response carry potential financial and reputational consequences.
  • Credit and counterparty risk: Customer defaults or counterparty stress can affect receivables and the durability of contracting structures.

πŸ“Š Valuation & Market View

Midstream infrastructure is typically valued through cash flow durability and risk-adjusted return metrics rather than growth-by-revenue alone. Market participants commonly anchor on:

  • EV/EBITDA or EV/EBITDA growth outlook (with emphasis on stability of EBITDA and contract coverage)
  • Free cash flow profile and distribution capacity (where relevant)
  • Leverage and interest-rate sensitivity given midstream capital structures

Key valuation movers include: (1) confidence in contracted cash flows, (2) quality and timing of growth capital, (3) regulatory outcomes, and (4) maintaining asset integrity and operating efficiency.

πŸ” Investment Takeaway

WILLIAMS INC offers an infrastructure-based investment thesis anchored by geographic cost advantage and a logistical moat in U.S. natural gas transportation and associated midstream services. The business model emphasizes contract-driven cash flows, hard-to-replicate network reach, and switching frictions created by pipeline logistics. The long-term opportunity is tied to the enduring need to connect low-cost North American gas supply to reliable demand and export corridors, tempered by regulatory and capital-execution risks typical of midstream operators.


⚠ AI-generated β€” informational only. Validate using filings before investing.

πŸ“° Market News & Coverage

15 Stories Available

Real-time institutional reporting and market updates for WMB.

seekingalpha.comβ€’2026-06-05

Dividend Champion, Contender, And Challenger Highlights: Week Of June 7

A weekly summary of dividend activity for Dividend Champions, Contenders, and Challengers. Companies which changed their dividends. Companies with upcoming ex-dividend dates.

zacks.comβ€’2026-06-03

Why Is The Williams Companies (WMB) Down 6.3% Since Last Earnings Report?

The Williams Companies (WMB) reported earnings 30 days ago. What's next for the stock?

fool.comβ€’2026-06-03

Energy ETFs: MLPX Delivers More Income, Lower Fees

A side-by-side look at two sector funds reveals key differences in risk, income focus, and portfolio composition for energy-minded investors.

247wallst.comβ€’2026-06-03

Forget Nuclear: The Old-School Energy Source Quietly Winning the AI Power Race

The AI power conversation is dominated by nuclear restarts and small modular reactor headlines.

zacks.comβ€’2026-06-02

UGP or WMB: Which Is the Better Value Stock Right Now?

Investors looking for stocks in the Oil and Gas - Production and Pipelines sector might want to consider either Ultrapar Participacoes S.A. (UGP) or Williams Companies, Inc. (The) (WMB).

etftrends.comβ€’2026-06-02

Midstream: Robust Gas Backlogs Drive Growth Visibility

North American natural gas demand is poised for a historic increase driven by growth in liquefied natural gas (LNG) exports and the demand for power, which includes data centers. This backdrop is driving unprecedented opportunities for natural gas-focused midstream companies.

seekingalpha.comβ€’2026-05-31

Invesco Summit Fund Q1 2026 Portfolio Update

At quarter end, Invesco Summit Fund's largest overweights were in industrials, energy and communication services. Within industrials and energy, AI related energy demand has continued to drive spending on electrical infrastructure and power generation. The largest underweight was consumer discretionary, reflecting higher inflation from the US/Israel war with Iran and potential AI related employment pressure.

247wallst.comβ€’2026-05-29

Kinder Morgan vs Williams Companies: Both Crush Earnings, But Take Opposite Paths

Kinder Morgan (NYSE:KMI | KMI Price Prediction) and Williams Companies (NYSE:WMB) just closed the books on record 2025 results, and both pipeline operators are pointing the same firehose of capital at LNG exports and data center power demand.

zacks.comβ€’2026-05-29

3 Midstream Stocks That Can Ride Out Iran-War-Induced Uncertainty

KMI, MPLX and WMB may offer steadier, fee-based midstream cash flows as Iran-war turmoil whipsaws WTI, backed by long-term shipper contracts.

fool.comβ€’2026-05-28

3 Brilliant Energy Stocks to Buy Now and Hold for the Long Term

Midstream stocks continue to look like long-term buys.

247wallst.comβ€’2026-05-26

Why Natural Gas Stocks Still Yield More Than Most Dividend ETFs

Most income investors default to broad dividend exchange-traded funds (ETFs) for steady payout exposure. The Schwab US Dividend Equity ETF (NYSEARCA: SCHD) ended 2025 with $71.6 billion in net assets and a 0.06% expense ratio, but its yield, like that of many of its peers, is in the low-single-digit range. With the 10-year Treasury at... Why Natural Gas Stocks Still Yield More Than Most Dividend ETFs

cnbc.comβ€’2026-05-24

Top Wall Street analysts like these dividend stocks for steady income

Amid ongoing uncertainty, investors seeking consistent income can consider adding dividend stocks to their portfolios.

fool.comβ€’2026-05-23

2 High-Yield Energy Stocks to Buy and Hold Forever

HF Sinclair and Williams Companies deliver above-average dividends and stable growth.

investors.comβ€’2026-05-23

AI Energy Infrastructure Stocks Near Buy Points: 'Pep In The Step'

Midstream companies are the "middlemen" of the energy sector and key to U.S. energy infrastructure.

fool.comβ€’2026-05-20

Here's Why Buying The Williams Companies (WMB) Today Could Be the Best Financial Decision You Ever Make

Williams is a pure play on the surging demand for natural gas-fired electricity.

πŸ“Š AI Financial Analysis

Powered by StockMarketInfo
Earnings Data: Q Ending 2026-03-31

"WMB reported Q1 2026 results with revenue of $3.03B and net income of $865M, translating to EPS of $0.71. YoY, revenue declined slightly (-0.6% vs. Q1 2025) while net income grew strongly (+25.3% vs. Q1 2025). QoQ, revenue decreased (-5.2% vs. Q4 2025) and net income rose modestly (+17.9% vs. Q4 2025). Profitability improved: net profit margin expanded to 28.5% from 22.7% in Q1 2025, and 28.5% also improved versus 23.0% in Q4 2025. Operating leverage appears to be driving earnings quality despite quarter-to-quarter revenue volatility. Cash flow remained robust. Operating cash flow was $1.60B and free cash flow was $244M in Q1 2026, with dividends paid of $642Mβ€”consistent with WMB’s shareholder return profile. Balance sheet resilience is supported by large scale assets ($59.6B total assets) and stable equity (~$15.2B total equity) with total debt of $30.3B; net debt remains elevated at ~$29.4B, typical for a capital-intensive midstream operator. Total shareholder returns look favorable given positive price momentum (1-year change +22.12%) and a dividend yield of ~0.7%."

Revenue Growth

Neutral

Revenue was $3.03B in Q1 2026, down -5.2% QoQ (vs. $3.20B in Q4 2025) and down -0.6% YoY (vs. $3.05B in Q1 2025). Trend is slightly negative, though earnings improved.

Profitability

Strong

Net income rose to $865M (+17.9% QoQ; +25.3% YoY). Net margin improved to 28.5% in Q1 2026 from 23.0% in Q4 2025 and 22.7% in Q1 2025, indicating margin expansion and stronger earnings quality.

Cash Flow Quality

Positive

Q1 2026 operating cash flow was $1.60B and free cash flow was $244M. Dividends paid were $642M (high payout behavior typical for WMB), but cash generation in the quarter supports distributions.

Leverage & Balance Sheet

Positive

Total assets were $59.6B with equity of ~$15.2B. Total debt was $30.3B (net debt ~$29.4B). Leverage remains meaningful but balance sheet scale and equity stability appear consistent with resilience for a midstream operator.

Shareholder Returns

Strong

1-year price momentum is strong (+22.12%), which should lift total returns substantially. Dividend yield is ~0.7% and Q1 dividends of $642M align with ongoing shareholder return support; buybacks were not evident in this dataset.

Analyst Sentiment & Valuation

Neutral

Street consensus target is $79 vs. current price $71.15, implying modest upside (~11%). Valuation ratios appear elevated (e.g., price/earnings ~25.7), tempering the score despite strong momentum.

Disclaimer:This analysis is AI-generated for informational purposes only. Accuracy is not guaranteed and this does not constitute financial advice.

Fundamentals Overview

Loading fundamentals overview...

Williams delivered a strong Q1 2026 with record adjusted EBITDA of $2.25B (+13%) and adjusted EPS up 22%, led by Transmission and Gulf. Execution progress is tangible: Naughton conversion entered service; Socrates turbines were placed on foundation and Aristotle’s first phase is complete. Commercialization accelerated with 3 new major projects and an upsized Transco Power Express. Neo (682 MW, 12.5-year contract, 2H 2028) and Atlas (164 MMcf/d, 13-year term, in-service by end-2026) underscore a data-center demand engine supported by gas infrastructure solutions that avoid diesel. Silver Spur expands Northwest capacity (275 MMcf/d, early 2030) and extends a prior Rockies Columbia Connector concept after an open season. Financially, management raised 2026 growth CapEx to $7.3B and guided to the upper half of original full-year adjusted EBITDA guidance, while acknowledging temporarily higher leverage (~4.1x) tied to 2026–2027 project execution. Biggest watch-items remain permitting reform and litigation risk, redundancy optimization, and partner structuring to manage leverage.

AI IconGrowth Catalysts

  • Placed Naughton Coal Conversion project into service (cleaner-burning natural gas while maintaining grid reliability/affordability).
  • Commercialized 3 new major projects and upsized a fourth during the quarter.
  • Kicked off NESE (Northeast Supply Enhancement) and SESE (Southeast Supply Enhancement) construction; progress tied to navigating complex permitting.
  • Placed Socrates Plato South turbines on foundation; completed first phase of Aristotle pipeline serving Ohio power innovation projects (including Socrates).
  • Announced Neo behind-the-meter hyperscaler power innovation project (682 MW, 12.5-year contract; in-service 2H 2028).
  • Announced Atlas gas infrastructure agreement (up to 164 MMcf/d; 13-year term; in-service by end of 2026).
  • Announced Silver Spur Northwest pipeline expansion (90-mile transmission pipeline into Idaho + compression; 275 MMcf/d; in-service early 2030).
  • Upsized Transco Power Express to 750 MMcf/d new capacity, scheduled online in 2030, adding a new customer plus upsizing an existing commitment.
  • Sanctioned ~700 MMcf/d of new expansion projects across gathering and processing portfolio in Q1.

Business Development

  • Neo: commercialized behind-the-meter power project with a hyperscaler counterpart (counterparty not disclosed due to confidentiality).
  • Atlas: gas infrastructure agreement to serve a large investment-grade data center customer in the Northeast (customer not named).
  • Transco Power Express: increased to 750 MMcf/d with a new customer plus upsizing of an existing commitment (counterparty not named).
  • Rockies Columbia Connector: Silver Spur is first phase following prior open season; additional customer discussions progressing with key customers in Washington and Oregon.

AI IconFinancial Highlights

  • Adjusted EBITDA: $2.25 billion in Q1 2026, +13% vs Q1 2025; record quarter.
  • EPS (adjusted earnings per share): +22% vs Q1 2025 (John cites increase from $1.99 billion to $2.25 billion EBITDA as the driver).
  • Segment performance: Transmission and Gulf improved nearly $150 million (~17%); Transco +~10% YoY driven by higher tariff rates post rate case settlement and expansion projects; Deepwater Gulf +60%+ from recent Gulf expansion projects.
  • Northeast G&P: +$10 million (+2%); strong rich gas growth offset by volume declines in dry gas areas.
  • West: +$56 million (~16%) led by Haynesville investments, including a full quarter of service from Louisiana Energy Gateway Pipeline.
  • Sequent Marketing: $227 million adjusted EBITDA; ~$15 million of the overall $72 million increase tied to Cogentrix investment acquired in March 2025; company expects to divest Cogentrix later in 2026.
  • Upstream/other: down about $20 million primarily due to divestiture of upstream Haynesville assets closing in Jan 2026; recurring metrics exclude ~ $180 million book gain.
  • Full-year outlook: guiding to the upper half of original adjusted EBITDA guidance based on Q1 strength.
  • CapEx midpoint increased to $7.3 billion for 2026 (growth CapEx) with Neo addition; leverage moves modestly above the 3.5x–4.0x target range to 4.1x.

AI IconCapital Funding

  • Shareholder returns: dividend growth β€œstays intact” while funding the CapEx program.
  • Leverage: moved to ~4.1x (temporarily above target range of 3.5x–4.0x) due to timing/execution of power innovation projects (5 high-quality, fast-cycle projects).
  • Financing flexibility: management emphasized multiple options; expects to firm up financing plans over the next couple of months; intent to return leverage to target range over time as earnings growth in 2028 resets leverage capacity.

AI IconStrategy & Ops

  • Power innovation construction/progress: Socrates Plato South turbines placed on foundation; Socrates commissioning progressing with expectation of efficiency/operating-mode improvements as capacity and redundancy are proven.
  • Efficiency approach: management cited applying lessons learned from Aquila and Apollo to follow-on power projects; expects continued efficiency gains as program matures (only ~1 year into program while announcing fifth project).
  • Permitting/approvals: NESE groundbreaking positioned as first new gas pipeline in NYC in over a decade; management reiterated focus on 401 permitting reform and judicial reform to reduce litigation delays and cost to consumers.
  • Supply chain/execute-cadence discipline: Q&A emphasized sequencing/layering projects to match execution capabilities and equipment/supply-chain availability; discouraged precision on the β€œ6-gigawatt” backlog math.

AI IconMarket Outlook

  • Full-year 2026 EBITDA: targeting the upper half of original adjusted EBITDA guidance (no exact dollar figure provided).
  • Seasonality: expects seasonally lower EBITDA in 2Q before sequential growth in 2H 2026, including partial startup of Socrates facility beginning in 3Q 2026.
  • In-service timing: Neo in 2H 2028; Atlas by end of 2026; Silver Spur early 2030; Transco Power Express in 2030; Aristotle pipeline first phase already completed (supports power innovation projects in Ohio).

AI IconRisks & Headwinds

  • Permitting/judicial risk: management highlighted challenges via 401 permitting process and litigation delays (citing 13 years of litigation on Atlantic Sunrise; risk described as increasing cost and delaying projects).
  • Financing/timing risk: leverage temporarily above target (4.1x) through 2026–2027, described as a timing dynamic rather than structural; requires balancing financing flexibility.
  • Power redundancy/capacity optimization risk: Socrates built with ~50% redundant capacity; management will learn during commissioning before asserting whether redundancy ratio can decline on newer projects.
  • Commodity/macro sensitivity in upstream: commentary noted producers cautious drilling amid Henry Hub below $3 while anticipating demand pull from LNG ramp; could impact near-term drilling/volume growth.

Q&A: Analyst Interest

  • Power market appetite & deal cadence: Management said backlog remains β€œrobust, if not more so” versus Analyst Day, and emphasized strong interest driven by data-center constraints and the need for fast, tailored energy solutions. Chad avoided precision but reiterated a continued multi-year cadence layering projects within execution discipline.
  • Financing solutions & leverage timing: Management confirmed leverage modestly above 3.5x–4.0x at 4.1x, driven by execution on five power innovation projects. John emphasized multiple partner-driven financing structures to recycle capital, preserve dividend growth, and delever naturally as earnings growth accelerates in 2027–2028; plans to be detailed in coming months.
  • Neo/Socrates redundancy & transmission opportunity overlap: Management described efficiency gains via lessons learned across prior power projects and stated they are still commissioning Socrates, expecting improved operating modes and more efficient capacity after proving redundancy. For Rockies/Northwest, management framed Silver Spur as Idaho-first, with longer-term activity and continued discussions in Washington and Oregon.

Sentiment: POSITIVE

Note: This summary was synthesized by AI from the WMB Q1 2026 earnings transcript. Financial data is complex; please verify all metrics against official SEC filings before making investment decisions.

πŸ“‹ Official Regulatory 10-K / 10-Q SEC Filings

Direct authenticated documentation links to audited SEC database reports for WMB.

SEC EDGAR Live Feed
Loading financial data and tables...
πŸ“

SEC Filings (WMB)

Β© 2026 Stock Market Info β€” The Williams Companies, Inc. (WMB) Financial Profile