NOV Inc.

NOV Inc. (NOV) Market Cap

NOV Inc. has a market capitalization of $6.93B.

Price: $19.43

0.13 (0.67%)

Market Cap: 6.93B

NYSE · time unavailable

CEO: Jose A. Bayardo

Sector: Energy

Industry: Oil & Gas Equipment & Services

IPO Date: 1996-10-29

Website: https://www.nov.com

NOV Inc. (NOV) - Company Information

Market Cap: 6.93B|Sector: Energy

Company Profile

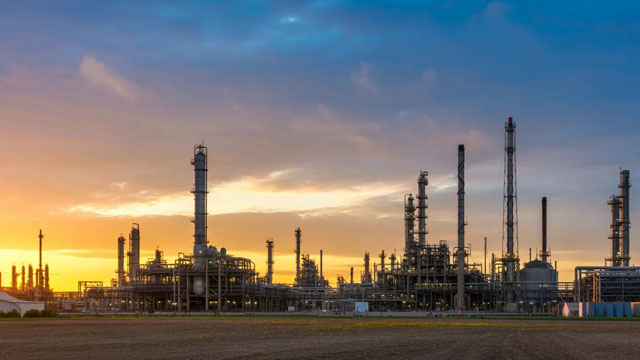
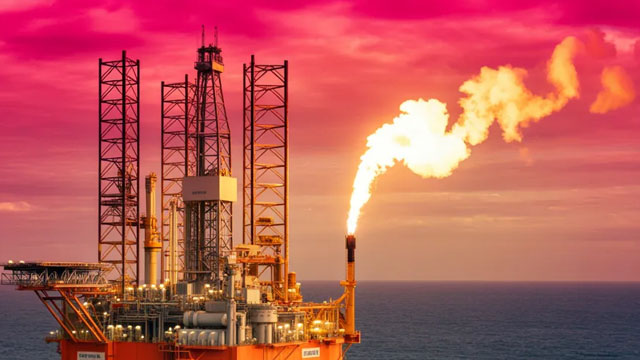
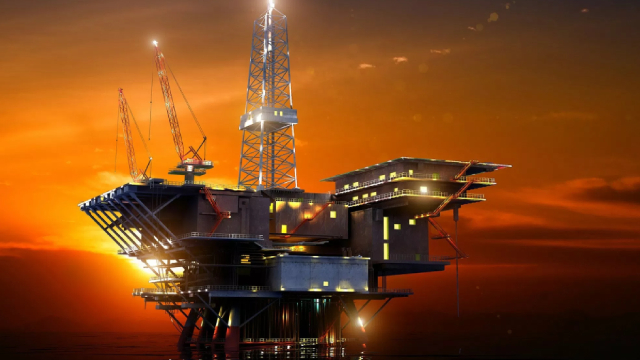
NOV Inc. is a global leader in designing, manufacturing, and marketing essential systems, components, and products for the oil and gas drilling and production industries, as well as for industrial and renewable energy sectors worldwide. The company's operations are divided into three core segments: Wellbore Technologies, Completion & Production Solutions, and Rig Technologies. The Wellbore Technologies segment provides a range of offerings including solids control and waste management equipment, portable power generation units, drill and wired pipes, advanced drilling optimization and automation services, and comprehensive tubular inspection, repair, and coating services. This segment also supplies instrumentation, measuring and monitoring tools, downhole and fishing tools, steerable drilling technologies, and drill bits. The Completion & Production Solutions segment specializes in equipment and technologies for hydraulic fracture stimulation, encompassing downhole multistage fracturing tools, pressure pumping trucks, blenders, sanders, hydration and injection units, flowlines, and manifolds. They also offer coiled tubing units, wireline units and tools, and various connections and liner hangers. For onshore production, solutions include composite pipe, surface transfer and progressive cavity pumps, and artificial lift systems. Offshore production is supported by floating production systems and subsea production technologies. Additionally, this segment manufactures industrial pumps and mixers. The Rig Technologies segment focuses on drilling rig infrastructure and machinery. This includes substructures, derricks, masts, cranes, jacking systems, and sophisticated pipe lifting, racking, rotating, and assembly systems. They also supply mud pumps, pressure control equipment, drives and generators, and integrated rig instrumentation and control systems. Furthermore, this segment provides mooring, anchor, and deck handling machinery, specialized equipment components for offshore wind construction vessels, and complete pipelay and construction systems. Beyond product sales, NOV Inc. offers vital after-sales support, such as spare parts, repair services, and rental options. Their comprehensive service portfolio includes remote equipment monitoring, expert technical support, on-site field service, and extensive customer training programs. Founded in 1862 and based in Houston, Texas, the company was formerly known as National Oilwell Varco, Inc. before officially changing its name to NOV Inc. in January 2021.

Analyst Sentiment

58%
Buy

From 22 Active Polls

1Y Forecast: $20.88

▲ +7.5% Potential Upside

Consensus Target Metrics

Low Bound

$18

Median

$21

High Bound

$26

Average

$21

Price & Moving Averages

Loading chart...

🎯 Wall Street Analyst Intelligence Report

1-Year structural target targets, chart projections, and sentiment maps.

Average 1Y Target
$20.88
▲ +7.46% Upside
Low Target
$18.00
-7% Risk
Median Target
$21.00
8% Mid
High Target
$26.00
34% Max
Consensus
Hold
25 / 58 Buys

Consensus Trend Projection

Trailing closures vs. 12-month metrics map.

Analyst Vote Distribution

Aggregate institutional coverage sentiment weights.

📊 Historical Valuation Multiples

Real-time Trailing Twelve Month (TTM) momentum side-by-side with discrete quarterly metrics.

Fiscal QuarterTTMQ2 2026Q1 2026Q4 2025Q3 2025Q2 2025Q1 2025Q4 2024Q3 2024
Period EndingTrailing 12MJun 30, 2026Mar 31, 2026Dec 31, 2025Sep 30, 2025Jun 30, 2025Mar 31, 2025Dec 31, 2024Sep 30, 2024
Market Cap ($M)6,9266,6786,7905,6894,9034,6615,7995,6656,260
Enterprise Value ($M)8,0887,8407,7876,4776,0515,9527,0156,8217,676
Price to Earnings Ratio (P/E)74.7314.9694.05-18.6130.1110.7220.038.9012.10
Price/Earnings-to-Growth Ratio (PEG)3.74-4.012.651.67
Price to Sales Ratio (P/S)0.803.133.312.502.252.132.762.452.86
Price to Book Ratio (P/B)1.131.081.090.910.760.720.900.890.97
Price to Free Cash Flow Ratio (P/FCF)12.32-104.34-74.6212.0520.0143.16113.7011.9822.60
Enterprise Value to Sales (EV/Sales)3.673.802.842.782.723.342.963.50
Enterprise Value to EBITDA (EV/EBITDA)10.1527.4152.2636.3932.8826.5730.2421.9327.32
Debt to Equity Ratio1.460.370.380.370.360.360.370.370.37

📘 Full Research Report

ℹ️

AI-Generated Research: This report is for informational purposes only.

📘 NOV INC (NOV) — Investment Overview

🧩 Business Model Overview

NOV is an oilfield equipment and technology supplier with an emphasis on engineered components and services used across the drilling, completion, and production lifecycle. The value chain typically spans: (1) product engineering and manufacturing of downhole and surface equipment, (2) supplying consumables and replacement parts, and (3) providing field services that help customers run equipment reliably in harsh operating environments. This “sell + support” model creates repeat demand from customers whose assets require ongoing maintenance, upgrades, and interventions.

💰 Revenue Streams & Monetisation Model

Revenue is driven by a mix of new equipment sales, project/service delivery, and aftermarket/parts and service activity. The monetisation engine is the transition from one-time project economics to more durable maintenance and replacement economics over the operating life of installed equipment.

  • Aftermarket and services: tends to support steadier demand through maintenance cycles, well interventions, and component wear-out/replacement.
  • Engineered project sales: more cyclical and sensitive to customer drilling and completions activity.
  • Margin drivers: operating leverage from manufacturing throughput, mix shift toward higher-value engineered systems, and service/aftermarket contribution that can better absorb fixed costs than purely project-driven revenue.

🧠 Competitive Advantages & Market Positioning

NOV’s competitive position is underpinned by a set of practical moats that are difficult to replicate quickly in oilfield equipment, where reliability, qualifications, and lifecycle support matter.

  • Switching costs (qualification + installed base): Once tools and components are qualified for specific customer processes and well designs, customers face costs related to re-engineering, qualification testing, and operational disruption. NOV benefits from an installed base that requires ongoing parts, refurbishment, and upgrades.
  • Technological differentiation (engineered solutions): Competitors cannot easily substitute away from equipment once NOV’s designs are integrated into well construction and production workflows—especially where performance under pressure, temperature, and downhole conditions is critical.
  • Cost and execution advantages (scale + global manufacturing/service footprint): NOV’s ability to produce complex components at scale and support them through a broad logistics and service network improves responsiveness versus smaller regional players.

Competitive benchmarking:

  • Baker Hughes and Schlumberger (technology-led oilfield services): these players compete more directly for engineering and service delivery around the well. NOV’s relative focus is more equipment and engineered component supply with lifecycle support, rather than solely service-led project delivery.
  • Halliburton: competes for well services and integrated solutions; NOV’s differentiation is tied to proprietary engineered equipment and replacement/aftermarket streams that support the operational lifecycle.

The key distinction is that NOV’s moat is less about “owning the full well” and more about being a repeat, qualified supplier of equipment and support throughout the life of the well system.

🚀 Multi-Year Growth Drivers

  • Higher well complexity: Industry trends toward longer laterals, tighter reservoir constraints, and increased completion intensity raise the value of reliable, engineered equipment and specialized components.
  • Productivity and uptime focus: Regardless of commodity cycles, upstream operators prioritize equipment that improves run life, reduces non-productive time, and lowers intervention frequency—supporting aftermarket and refurbishment demand.
  • Lifecycle spend expansion: As installed equipment bases grow worldwide, aftermarket parts, consumables, and service contracts expand with the number of producing assets.
  • Digital and automation adjuncts: While NOV does not solely define “digital oilfield,” equipment platforms increasingly incorporate sensing, monitoring, and process integration that can increase dependence on qualified vendors and reduce effective switching.

⚠ Risk Factors to Monitor

  • Capital-cycle exposure: Upstream drilling and completion activity drives equipment orders; downturns can pressure utilization and reduce fixed-cost absorption.
  • Customer financial stress: Oil and gas operators’ leverage can tighten spending and extend payment cycles, affecting working capital and demand timing.
  • Competitive substitution: Large service incumbents and specialist OEMs can pressure margins through pricing or bundled solutions, requiring NOV to defend differentiation.
  • Execution and supply chain risk: Complex manufacturing and worldwide logistics introduce cost inflation, delivery risk, and quality/regulatory compliance challenges.
  • Geopolitical/regulatory constraints: Export controls, sanctions, and trade restrictions can limit end-market access and require ongoing compliance investment.

📊 Valuation & Market View

Equity valuation for oilfield equipment and services companies typically reflects expectations for upstream capex and the durability of aftermarket/service mix. The market often frames value through EV/EBITDA and cyclically adjusted earnings, with price-to-sales sometimes used when earnings visibility is limited by cycle dynamics. Key variables that tend to move valuation multiples include:

  • Aftermarket and services contribution (share of revenue less tied to new builds)
  • Gross margin structure and manufacturing throughput
  • Order book quality and backlog conversion (engineering execution and customer confidence)
  • Capital discipline (ability to fund growth without overleveraging during downturns)

🔍 Investment Takeaway

NOV’s long-term investment case rests on its role as a qualified, lifecycle supplier of engineered oilfield equipment—creating practical switching costs through installed base and qualification dynamics, while supporting resilience via aftermarket and service revenue. Over a 5–10 year horizon, growth is most likely to track increasing well complexity, productivity-driven spending, and expanding global installed equipment bases, tempered by the sector’s inherent capital-cycle sensitivity.


⚠ AI-generated — informational only. Validate using filings before investing.

📰 Market News & Coverage

15 Stories Available

Real-time institutional reporting and market updates for NOV.

zacks.com2026-07-31

3 Oilfield Equipment Stocks That Can Thrive Amid Industry Headwinds

Softer equipment demand and conservative capital spending by upstream players make the outlook for the Zacks Oil and Gas- Mechanical and Equipment industry gloomy. NOV, OIS and NGS are trying to survive industry challenges.

zacks.com2026-07-30

NOV Earnings Reveal Improving Margins Amid Uneven Revenue Trends Today

NOV's margin gains and record Energy Equipment profitability offset uneven revenues as backlog trends shape the second-half outlook.

zacks.com2026-07-30

NOV Q2 Earnings Surpass Estimates, Revenues Decrease Y/Y

NOV beats Q2 earnings and revenue estimates despite lower sales, as Energy Equipment strength, shareholder returns and upbeat Q3 guidance support momentum.

marketbeat.com2026-07-30

NOV Q2 Earnings Call Highlights

NOV NYSE: NOV reported second-quarter 2026 revenue of $2.13 billion and net income of $112 million, or $0.31 per diluted share, as operational improvements, favorable project execution and stronger deliveries supported results despite continued disruption in the Middle East.

zacks.com2026-07-29

Nov Inc. (NOV) Q2 Earnings: How Key Metrics Compare to Wall Street Estimates

Although the revenue and EPS for Nov Inc. (NOV) give a sense of how its business performed in the quarter ended June 2026, it might be worth considering how some key metrics compare with Wall Street estimates and the year-ago numbers.

seekingalpha.com2026-07-29

NOV Inc. (NOV) Q2 2026 Earnings Call Transcript

NOV Inc. (NOV) Q2 2026 Earnings Call Transcript

zacks.com2026-07-28

Nov Inc. (NOV) Q2 Earnings and Revenues Beat Estimates

Nov Inc. (NOV) came out with quarterly earnings of $0.31 per share, beating the Zacks Consensus Estimate of $0.16 per share. This compares to earnings of $0.29 per share a year ago.

globenewswire.com2026-07-28

NOV Reports Second Quarter 2026 Earnings

Revenues of $2.13 billion, up 4% sequentially and down 2% year-over-year Net income of $112 million, or $0.31 per share, an increase of $93 million sequentially and $4 million year-over-year Adjusted EBITDA 1,2 of $283 million, an increase of $106 million sequentially and $31 million year-over-year Returned $127 million of capital to shareholders through share repurchases and dividends Bookings of $474 million, representing a book-to-bill of 74% 1 Free Cash Flow, Excess Free Cash Flow, Adjusted operating profit, and Adjusted EBITDA are non-GAAP measures, see “Non-GAAP Financial Measures,” and “Reconciliation of GAAP to non-GAAP measures” below. 2 Second quarter 2026 Adjusted EBITDA includes a benefit of approximately $40 million related to tariff refunds HOUSTON, July 28, 2026 (GLOBE NEWSWIRE) -- NOV Inc. (NYSE: NOV) today reported second quarter 2026 revenues of $2.13 billion, an increase of four percent sequentially and a decrease of two percent compared to the second quarter of 2025.

zacks.com2026-07-24

NOV to Report Q2 Earnings: What's in Store for the Stock?

NOV faces a key Q2 test as delayed shipments, strong order trends and cost cuts collide with ongoing logistics and drilling headwinds.

zacks.com2026-07-21

Nov Inc. (NOV) Expected to Beat Earnings Estimates: Can the Stock Move Higher?

Nov Inc. (NOV) possesses the right combination of the two key ingredients for a likely earnings beat in its upcoming report. Get prepared with the key expectations.

zacks.com2026-07-14

NOV Stock Rallies 49% in a Year: Time to Buy or Move On?

NOV's technology gains, rising earnings estimates, strong backlog and shareholder returns strengthen its long-term outlook despite trailing some peers.

fool.com2026-06-27

NOV vs. SLB N.V.: Which Energy Stock Is a Better Buy in 2026?

NOV provides a conservative balance sheet with a current ratio of roughly 2.4x and low debt levels. SLB N.V. leverages a massive global footprint to generate substantial free cash flow nearing $4.8 billion.

globenewswire.com2026-06-23

Agomab Announces Design of NOV-ERA Phase 2b Study with Ontunisertib in Fibrostenosing Crohn's Disease

-- Regulatory alignment with U.S. Food and Drug Administration (FDA) on key elements of NOV-ERA Phase 2b study design, including novel primary endpoint of endoscopic passability -- -- Study initiation on track, with first participants expected to be dosed in the second half of 2026 -- Antwerp, Belgium, June 23, 2026 – Agomab Therapeutics NV (Nasdaq: AGMB) (“Agomab” or the “Company”), a clinical-stage biopharmaceutical company focused on fibro-inflammation, today announced the design of its upcoming Phase 2b NOV-ERA study with ontunisertib, its investigational oral gastro-intestinal (GI)-restricted small molecule inhibitor of ALK5 (or TGF-β RI) for the potential treatment of Fibrostenosing Crohn's Disease (FSCD). Approximately 46% of Crohn's disease patients have FSCD, or fibrotic strictures in the intestinal tract, which can cause obstructive symptoms leading to dietary change, malnutrition and surgery.

globenewswire.com2026-06-16

NOV Announces Second Quarter 2026 Earnings Conference Call

HOUSTON, June 16, 2026 (GLOBE NEWSWIRE) -- NOV Inc. (NYSE: NOV) will hold a conference call to discuss its second quarter 2026 results on Wednesday, July 29, 2026, at 10 a.m. (Central Time).

zacks.com2026-06-09

NOV Stock Gains 32% in Six Months: Should Investors Hold or Move On?

NOV shares rise 32% over the past six months as offshore demand, backlog growth and efficiency gains boost prospects despite tariffs and risks.

📊 AI Financial Analysis

Powered by StockMarketInfo
Earnings Data: Q Ending 2026-06-30

"NOV reported Q2 2026 revenue of $2.13B and net income of $112M (EPS $0.31). Versus Q2 2025, revenue was essentially flat (-2.4% YoY) while net income surged from $108M to $112M (+3.7% YoY). Sequentially (QoQ), revenue rose from $2.05B to $2.13B (+4.0%), and net income improved sharply from $20M to $112M (+460% QoQ). Profitability strengthened: gross margin increased to 24.4% from 18.5% in Q1, and operating margin expanded to 9.0% from 2.3% QoQ. Over the full 4-quarter run, NOV swung from a loss in Q4 2025 (net income -$78M) back to profit by Q1 2026 ($20M) and delivered a meaningful Q2 rebound. Cash flow quality was mixed: operating cash flow in Q2 was only $17M, despite positive net income, with working capital adding $189M but other non-cash items dragging (-$351M). Free cash flow was slightly negative (-$64M) due to capex ($81M). Balance sheet resilience remains solid: total assets were $11.20B, equity was $6.26B, and leverage looks manageable with net debt of $1.16B. Shareholder returns appear strong—NOV is up +58.5% over the last 12 months—with buybacks continuing (repurchased ~$63M in Q2) alongside dividends ($64M). Analyst valuation looks slightly favorable: consensus target ~$20.88 vs. current ~$19.10 implies modest upside."

Revenue Growth

Fair

Revenue was roughly flat YoY (-2.4% vs. Q2 2025) but improved QoQ to $2.13B (+4.0% vs. Q1 2026), indicating stabilization with modest momentum.

Profitability

Good

Net income improved materially QoQ (+460%) and was slightly higher YoY (+3.7%). Margins expanded sharply: gross margin rose to 24.4% and operating margin to 9.0% from 2.3% in Q1.

Cash Flow Quality

Caution

Despite higher net income, operating cash flow was only $17M in Q2 and free cash flow was slightly negative (-$64M), suggesting earnings-to-cash conversion pressure and/or non-cash drag.

Leverage & Balance Sheet

Positive

Equity is stable and strong ($6.26B). Total assets were steady (~$11.2B). Leverage appears manageable with net debt at $1.16B, and interest coverage remains healthy (ratio ~9.2).

Shareholder Returns

Good

Total shareholder momentum is strong: price up +58.5% YoY. Capital returns continue via buybacks (~$63M in Q2) and dividends (~$64M), supporting overall return profile.

Analyst Sentiment & Valuation

Neutral

Consensus target is ~$20.88 vs. current ~$19.10 (modest upside). Valuation metrics appear supported by recent profitability recovery, but cash flow metrics still look inconsistent.

Disclaimer:This analysis is AI-generated for informational purposes only. Accuracy is not guaranteed and this does not constitute financial advice.

Fundamentals Overview

Loading fundamentals overview...

So What?: Q1 results show NOV absorbing significant Middle East logistics disruption (-$54M revenue, -$32M EBITDA) layered on tariff and inflation headwinds (about -$30M tariff cost impact on margins). Despite that, Energy Equipment delivered +4% revenue growth and maintained constructive order signals: $520M bookings and strongest Q1 intake since 2019 (book-to-bill 80%), with offshore-focused businesses supporting longer-cycle demand. The clearest upside engine is subsea flexible pipe—record quarterly EBITDA, book-to-bill over 100%, backlog extending into 2028—and management is doubling manufacturing capacity via a $200M Brazil expansion. Offshore production-related equipment and process systems also point to a developing upcycle (FID pipeline and 2027 drillship contracting expectations). Risks remain timing-related delivery deferrals, constrained logistics through the Strait, and input cost pressure (notably tungsten carbide up ~400%). Capital intensity is controlled with $340M–$370M 2026 capex and ongoing return of capital ($67M buybacks, $33M dividends in Q1).

AI IconGrowth Catalysts

  • Energy Equipment capital equipment bookings of $520M (book-to-bill 80%) with strongest Q1 order intake since 2019
  • Subsea flexible pipe: record quarterly EBITDA for the third consecutive quarter; book-to-bill over 100%; backlog extending into 2028
  • Process Systems: 50%+ revenue growth vs 2025; “four FPSOs have reached FID” so far in 2026 with 6–8 additional FIDs forecast for the remainder of 2026
  • Offshore drilling: customers increasing contracting pace and duration; management expects drillships under contract in 2027 at highest level since 2015
  • Energy Products & Services digital services: continued growth/adoption of wired drill pipe broadband data transmission

Business Development

  • Approved $200M expansion for subsea flexible pipe manufacturing facility in Brazil
  • Energy Equipment orders included: subsea flexible pipe awards in Brazil and Europe; semisubmersible rig reactivation project in the North Sea; large FEED study for a harsh-environment turret system
  • Energy Products & Services: contract to deploy InnovaTherm thermal treatment technology in Guyana (first deployment in Latin America)
  • Energy Products & Services rentals/tech: Agitator RAGE and Positrac torsional vibration tools adoption in Asia, Middle East and offshore Brazil; InnovaTherm deployment in Guyana
  • Power/pressure control demand: awarded coiled tubing data acquisition hardware/software packages in the Middle East; booked coiled tubing equipment orders supporting more efficient longer laterals

AI IconFinancial Highlights

  • Reported Q1 GAAP revenue of $2.05B (-2% YoY) and net income of $19M ($0.05/share); adjusted EBITDA $177M (9% of sales)
  • Management estimated Middle East conflict impact: -$54M revenue and -$32M EBITDA for the quarter
  • Energy Equipment: revenue $1.19B (+4% YoY); EBITDA $131M (11% margin) negatively impacted by lower aftermarket mix and Middle East disruption
  • Energy Products & Services: revenue $897M (-10% YoY); adjusted EBITDA $96M (10.7% margin) negatively impacted by larger-than-normal decrementals tied to absorption, tariff costs, and inflationary raw materials
  • Margin pressure quantified: first-quarter margins negatively impacted by about $30M in tariff costs YoY
  • Capital allocation: repurchased 3.5M shares for $67M and paid $33M dividends; dividend increased 20% quarterly
  • Aftermarket/parts: spare parts bookings robust; spare parts backlog highest in last seven quarters

AI IconCapital Funding

  • Share repurchases: $67M in the quarter (3.5M shares)
  • Dividends: $33M; 20% increase in quarterly dividend
  • Debt/credit: extended $1.5B revolving credit facility through 2030
  • Return of capital: over $900M returned to shareholders over past eight quarters
  • Capex guidance: $340M–$370M for 2026 (includes Brazil flexibles facility investment)
  • Free cash flow conversion: expects to convert 40%–50% of 2026 EBITDA to free cash flow

AI IconStrategy & Ops

  • Cost-out actions since 2025: reduced global headcount by 8%, exited 40+ facilities, established global service center in Kochi, India, and increased IT systems investment
  • Rerouting/operations: extended supply-chain mitigation by rerouting manufacturing for customers outside the Middle East to other global facilities (may add cost and not necessarily improve delivery times)
  • Middle East logistics constraints: freight costs reached as much as 3–4x normal levels at times; delays in raw materials/critical components reduced manufacturing throughput and absorption
  • Facility footprint changes impacting operating profit: other items included severance and facility closures (net operating profit $47M included $37M other items)
  • Operational outlook dependency: Q2 assumptions require Middle East conditions consistent with current scenario (ceasefire holds; Strait remains closed)

AI IconMarket Outlook

  • Q2 Energy Equipment guidance: revenue down 2% to 4% YoY; EBITDA $135M–$155M
  • Q2 Energy Products & Services guidance: revenue down 6% to 8% YoY; EBITDA $100M–$120M
  • Company expectation: full-year 2026 book-to-bill near 100% (Energy Equipment)
  • Broad condition-based statement: if Middle East conflict ends and the Strait reopens in the near term, management says NOV could still conceivably achieve prior expectations for full-year 2026 results broadly in line with 2025

AI IconRisks & Headwinds

  • Middle East logistics and site access: shipments rerouted through alternate ports; extended transit times and materially higher freight costs
  • Delayed factory acceptance testing/inspections due to safety/access limits, pushing delivery schedules
  • Manufacturing throughput and absorption reduced by delayed raw materials/critical components; higher operating costs
  • Aftermarket disruption: spare parts into region difficult; customer willingness to pick up/accept orders affected; offshore rig slowdowns and suspended projects
  • Tariff and inflation headwinds: first-quarter margins impacted by about $30M tariff costs YoY; inflationary pressures on medical costs and certain raw materials; tungsten carbide costs increased ~400% since 2025

Q&A: Analyst Interest

  • Flexibles capacity buildout and demand durability: Bayardo said subsea flexible pipe has “extremely strong performance” post-pandemic with bookings lead times extending into 2028; Brazil is expected to ramp with transparent public guidance, and management views the growth as continuing rather than plateauing based on customer visibility and order intake.
  • Not provided in transcript: Q&A after this initial flexibles question is truncated; no second analyst question or management response details were included in the provided excerpt.
  • Not provided in transcript: Additional Q&A items are not available in the supplied text; management’s remaining answers and any explicit numeric guidance from analysts are missing due to transcript cut-off.

Sentiment: MIXED

Note: This summary was synthesized by AI from the NOV Q1 2026 earnings transcript. Financial data is complex; please verify all metrics against official SEC filings before making investment decisions.

📋 Official Regulatory 10-K / 10-Q SEC Filings

Direct authenticated documentation links to audited SEC database reports for NOV.

SEC EDGAR Live Feed
Loading financial data and tables...
📁

SEC Filings (NOV)

© 2026 Stock Market Info — NOV Inc. (NOV) Financial Profile