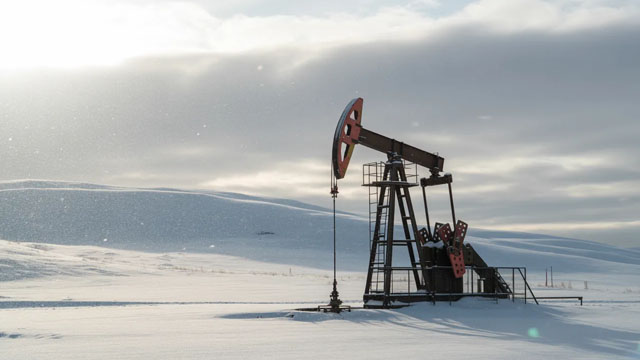
Weatherford International plc

Weatherford International plc (WFRD) Market Cap

Weatherford International plc has a market capitalization of $6.29B.

Price: $87.79

3.08 (3.64%)

Market Cap: 6.29B

NASDAQ · time unavailable

CEO: Girishchandra K. Saligram

Sector: Energy

Industry: Oil & Gas Equipment & Services

IPO Date: 2021-01-04

Website: https://www.weatherford.com

Weatherford International plc (WFRD) - Company Information

Market Cap: 6.29B|Sector: Energy

Company Profile

Weatherford International plc is a prominent energy services enterprise that supplies an extensive range of equipment and specialized services on a global scale. The company supports the full lifecycle of oil, geothermal, and natural gas wells, covering initial drilling, thorough evaluation, well completion, ongoing production, and crucial intervention activities. Its operations are organized into two main geographical divisions: the Western Hemisphere and the Eastern Hemisphere. Weatherford's diverse offerings include numerous artificial lift systems, such as reciprocating rod, progressing cavity pumping, gas, hydraulic, plunger, and hybrid configurations, alongside their associated automation and control systems. They also deliver pressure pumping and reservoir stimulation solutions, encompassing acidizing, hydraulic fracturing, cementing, and coiled-tubing interventions. For well assessment, the company provides drill stem testing tools, surface well testing, and multiphase flow measurement services. Furthermore, Weatherford furnishes essential safety tools, downhole reservoir monitoring systems, flow control mechanisms, and multistage fracturing equipment. This is complemented by sand-control technologies and various production and isolation packers. For well construction, they supply robust liner hangers engineered for challenging high-temperature and high-pressure conditions, as well as a full suite of cementing products designed for zonal isolation, including plugs, float and stage equipment, and torque-and-drag reduction technology. These offerings are supported by expert pre-job planning and installation. In the domain of drilling, Weatherford excels in directional drilling services and real-time logging while drilling. Their advanced drilling technologies feature rotary-steerable systems, high-temperature and high-pressure sensors, drilling reamers, and circulation subs. They also provide rotating control devices and sophisticated automated control systems, alongside specialized drilling services like closed-loop, air, managed-pressure, and underbalanced drilling. Comprehensive logging capabilities extend to both open and cased holes, with dedicated intervention and remediation services addressing well integrity and performance. Lastly, the company manages tubulars through handling, management, and connection services. They also facilitate re-entry, fishing, wellbore cleaning, and well abandonment services, utilizing patented bottom-hole assemblies, specialized tubular-handling equipment, pressure-control equipment, and drill pipe and collars. Weatherford International plc was established in 1972 and maintains its headquarters in Houston, Texas.

Analyst Sentiment

91%
Strong Buy

From 12 Active Polls

1Y Forecast: $135.00

▲ +53.8% Potential Upside

Consensus Target Metrics

Low Bound

$114

Median

$135

High Bound

$156

Average

$135

Price & Moving Averages

Loading chart...

🎯 Wall Street Analyst Intelligence Report

1-Year structural target targets, chart projections, and sentiment maps.

Average 1Y Target
$135.00
▲ +53.78% Upside
Low Target
$114.00
30% Risk
Median Target
$135.00
54% Mid
High Target
$156.00
78% Max
Consensus
Buy
25 / 39 Buys

Consensus Trend Projection

Trailing closures vs. 12-month metrics map.

Analyst Vote Distribution

Aggregate institutional coverage sentiment weights.

📊 Historical Valuation Multiples

Real-time Trailing Twelve Month (TTM) momentum side-by-side with discrete quarterly metrics.

Fiscal QuarterTTMQ2 2026Q1 2026Q4 2025Q3 2025Q2 2025Q1 2025Q4 2024Q3 2024
Period EndingTrailing 12MJun 30, 2026Mar 31, 2026Dec 31, 2025Sep 30, 2025Jun 30, 2025Mar 31, 2025Dec 31, 2024Sep 30, 2024
Market Cap ($M)6,2935,8606,8005,6194,9203,6323,9155,2296,216
Enterprise Value ($M)6,7786,3457,4496,3285,6974,3764,7446,1017,112
Price to Earnings Ratio (P/E)17.2137.0515.7610.1915.146.6912.8711.639.92
Price/Earnings-to-Growth Ratio (PEG)2.206.517.2634.85
Price to Sales Ratio (P/S)1.325.305.904.363.993.023.283.904.41
Price to Book Ratio (P/B)3.533.283.873.313.152.412.904.074.62
Price to Free Cash Flow Ratio (P/FCF)11.9944.0683.9525.8952.3449.0960.2235.0933.78
Enterprise Value to Sales (EV/Sales)5.746.474.914.623.633.984.555.05
Enterprise Value to EBITDA (EV/EBITDA)7.8536.6836.1625.8323.7415.0924.3326.1823.40
Debt to Equity Ratio0.560.910.941.031.121.161.301.391.35

📘 Full Research Report

ℹ️

AI-Generated Research: This report is for informational purposes only.

📘 WEATHERFORD INTERNATIONAL PLC (WFRD) — Investment Overview

🧩 Business Model Overview

Weatherford provides oilfield services and proprietary equipment used across the drilling, completion, and production phases of hydrocarbon development. The model blends project-based work (services performed at the wellsite) with recurring demand linked to field lifecycle (well interventions, production optimization, maintenance of downhole assets, and chemical/services programs where applicable).

A key operating feature is the ability to deliver specialty downhole solutions with coordinated engineering, manufacturing, and field execution. Customers typically evaluate Weatherford on technical capability, time-to-deliver, reliability under downhole conditions, and the economics of operating efficiency (faster operations, reduced non-productive time, improved production outcomes). Once integrated into a customer’s technical and operational workflows, Weatherford’s role tends to become more difficult to displace due to qualification needs, tool compatibility, and performance history.

💰 Revenue Streams & Monetisation Model

Revenue is primarily generated through:

  • Services tied to well construction and well lifecycle activity (higher-margin when utilization and pricing remain disciplined).
  • Equipment and consumables used in completions and production operations, often supported by engineering and onsite execution.
  • Service contracts/programs where applicable, which can shift the revenue mix toward repeatable engagements as fields mature.

Margin drivers typically include:

  • Utilization and operational efficiency (spreading fixed costs over tool runs and service deployments).
  • Mix toward proprietary/specialty offerings where technical differentiation supports stronger pricing and reduced commoditization.
  • Logistics and inventory discipline, since downhole tools and execution readiness can be constrained by lead times and transport economics.
  • Capital allocation for tool fleets and working capital management to maintain availability without overstretch.

🧠 Competitive Advantages & Market Positioning

Weatherford’s competitive position is rooted in a combination of technical differentiation, field-specific switching friction, and a globally distributed delivery footprint.

  • Hard-to-replace technical capability (Intangible/Capability moat): Proprietary tool designs, engineering know-how, and execution experience in demanding downhole environments raise the cost and risk of switching suppliers. Qualification, performance validation, and compatibility with customer operating standards create inertia.
  • Switching costs via installed base and workflow integration: When Weatherford tools and processes become embedded in completion and intervention workflows, contracting decisions are influenced by prior performance, lessons learned, and operational readiness.
  • Geographic delivery advantage (logistics readiness): A global service and equipment footprint improves time-to-deliver and reduces downtime risk. This matters most where delays increase non-productive time or require costly re-planning.

Competitive benchmarking:

  • Schlumberger (SLB) and Halliburton (HAL): Large, integrated service providers with broad portfolios spanning drilling, reservoir, and production-related services. Their scale supports heavy investment and wide offering depth.
  • Baker Hughes (BKR): Comparable scale with strong technology and service capabilities across well construction and related domains.

Weatherford’s industry focus is comparatively more concentrated in well construction, completions, and production lifecycle solutions, where proprietary tools and execution precision can translate into defensible margins and recurring engagement as fields mature. Versus the diversified majors, Weatherford’s edge is often anchored in specialty capability plus responsiveness, rather than solely on broadest-in-class breadth.

🚀 Multi-Year Growth Drivers

Over a 5–10 year horizon, structural demand is supported by trends that persist beyond any single commodity cycle:

  • Aging field development and well intervention demand: Mature assets require ongoing completions optimization, workovers, and production enhancement to sustain output and improve recovery factors.
  • Complex reservoir development: Deeper, more challenging wells increase demand for specialty downhole tools and engineered solutions that reduce downtime and improve downhole reliability.
  • Shift from “new build” to “asset optimization”: Operators prioritize efficiency—reducing operational costs per barrel and improving well performance—which supports repeat engagements tied to uptime and production management.
  • Technological durability and performance under constraints: As operators face greater scrutiny on safety, emissions, and operational risk, solutions that improve reliability and execution control gain preference.
  • Geographic expansion and service footprint rationalization: Local delivery capability and faster mobilization can win share in basin-specific cycles where lead times and readiness determine project outcomes.

⚠ Risk Factors to Monitor

  • Industry cyclicality and customer capital discipline: Oilfield activity and service intensity are influenced by operator spending and commodity-linked decision-making, affecting tool utilization and pricing.
  • Pricing pressure and competitive intensity: In downturn conditions, service pricing can weaken, especially for commoditized scopes, compressing margins.
  • Execution and safety risk: Downhole operations are high consequence; failures can lead to reputational damage, warranty exposure, and cost overruns.
  • Technology obsolescence: Specialty offerings require continuous improvement to remain effective against evolving well designs and completion strategies.
  • Capital intensity and working-capital volatility: Tool fleet investment and inventory/receivables dynamics can magnify cash flow swings across the cycle.
  • Geopolitical and trade compliance constraints: Sanctions, export controls, and regional regulatory changes can disrupt sourcing, service deployment, and end-market access.

📊 Valuation & Market View

Equity valuation for oilfield services and equipment typically reflects the market’s view of:

  • Cycle-adjusted earnings power: Multiples tend to expand when utilization and pricing discipline improve and contract structures support more stable cash generation.
  • Operating leverage vs. downside protection: Investors monitor cost structure and the ability to preserve margins across activity swings.
  • Mix toward specialty/proprietary solutions: Higher technical differentiation generally supports better margin resilience than purely commoditized services.
  • Cash conversion and capital efficiency: Free cash flow durability and working capital discipline often matter as much as reported operating income in this industry.

Common framing uses EV/EBITDA or enterprise-value-based measures, with the key valuation drivers tied to utilization, sustainable margins, and credible cash flow through the cycle.

🔍 Investment Takeaway

Weatherford offers a focused exposure to well construction, completions, and production lifecycle solutions where proprietary downhole capabilities, qualification-driven switching friction, and global service/logistics readiness can support share stability and margin resilience. The investment thesis depends on maintaining technical differentiation and capital discipline while navigating oilfield cyclicality; the long-run opportunity aligns with persistent demand for complex well execution and mature-field optimization rather than only new-drill activity.


⚠ AI-generated — informational only. Validate using filings before investing.
📰 Market News & Coverage

15 Stories Available

Real-time institutional reporting and market updates for WFRD.

defenseworld.net2026-07-24

Weatherford International Q2 Earnings Call Highlights

Weatherford International (NASDAQ: WFRD) reported second-quarter 2026 revenue of $1.105 billion, adjusted EBITDA of $223 million and adjusted free cash flow of $139 million, as management said the oilfield services company held margins steady despite operational disruptions tied to conflict in the Middle East and softer activity in several markets. President and CEO Girish Saligram said

globenewswire.com2026-07-23

NCS Multistage Holdings, Inc. to Announce Second Quarter 2026 Financial Results on July 30, 2026

HOUSTON, July 23, 2026 (GLOBE NEWSWIRE) -- NCS Multistage Holdings, Inc. (“NCS” or the “Company”) (NASDAQ:NCSM), a leading provider of highly engineered products and support services that facilitate the optimization of oil and natural gas well construction, well completions and field development strategies, announced today that it will report its financial results for the second quarter of 2026 on Thursday July 30, 2026. On June 1, 2026, Weatherford International plc (NASDAQ: WFRD) (“Weatherford”) and NCS announced that Weatherford has entered into a definitive agreement to acquire NCS.

zacks.com2026-07-23

Weatherford Q2 Earnings Miss Estimates on Middle East Disruptions

WFRD's Q2 revenues beat estimates, but Middle East disruptions and weaker activity drive a sharp earnings decline.

seekingalpha.com2026-07-22

Weatherford International plc (WFRD) Q2 2026 Earnings Call Transcript

Weatherford International plc (WFRD) Q2 2026 Earnings Call Transcript

marketbeat.com2026-07-22

Weatherford International Q2 Earnings Call Highlights

Weatherford International NASDAQ: WFRD reported second-quarter 2026 revenue of $1.105 billion, adjusted EBITDA of $223 million and adjusted free cash flow of $139 million, as management said the oilfield services company held margins steady despite operational disruptions tied to conflict in the Middle East and softer activity in several markets.

zacks.com2026-07-21

Weatherford (WFRD) Q2 Earnings Lag Estimates

Weatherford (WFRD) came out with quarterly earnings of $0.55 per share, missing the Zacks Consensus Estimate of $0.92 per share. This compares to earnings of $1.87 per share a year ago.

globenewswire.com2026-07-21

Weatherford Announces Second Quarter 2026 Results

Second quarter revenue of $1,105 million decreased 4% sequentially   Second quarter operating income of $107 million decreased 13% sequentially Second quarter net income of $39 million decreased 64% sequentially; net income margin of 3.5% Second quarter adjusted EBITDA* of $223 million, decreased 4% sequentially; adjusted EBITDA margin* of 20.2% decreased 4 basis points sequentially Second quarter cash provided by operating activities of $175 million and adjusted free cash flow* of $139 million Shareholder return of $36 million for the quarter, which included dividend payments of $20 million and share repurchases of $16 million Announced the acquisition of NCS Multistage (NASDAQ: NCSM) in a stock-and-cash transaction, expanding Weatherford's well completions portfolio Introduced an updated plan to redomesticate from Ireland to Delaware, reflecting continued confidence in the initiative's long-term value creation potential Awarded several Managed Pressure Drilling (“MPD”) contracts from Noble Corporation, Constellation Oil Services and Ventura Offshore Holding Ltd. *Non-GAAP - refer to the section titled Non-GAAP Financial Measures Defined and GAAP to Non-GAAP Financial Measures Reconciled HOUSTON, July 21, 2026 (GLOBE NEWSWIRE) -- Weatherford International plc (NASDAQ: WFRD) (“Weatherford” or the “Company”) announced today its results for the second quarter of 2026.

gurufocus.com2026-07-13

A Look at Weatherford International PLC (WFRD) After 3.9% Decline -- GF Value $83.49 vs Price $81.09

On July 13, 2026, Weatherford International PLC (WFRD) shares fell 3.9% to $81.09. The stock has experienced significant volatility, trading between $52.33 and

globenewswire.com2026-07-13

Weatherford to hold Special Shareholder Meetings on September 3

HOUSTON, July 13, 2026 (GLOBE NEWSWIRE) -- Weatherford International plc (NASDAQ: WFRD) (“Weatherford” or the “Company”) today announced that it will hold Special Shareholder Meetings on September 3, 2026, to consider the Company's proposed redomestication from Ireland to Delaware. The definitive proxy statement for the meetings was filed with the U.S. Securities and Exchange Commission today and is being distributed to all shareholders.

zacks.com2026-07-09

Weatherford (WFRD) is a Top-Ranked Value Stock: Should You Buy?

Whether you're a value, growth, or momentum investor, finding strong stocks becomes easier with the Zacks Style Scores, a top feature of the Zacks Premium research service.

zacks.com2026-07-06

4 GARP Stocks That Investors Can Scoop Up for Maximum Returns

The GARP strategy helps investors gain exposure to stocks that have solid prospects and are trading at a discount. RL, EAT, AMP and WFRD are some such stocks.

zacks.com2026-07-03

WFRD vs. AROC: Which Stock Is the Better Value Option?

Investors interested in stocks from the Oil and Gas - Field Services sector have probably already heard of Weatherford (WFRD) and Archrock Inc. (AROC). But which of these two stocks presents investors with the better value opportunity right now?

globenewswire.com2026-06-19

Weatherford Announces Second-Quarter 2026 Conference Call

HOUSTON, June 19, 2026 (GLOBE NEWSWIRE) -- Weatherford International plc (NASDAQ: WFRD) (“Weatherford” or the “Company”) will host a conference call on Wednesday, July 22, 2026 to discuss the Company's results for the second quarter ended June 30, 2026.

globenewswire.com2026-06-19

Weatherford Announces Second-Quarter 2026 Conference Call

HOUSTON, June 19, 2026 (GLOBE NEWSWIRE) -- Weatherford International plc (NASDAQ: WFRD) ("Weatherford" or the "Company") will host a conference call on Wednesday, July 22, 2026 to discuss the Company's results for the second quarter ended June 30, 2026. The conference call will begin at 8:30 a.

zacks.com2026-06-19

Here's Why Weatherford (WFRD) is a Strong Value Stock

Wondering how to pick strong, market-beating stocks for your investment portfolio? Look no further than the Zacks Style Scores.

📊 AI Financial Analysis

Powered by StockMarketInfo
Earnings Data: Q Ending 2026-06-30

"Headline (2026-06-30, Q2): Revenue $1.105B; Net income $39.0M; EPS $0.55. QoQ Revenue fell to $1.105B vs $1.152B (−4.0% QoQ) while Net income declined to $39.0M vs $108.0M (−63.9% QoQ). YoY Revenue declined to $1.105B vs $1.204B (−8.2% YoY) and Net income fell to $39.0M vs $136.0M (−71.4% YoY), indicating a significant profitability reset. Margins compressed sharply across the last two quarters: net profit margin deteriorated to 3.5% in Q2 from 9.4% in Q1 and also down versus ~11.3% in Q2’25. Operating income remained positive at $107M, but the jump in costs (costs/expenses $1.001B; gross profit turned negative at −$340M per reported line) points to unfavorable mix and/or accounting timing. Cash flow quality held up better than earnings: operating cash flow was $175M and free cash flow was $175M in Q2 (no capex reported). Balance sheet resilience appears strong with $1.10B cash and total assets of $4.41B; equity was $1.79B and net debt was ~$350M, down materially from ~$649M in Q1. Shareholder returns were strong: the stock price is $102.36 with 1y_change of +131.11%, and dividend yield is ~0.34%. Analyst consensus target implies ~+52% upside to $156."

Revenue Growth

Caution

Revenue declined −4.0% QoQ (Q2’26 vs Q1’26) and −8.2% YoY (Q2’26 vs Q2’25), indicating a weakening top line trend.

Profitability

Neutral

Net income fell −63.9% QoQ and −71.4% YoY. Net margin contracted to 3.5% in Q2 from 9.4% in Q1 and ~11.3% in Q2’25, showing material margin compression.

Cash Flow Quality

Positive

Operating cash flow of $175M in Q2 supports the quarter’s earnings and was positive; free cash flow matched operating cash flow (capex reported as 0). Dividends are small and likely manageable given cash generation, but recent profitability is pressured.

Leverage & Balance Sheet

Positive

Liquidity is strong with cash/cash equivalents of ~$1.10B and equity of ~$1.79B. Net debt improved to ~$350M from ~$649M QoQ, and total assets eased to $4.41B from $5.09B in Q1.

Shareholder Returns

Strong

Total return backdrop is very strong: price momentum +131.11% over 1y, with a modest dividend yield (~0.34%). No buybacks were reported in the latest quarter.

Analyst Sentiment & Valuation

Positive

Consensus price target $156 vs $102.36 current implies ~+52% upside. Despite deteriorating earnings, valuation expectations appear supportive.

Disclaimer:This analysis is AI-generated for informational purposes only. Accuracy is not guaranteed and this does not constitute financial advice.

Fundamentals Overview

Loading fundamentals overview...

Weatherford (WFRD) delivered resilient profitability and strong cash conversion in Q2 despite Middle East disruption, with adjusted EBITDA of $223M (20.2% margin) and $139M adjusted free cash flow (62.3% conversion). Management repeatedly tied performance to working-capital execution and disciplined capital intensity (CapEx 3.8% of revenue) rather than one-offs. The key revenue puts/takes remain uneven: activity declines in parts of MENA, pricing headwinds, and a Norway labor strike, partially offset by completions/momentum in other regions and an easing in freight/logistics costs after May. Guidance preserves the margin story—Q3 adjusted EBITDA margins up at least 100 bps—with full-year adjusted EBITDA largely stable at the midpoint while raising free-cash-conversion expectations to mid-to-high 40%. Strategically, the company is leaning into technology differentiation and M&A (NCS Multistage) while explicitly declining lower-return Saudi LSTK work. Primary near-term uncertainty is conflict cadence and Mexico collections.

AI IconGrowth Catalysts

  • Multiple deepwater MPD awards expected to ramp in 2H and deliver in 4Q (Brazil: Constellation Oil Services; SSV Victoria: Ventura Offshore; Valaris MPD equipment/services; West Africa: Noble MPD + global aftermarket agreement in Nigeria; Esso Nigeria deepwater integrated completions).
  • Saudi Arabia growth repositioning after LSTK contract conclusion—technology-driven value-add pipeline despite stepping away from low-margin work.
  • PDO Marmul extension commencing in Q3 2026 for integrated drilling services covering 247 wells; additional completions/MPD momentum from prior 837 wells contract execution.
  • Kuwait KOC two 5-year contracts for cementation products and completion services; Thailand PTTEP 22-month downhole deployment valve contract (expands non-MPD completion/cementation scope).
  • Chevron 5-year framework contract for tubular running services/casing accessories supporting a deepwater development project.

Business Development

  • NCS Multistage acquisition: definitive agreement announced; expands completions portfolio and unconventional exposure; expected to close in 2H 2026 subject to regulatory approvals; at least $15M annual cost synergies within 18 months of closing; consideration predominantly equity.
  • Aramco: executed Saudi LSTK contract for three years; Weatherford highlighted capability expansion from Aramco trust.
  • PDO (Oman): concluded 5-year integrated contract with PDO; won Marmul extension commencing in Q3.
  • Chevron: 5-year framework contract for tubular running services/casing accessories.
  • KOC (Kuwait): two 5-year cementation products and completion services contracts.
  • PTTEP (Thailand): 22-month downhole deployment valve contract.
  • Nigeria customers: Noble Corporation (multiple MPD contracts + global aftermarket agreement); Esso Exploration and Production Nigeria (deepwater integrated completions contract).
  • West Africa and Brazil customers: Constellation Oil Services (two contracts for offshore well intervention and MPD), Ventura Offshore (complete MPD solution for SSV Victoria), Valaris (two-year MPD equipment and services).

AI IconFinancial Highlights

  • Q2 revenue: $1.105B; adjusted EBITDA: $223M (20.2% margin); adjusted free cash flow: $139M (62.3% conversion).
  • Working capital: adjusted net working capital as % of revenue improved sequentially by ~90 bps to 27% despite lower revenue base; driven by better receivables and payables management.
  • Margin path: delivered EBITDA margins north of 20% and essentially flat to Q1 despite Middle East disruptions; 3Q guidance calls for adjusted EBITDA margins up at least 100 bps.
  • Cash conversion: 62.3% in Q2 vs 31.1% in Q2 2025 and 36.5% in Q1 2026; 3Q adjusted free cash flow expected >$100M (Mexico collections variability is key driver).
  • Geopolitical and operational impacts: Middle East conflict created activity suspensions, project deferrals, logistical disruptions; freight/logistics costs elevated (peaking in May, moderating thereafter).
  • Saudi Arabia: revenue declined due to LSTK contract conclusion; impact expected to be further visible in 2H.
  • Full-year 2026 guidance update: minimal change to midpoint of adjusted EBITDA; raised adjusted free cash flow conversion outlook to mid-to-high 40% range; effective tax rate expected low-to-mid 20% for 2026.

AI IconCapital Funding

  • Shareholder returns in Q2: $36M total ($20M dividends, $16M share repurchases).
  • Since inception of shareholder return program: returned >$370M via repurchases and dividends.
  • Balance sheet/liquidity: ~$1.14B cash and restricted cash; total liquidity ~$1.7B including cash and credit facilities.
  • Net leverage ratio: declined to 0.34x.

AI IconStrategy & Ops

  • Free cash flow discipline: institutionalized working-capital focus toward 25%+ internal target; second consecutive quarter of adjusted net working capital efficiency improvement.
  • Capital intensity: CapEx $42M (3.8% of revenues); in a 3%-5% CapEx range over a 12-18 month cycle.
  • Geography/operations: Middle East activity profile below pre-conflict levels; freight/logistics costs peaked in May and began moderating; labor strike in Norway pressured activity late in Q2 and remains headwind into Q3.
  • Footprint/cost alignment: aligned cost structure and footprint in Mexico to current activity levels; positioned to respond quickly as activity increases.

AI IconMarket Outlook

  • 3Q 2026 guidance: revenue $1.105B to $1.155B; adjusted EBITDA $235M to $265M; adjusted free cash flow >$100M.
  • Full-year 2026 guidance: revenue $4.54B to $4.80B; adjusted EBITDA $951M to $1.046B; adjusted free cash flow conversion mid-to-high 40% (increased vs prior outlook); effective tax rate low-to-mid 20% range.
  • Profit range context: Middle East conflict financial impact in first half within $30M-$50M; now expected to increase over the course of the year (guidance incorporated recent flare-up).
  • Redomestication timing: special shareholder meetings September 3 to vote on Delaware proposals; completion expected by end of 2026 subject to shareholder and Irish High Court approvals; anticipated $20M-$30M annual cash savings beginning in 2027.

AI IconRisks & Headwinds

  • Middle East conflict: activity suspensions, project deferrals, logistical disruptions; uncertainty remains in short-term outlook; flare-up may sustain significant disruption even if moderating.
  • Saudi LSTK contract conclusion: revenue decline in Saudi; further visibility expected in 2H.
  • Pricing/volume headwinds: pockets of pricing headwinds contributing to volume declines.
  • Labor disruption: Norway union strike impacted activity late in Q2 and remains a headwind into Q3.
  • Working capital volatility remains tied to large customer collections (Mexico) which drives variability in third-quarter free cash flow.

Q&A: Analyst Interest

  • Revenue vs margin trade-off: Management emphasized they need top-line growth but will walk away from contracts lacking the right returns. They framed Saudi LSTK as strategic capability-building, but now focus on higher-margin backlog/pipeline plus technology differentiation and cost out to sustain margin gains.
  • Conflict monthly cadence: Management stated they do not see conflict impact increasing right now and believe it is moderating, but cannot guarantee due to potential flare-ups. They provided regional splits: Saudi normalizing, UAE steady/increasing, Oman consistent, while Bahrain/Qatar/Iraq/Kuwait saw most disruption and renewed uncertainty.
  • Venezuela ramp-up and opportunity size: Management said conversations accelerated faster than expected, with products spanning artificial lift, intervention services, and well services. They noted Venezuela peaked near ~$500M revenue historically, do not expect near-term recovery to that level, and expect a nonlinear ramp from single-digit millions toward tens of millions; specific size deferred to 2027 guidance.

Sentiment: MIXED

Note: This summary was synthesized by AI from the WFRD Q2 2026 earnings transcript. Financial data is complex; please verify all metrics against official SEC filings before making investment decisions.

📋 Official Regulatory 10-K / 10-Q SEC Filings

Direct authenticated documentation links to audited SEC database reports for WFRD.

SEC EDGAR Live Feed
Loading financial data and tables...
📁

SEC Filings (WFRD)

© 2026 Stock Market Info — Weatherford International plc (WFRD) Financial Profile