Toll Brothers, Inc.

Toll Brothers, Inc. (TOL) Market Cap

Toll Brothers, Inc. has a market capitalization of $13.64B.

Price: $145.89

-4.14 (-2.76%)

Market Cap: 13.64B

NYSE · time unavailable

CEO: Karl K. Mistry

Sector: Consumer Cyclical

Industry: Residential Construction

IPO Date: 1986-07-08

Website: https://www.tollbrothers.com

Toll Brothers, Inc. (TOL) - Company Information

Market Cap: 13.64B|Sector: Consumer Cyclical

Company Profile

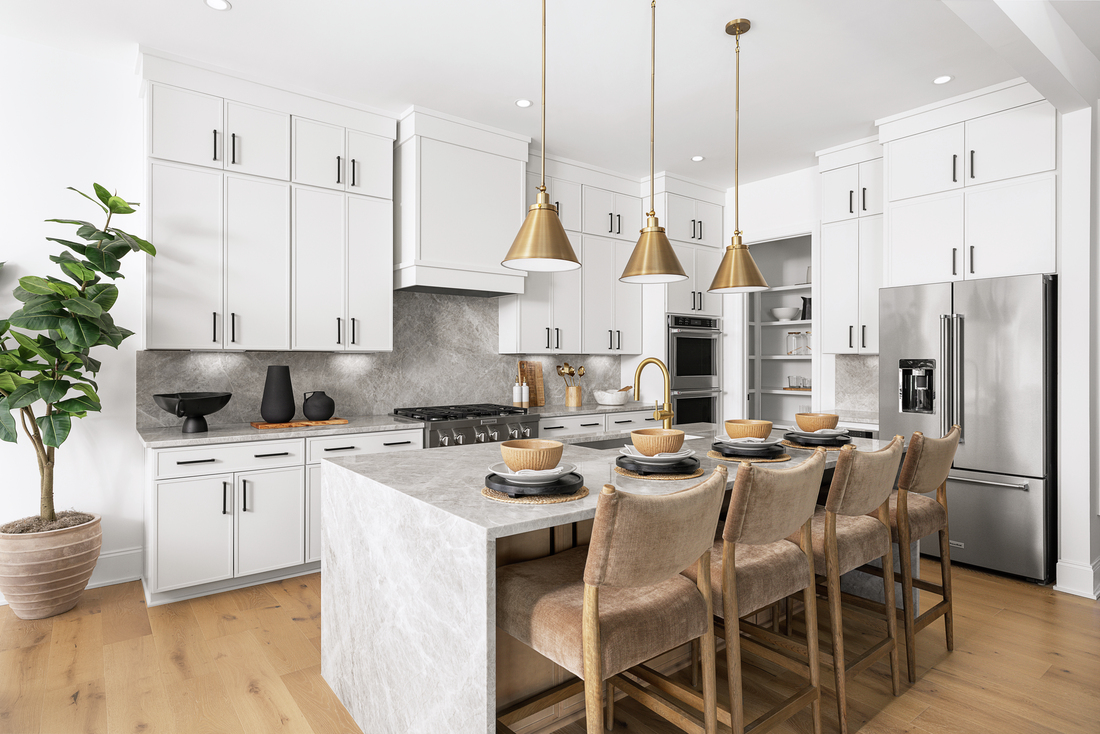
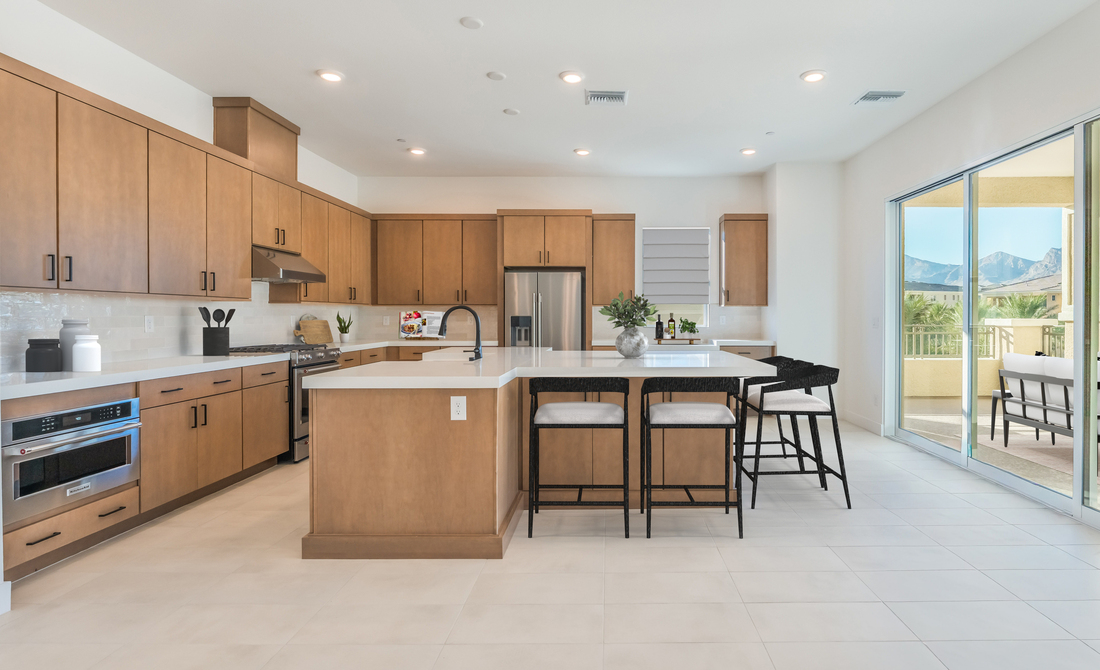
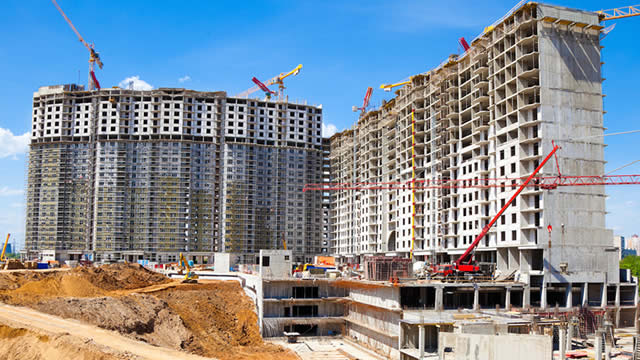
Toll Brothers, Inc. (TOL) stands as a prominent luxury homebuilder operating across the United States. The company, along with its various divisions, specializes in the design, construction, marketing, sale, and financing of upscale detached and attached residences within master-planned communities. Its operations are structured into two main divisions: Traditional Home Building and City Living. The latter specifically focuses on developing, constructing, and selling condominiums. Beyond its core homebuilding activities, Toll Brothers diversifies its portfolio by developing and managing golf courses and country clubs, acquiring and divesting land, and constructing, operating, and leasing apartment complexes. It further enhances its offerings by providing a wide array of interior design and finishing selections, encompassing everything from flooring and cabinetry to smart home systems and security features. The firm maintains a vertically integrated structure, with its own operations spanning architectural and engineering services, mortgage and title insurance, smart home technology, landscaping, lumber distribution, and the manufacturing and assembly of various housing components. Its clientele primarily consists of affluent buyers, including those seeking to upgrade their homes, empty-nesters, active adults, and individuals purchasing second homes. Toll Brothers has also forged a strategic alliance with Equity Residential to jointly develop new rental apartment communities across various U.S. markets. Established in 1967, the company's headquarters are situated in Fort Washington, Pennsylvania.

Analyst Sentiment

73%
Strong Buy

From 19 Active Polls

1Y Forecast: $169.63

▲ +16.3% Potential Upside

Consensus Target Metrics

Low Bound

$122

Median

$175

High Bound

$187

Average

$170

Price & Moving Averages

Loading chart...

🎯 Wall Street Analyst Intelligence Report

1-Year structural target targets, chart projections, and sentiment maps.

Average 1Y Target
$169.63
▲ +16.27% Upside
Low Target
$122.00
-16% Risk
Median Target
$175.00
20% Mid
High Target
$187.00
28% Max
Consensus
Buy
23 / 46 Buys

Consensus Trend Projection

Trailing closures vs. 12-month metrics map.

Analyst Vote Distribution

Aggregate institutional coverage sentiment weights.

📊 Historical Valuation Multiples

Real-time Trailing Twelve Month (TTM) momentum side-by-side with discrete quarterly metrics.

Fiscal QuarterTTMQ2 2026Q1 2026Q4 2025Q3 2025Q2 2025Q1 2025Q4 2024Q3 2024
Period EndingTrailing 12MApr 30, 2026Jan 31, 2026Oct 31, 2025Jul 31, 2025Apr 30, 2025Jan 31, 2025Oct 31, 2024Jul 31, 2024
Market Cap ($M)13,63613,52413,82813,05711,80310,07613,69414,89514,696
Enterprise Value ($M)15,45415,34215,47914,71514,02212,31915,99216,55416,752
Price to Earnings Ratio (P/E)10.9512.9716.427.307.877.1419.297.849.80
Price/Earnings-to-Growth Ratio (PEG)0.720.451.050.150.35
Price to Sales Ratio (P/S)1.235.346.443.814.013.687.374.475.39
Price to Book Ratio (P/B)1.641.601.641.581.461.271.761.941.98
Price to Free Cash Flow Ratio (P/FCF)11.22122.96-1192.6616.9134.2229.02-31.2622.4298.07
Enterprise Value to Sales (EV/Sales)6.067.214.304.764.508.604.976.14
Enterprise Value to EBITDA (EV/EBITDA)8.6341.7353.4124.0426.8824.7267.0425.5931.98
Debt to Equity Ratio1.010.340.340.350.380.370.370.390.40

📘 Full Research Report

ℹ️

AI-Generated Research: This report is for informational purposes only.

📘 TOLL BROTHERS INC (TOL) — Investment Overview

🧩 Business Model Overview

Toll Brothers is a U.S. residential homebuilder focused on move-up and luxury segments, developing communities that convert land into finished homes. The value chain spans (1) land acquisition and site control, (2) entitlement and land development, (3) construction management and procurement, and (4) sales and closing to end homeowners, typically supported by strong local marketing and sales operations.

The business model is community-based: once a project is under development, the firm can manage phases (infrastructure, model homes, and home construction) to align deliveries with demand and pricing. Revenue is realized at closing, making the company’s economics strongly tied to construction productivity, land cost basis, and the pricing environment at the time of delivery.

💰 Revenue Streams & Monetisation Model

Home sales are the primary monetisation channel and are inherently transactional. The company also generates ancillary revenue through options and upgrades (typical in structured homebuilding, such as design selections) and other related activities embedded in the purchase experience, though the core profit engine remains the spread between the contracted selling price and the fully loaded cost to build and deliver the home.

Margin drivers tend to fall into three buckets:

  • Land economics: cost of land, development costs, and the timing of land-to-close conversion.
  • Construction efficiency: labor productivity, material procurement discipline, and operational execution.
  • Pricing and mix: community positioning (higher-end finishes, urban/suburban appeal), product mix, and the ability to maintain unit margins during varying market cycles.

🧠 Competitive Advantages & Market Positioning

Toll Brothers’ competitive positioning is best viewed as a mix of scale advantages in development execution and intangible credibility in the premium segment, rather than classic “switching costs” or “network effects” typical of software. Buyers can choose other builders, but high-end communities rely on trust, proven product quality, and delivery performance—factors that influence supplier selection, customer confidence, and the ability to command favorable sales absorption in the luxury/move-up tier.

  • Premium-segment focus as a moat: Competitors may be more exposed to broader, more price-sensitive demand cohorts. Toll’s focus can support more stable demand characteristics within its target geography-product fit.
  • Land sourcing and entitlement capability: Successful homebuilding requires access to buildable, well-located sites and navigation of local permitting and development processes. Repeat execution can reduce avoidable friction and improve conversion economics.
  • Operating discipline: In a cyclical industry, maintaining cost controls, procurement leverage, and construction scheduling discipline helps protect margins across cycles.

Competitive benchmarking:

  • Lennar (LEN) and PulteGroup (PHM) tend to span broader price points and have large-scale operational platforms. They compete for both entry-level and move-up demand, sometimes with different inventory and product strategies.
  • D.R. Horton (DHI) is generally more weighted toward the entry-level/mass market. That exposure can shift margin dynamics materially when affordability tightens or demand shifts.
  • NVR (NVR) has historically competed with a strong regional footprint and disciplined execution, particularly in certain geographies.

Compared with these rivals, Toll Brothers is structurally more concentrated in the premium/move-up ecosystem, where product differentiation, community design, and delivery reliability matter more for customer decision-making and where execution quality can translate into better absorption and pricing resilience (though not immune to macro cycles).

🚀 Multi-Year Growth Drivers

Over a 5–10 year horizon, growth is driven less by market share capture alone and more by the scale of underlying housing demand relative to the supply pipeline:

  • Housing supply constraints: Persistent shortage dynamics—shaped by land availability, zoning constraints, and slower permitting—support a higher probability of long-run pricing power for well-positioned builders.
  • Demographics and household formation: Formation of new households and ongoing household “move-up” behavior increase the number of purchase decisions in the move-up and premium tiers.
  • Product evolution: Demand for modern layouts, energy-conscious features, and community amenities can support better mix outcomes and reduce the frequency of “stale” inventory.
  • Community development capability: The firm’s ability to source and convert sites into sellable product supports a durable pipeline that can compound through cycles when executed with capital discipline.
  • Build-to-rent and related community concepts (where pursued): While still subject to financing and affordability dynamics, alternative end-uses can broaden addressable demand and smooth cycle volatility when executed prudently.

⚠ Risk Factors to Monitor

  • Interest-rate and affordability sensitivity: Mortgage availability and borrowing costs can quickly change buyer purchasing power and absorption rates, pressuring margins.
  • Land and inventory risk: If pace of deliveries slows or pricing weakens, inventory carrying costs and potential write-down exposure can rise.
  • Construction cost inflation: Material and labor costs can move faster than selling prices, compressing gross margins if contracts and procurement strategies do not offset cost pressure.
  • Entitlement and regulatory complexity: Permitting delays, local zoning changes, and environmental requirements can extend timelines and increase development costs.
  • Execution and project-level variance: Homebuilding is operationally granular; subcontractor performance, scheduling, and quality control affect warranty and reputational outcomes.
  • Credit cycle stress: While homebuilders are not deposit-taking institutions, buyer financing constraints and potential increases in cancellations can tighten cash generation.

📊 Valuation & Market View

Homebuilders are typically valued through a cycle-aware lens that blends profitability prospects and balance-sheet quality. Key valuation frameworks used by market participants often include P/B, EV/EBITDA-style approaches during stable phases, and equity discounting when inventory risk or margin compression appears elevated.

Key drivers that move underwriting and investor sentiment include:

  • Gross margin outlook: influenced by land basis, construction cost trends, and the ability to maintain pricing and mix.
  • Capital allocation discipline: pace of land purchases versus delivery capacity, and the quality of the land bank (location, development readiness, and expected selling price).
  • Balance-sheet resilience: liquidity, debt maturity profile, and how quickly cash converts from lots to closings.
  • Volume and absorption: deliveries and community sell-through, which directly affect operating leverage.

🔍 Investment Takeaway

Toll Brothers offers an institutional value proposition centered on premium-segment positioning backed by execution capabilities in land development and construction. The durability of the investment case depends on (1) disciplined land-to-delivery conversion, (2) margin protection through cost and pricing cycles, and (3) continued demand support from structural housing supply constraints. In a sector where outcomes are cyclically volatile, Toll’s relative advantage is most credible when premium mix and operational discipline translate into resilient cash generation.


⚠ AI-generated — informational only. Validate using filings before investing.

📰 Market News & Coverage

15 Stories Available

Real-time institutional reporting and market updates for TOL.

globenewswire.com2026-07-30

Toll Brothers Announces Tribute at Valor is Now Open in Kuna, Idaho

KUNA, Idaho, July 30, 2026 (GLOBE NEWSWIRE) -- Toll Brothers, Inc. (NYSE: TOL), the nation's leading builder of luxury homes, today announced its newest Boise-area community, Tribute at Valor, is now open in Kuna, Idaho. This luxury master-planned community features four distinct collections of thoughtfully designed single-family homes, planned resort-style amenities, and the opportunity for an exceptional lifestyle just minutes from Boise.

globenewswire.com2026-07-30

Toll Brothers Announces Tribute at Valor is Now Open in Kuna, Idaho

Luxury master-planned community offers exceptional home designs and an elevated lifestyle in the Treasure Valley Luxury master-planned community offers exceptional home designs and an elevated lifestyle in the Treasure Valley

globenewswire.com2026-07-29

Toll Brothers to Webcast Its Third Quarter 2026 Earnings Conference Call Live on August 19, 2026 at 8:30 a.m. (ET)

FORT WASHINGTON, Pa., July 29, 2026 (GLOBE NEWSWIRE) -- Toll Brothers, Inc. (NYSE:TOL), the nation's leading builder of luxury homes, will broadcast live on its website, www.TollBrothers.com, a conference call to discuss results for its third quarter ending July 31, 2026. The call is scheduled for 8:30 a.m. (ET) on Wednesday, August 19, 2026. The call will be hosted by Douglas C. Yearley, Jr., Executive Chairman of the Board, and Karl K. Mistry, Chief Executive Officer. The Company will announce its third quarter FY 2026 results after the market close on Tuesday, August 18, 2026.

globenewswire.com2026-07-29

Toll Brothers Opens Cambric Village – Enclave Collection in Greenville, South Carolina

GREENVILLE, S. C. , July 29, 2026 (GLOBE NEWSWIRE) -- Toll Brothers, Inc. (NYSE: TOL), the nation's leading builder of luxury homes, today announced its newest luxury home community, Cambric Village, is now open in Greenville, South Carolina. This highly anticipated community will offer two distinct collections of homes, including luxury single-family residences open now and spacious townhomes opening in summer 2027.

globenewswire.com2026-07-29

Toll Brothers Opens Cambric Village – Enclave Collection in Greenville, South Carolina

New luxury home neighborhood offers single-family homes in a prime location New luxury home neighborhood offers single-family homes in a prime location

zacks.com2026-07-28

Toll Brothers (TOL) Outperforms Broader Market: What You Need to Know

The latest trading day saw Toll Brothers (TOL) settling at $154.98, representing a +2.63% change from its previous close.

globenewswire.com2026-07-28

Toll Brothers Announces Peapack Crossing is Now Open in Peapack, New Jersey

PEAPACK, N.J., July 28, 2026 (GLOBE NEWSWIRE) -- Toll Brothers, Inc. (NYSE:TOL), the nation's leading builder of luxury homes, today announced its newest luxury home community, Peapack Crossing, is now open in Somerset County, New Jersey. Featuring two distinct collections of homes, Peapack Crossing offers a rare blend of serenity and convenience in one of New Jersey's most desirable locations. The community's Sales Center is located at 2 Brandywine Drive in Peapack.

globenewswire.com2026-07-27

Toll Brothers Announces Final Opportunity to Own a Luxury Condominium at Mira Villa in Las Vegas

LAS VEGAS, July 27, 2026 (GLOBE NEWSWIRE) -- Toll Brothers, Inc. (NYSE: TOL), the nation's leading builder of luxury homes, today announced the final opportunity to purchase a new move-in ready home at Mira Villa, an exclusive community of mid-rise luxury condominiums in Las Vegas, Nevada.

globenewswire.com2026-07-27

Toll Brothers Announces Final Opportunity to Own a Luxury Condominium at Mira Villa in Las Vegas

Elegant Summerlin community offers low-maintenance living with resort-style amenities Elegant Summerlin community offers low-maintenance living with resort-style amenities

zacks.com2026-07-27

Toll Brothers Inc. (TOL) Is a Trending Stock: Facts to Know Before Betting on It

Toll Brothers (TOL) has received quite a bit of attention from Zacks.com users lately. Therefore, it is wise to be aware of the facts that can impact the stock's prospects.

globenewswire.com2026-07-23

Toll Brothers Announces Grand Opening of New Design Studio in San Antonio, Texas

SAN ANTONIO, July 23, 2026 (GLOBE NEWSWIRE) -- Toll Brothers, Inc. (NYSE: TOL), the nation's leading builder of luxury homes, today announced the grand opening of its new Toll Brothers Design Studio in San Antonio, Texas. The public is invited to attend the grand opening event on Friday, July 31 from 4 p.m. to 7 p.m. at 15337 San Pedro Avenue in San Antonio. Light refreshments, cocktails, and hors d'oeuvres will be served.

globenewswire.com2026-07-23

Toll Brothers Announces Opening of New Luxury Home Community and Award-Winning Model Home in Mapleton, Utah

Toll Brothers at Mapleton features expansive luxury homes with up to nine bedrooms Toll Brothers at Mapleton features expansive luxury homes with up to nine bedrooms

globenewswire.com2026-07-22

Toll Brothers Announces New Luxury 55+ Community Now Open in Exton, Pennsylvania

Regency at Valley Creek offers low-maintenance living with exceptional amenities in Chester County Regency at Valley Creek offers low-maintenance living with exceptional amenities in Chester County

defenseworld.net2026-07-22

Toll Brothers Inc. $TOL Shares Bought by Dimensional Fund Advisors LP

Dimensional Fund Advisors LP lifted its stake in Toll Brothers Inc. (NYSE: TOL) by 3.5% during the first quarter, according to its most recent disclosure with the Securities and Exchange Commission. The fund owned 2,990,447 shares of the construction company's stock after buying an additional 100,718 shares during the quarter. Dimensional Fund Advisors

globenewswire.com2026-07-21

Toll Brothers Announces Rivercrest Community Now Open in Reno, Nevada

Exclusive townhome community offers modern designs in the heart of Old Southwest Reno Exclusive townhome community offers modern designs in the heart of Old Southwest Reno

📊 AI Financial Analysis

Powered by StockMarketInfo
Earnings Data: Q Ending 2026-04-30

"TOL reported Q2 2026 results with Revenue of $2.53B and Net Income of $261M (EPS $2.74) for the quarter ended 2026-04-30. YoY, Revenue rose from $2.74B in Q2’25 to $2.53B in Q2’26 (-7.7%), while Net Income increased from $352M (+8.7% YoY). QoQ, Revenue grew from $2.15B in Q1’26 to $2.53B (+17.9%), and Net Income rose from $211M (+23.6%). Profitability softened on a quarter-to-quarter basis: gross margin slipped to ~23.9% in Q2’26 vs ~22.8% in Q1’26 (slight improvement), but net margin edged down to ~10.3% from ~9.8% and remains well below the stronger mid-2025 quarters (e.g., Q4’25 ~13.0%). Cash generation was solid in Q2’26 with Operating Cash Flow of $134M and Free Cash Flow of ~$110M. Capital returns were active: share repurchases of ~$50M more than offset modest dividends (~$24M). Balance sheet resilience appears intact for a homebuilder: total assets were ~$14.5B with equity of ~$8.5B, while total debt was ~$2.65B and net debt ~$1.54B—manageable given profitability improvements vs last year. On total shareholder returns, the stock shows strong momentum with a +59.8% 1y_change, supporting a favorable total-return view even with low stated dividend yield (~0.18%)."

Revenue Growth

Fair

QoQ Revenue increased +17.9% ($2.15B to $2.53B) but YoY Revenue declined -7.7% ($2.74B to $2.53B), indicating a volume/revenue headwind despite near-term rebound.

Profitability

Positive

Net Income grew +23.6% QoQ and +8.7% YoY, with net margin around 10.3% in Q2’26. Margins are below the stronger Q4/Q3’25 levels (~12.6–13.0% net margin), suggesting profitability is improving but not yet back to peak.

Cash Flow Quality

Good

Q2’26 Operating Cash Flow of $134M and Free Cash Flow of ~$110M were positive. Capital return is supported by repurchases (~$50M) and dividends (~$24M), with free cash flow covering capital returns.

Leverage & Balance Sheet

Good

Total assets were ~$14.5B with equity ~$8.5B (equity stable YoY in the ~$7.9–8.5B range). Debt increased modestly vs Q1 but net debt remains manageable (~$1.54B), supporting resilience.

Shareholder Returns

Strong

Strong 1-year capital appreciation (+59.8%) plus buybacks (repurchases ~$50M in the quarter) provide high total return. Dividend yield is low (~0.18%), so buybacks and price performance drive returns.

Analyst Sentiment & Valuation

Positive

With current price ~$146.68 and consensus target ~$166.38, implied upside is modest (~+13.5%). Valuation multiples from the latest quarter appear elevated vs earlier periods, so upside may rely on earnings/price momentum continuation.

Disclaimer:This analysis is AI-generated for informational purposes only. Accuracy is not guaranteed and this does not constitute financial advice.

Fundamentals Overview

Loading fundamentals overview...

Toll Brothers delivered another quarter of margin-resilient performance despite a challenging demand backdrop, beating guidance on revenue, EPS, and profitability. Q2 delivered 2,491 homes at a $1.009M average price, generating $2.5B revenue and $2.72 adjusted EPS—$0.18 above the midpoint. Adjusted gross margin reached 26.2% (70 bps over guidance) and SG&A landed at 10.3% (40 bps better), supported by luxury move-up mix and ongoing operating efficiency. Management highlighted contained incentives at 8% for four straight quarters and solid cancellation behavior (industry-low). The company raised FY26 deliveries and pricing assumptions, lifted full-year adjusted gross margin by 10 bps to 26.1%, and improved SG&A margin guidance to 10.1%, embedding its $650M buyback target. In Q&A, analysts focused on whether lower Q3 margin is “seasonality” versus structural weakness; management framed it as timing/mix normalization. Key near-term risk is conversion timing sensitivity to consumer confidence at Toll’s luxury price point.

AI IconGrowth Catalysts

  • Luxury move-up mix increased: move-up business 62% of home sales revenue (from 59% in Q1), supporting margin resilience
  • Community expansion: selling from 459 communities vs 421 one year earlier; expects 480-490 selling communities at FY-end (includes Buffington acquisition)
  • Spec strategy improvement: reduced finished-spec inventory by 28% in 1H FY26; held 2 finished specs per community vs 2.8 at FY25 end
  • Production efficiency: build-to-order cycle time improved to ~9 months; spec cycle ~1 month shorter than BTO

Business Development

  • Buffington Homes acquisition for entry into Northwest Arkansas (Fayetteville/Bentonville; Walmart home); ~1,500 lots in pipeline; anticipated settlements ~50 in FY26

AI IconFinancial Highlights

  • Beat guidance: homebuilding revenue $2.5B (~$110M above midpoint); EPS $2.72 per diluted share (~$0.18 beat vs midpoint)
  • Margin beats: adjusted gross margin 26.2% (70 bps better than guidance of 25.5%); SG&A 10.3% of revenue (40 bps better than guidance of 10.7%)
  • Incentives remained contained: average incentive for new contracts flat at 8% of gross sales price for 4 consecutive quarters
  • Cancellation trends favorable: cancellation rate 2.9% of beginning quarter backlog (vs 2.8% prior year); 4.8% vs 6.2% prior year as % of signed contracts
  • Tax: Q2 tax rate 25.6% (40 bps better than guidance)
  • Write-offs: $32.5M in home sales gross margin; ~$20M related to deal drop/option write-offs tied to underwriting standards; remainder tied to operating communities
  • Liquidity and leverage improved vs prior year: liquidity ~$3.3B ($1.1B cash, $2.2B revolver availability); net debt-to-capital 15.4% vs 19.8% one year ago

AI IconCapital Funding

  • Share repurchases: $175M in Q2; ~$226M year-to-date; target $650M for fiscal 2026
  • No explicit new debt issued/disclosed in transcript; emphasis on low net debt and investment-grade credit rating

AI IconStrategy & Ops

  • Discipline on pace/price/incentives: balancing sales pace, price, and incentives to maximize returns in a challenging demand environment
  • Spec-to-studio monetization: goal to sell specs earlier; design studio upgrades structural options and lot premiums average $219,000 (25% of average base sales price)
  • Cost management: building costs flat sequentially even with lumber rising; modest impacts from tariffs and ability to offset diesel/oil/fuel surcharges
  • Operating cost discipline: advertising cut with outside broker commission rates down slightly

AI IconMarket Outlook

  • Q3 deliveries: ~2,600 to 2,700 homes; average delivered price $965k-$985k
  • Full-year deliveries: raised to 10,400 to 10,700 homes (up 100 homes at low end); average delivered price guidance raised to $985k-$1.0M (midpoint +$12.5k)
  • Full-year adjusted gross margin guidance raised +10 bps to 26.1% (implies Q4 adjusted gross margin ~26.3%)
  • Full-year SG&A margin guidance improved +15 bps to 10.1%
  • Cost of sales estimate: ~1.1% for Q3 and full year
  • Tax rate guidance: Q3 ~26.0%; full year ~25.5%
  • Community count at FY-end: 480-490 (8%-10% vs 446 at FY25 end); 475 communities expected at end of Q3
  • Repurchase assumption embedded in share count guidance: weighted average share count ~95M for Q3 and full year assuming $650M target

AI IconRisks & Headwinds

  • Demand environment remains challenging; customers taking longer to convert (conversion timing tied to consumer confidence at Toll’s price point)
  • Regional softness: weaker markets included Atlanta, San Antonio, Seattle, Portland, and San Francisco (while Florida improved)
  • Market uncertainty: spec and luxury settlement timing drives quarterly margin volatility (Q3 lower GM expected due to mix and settlement timing of higher-margin Pacific outcomes)
  • Potential tariff and commodity cost risk: management says impacts so far have been modest, including limited evidence on tariffs, but 2027 impacts remain “too early to tell”
  • Spec delivery mix timing: later-stage spec deliveries in Q3 pressured margins; reliance on seasonality/settlement cadence

Q&A: Analyst Interest

  • Demand conversion/traffic and spec behavior: Management said demand was consistent through the quarter and early May; conversions are taking longer as customers wait for confidence at the price point. For specs, they emphasized selling earlier to drive studio customization benefits, but noted execution timing affects quarter-to-quarter performance rather than buyer disengagement.
  • Margin bridge Q2 vs Q3 vs Q4: Management attributed Q3 lower gross margin to mix—less favorable Pacific contribution, higher luxury move-up density, and later-stage spec deliveries landing in Q3—plus timing of settlements. Q4 expected rebound to ~26.3% GM driven by reversal of that mix and more early-stage spec deliveries.
  • Inflation/tariffs and cost pushback: Management stated most homes are well underway and they kept costs flat despite lumber increases, using offsets. They cited modest impacts so far from tariffs, and while oil/fuel surcharges are being heard, they have been finding ways to offset through at least FY26; 2027 remains uncertain.

Sentiment: POSITIVE

Note: This summary was synthesized by AI from the TOL Q2 2026 earnings transcript. Financial data is complex; please verify all metrics against official SEC filings before making investment decisions.

📋 Official Regulatory 10-K / 10-Q SEC Filings

Direct authenticated documentation links to audited SEC database reports for TOL.

SEC EDGAR Live Feed
Loading financial data and tables...
📁

SEC Filings (TOL)

© 2026 Stock Market Info — Toll Brothers, Inc. (TOL) Financial Profile