📘 TORM plc (TRMD) — Investment Overview
🧩 Business Model Overview
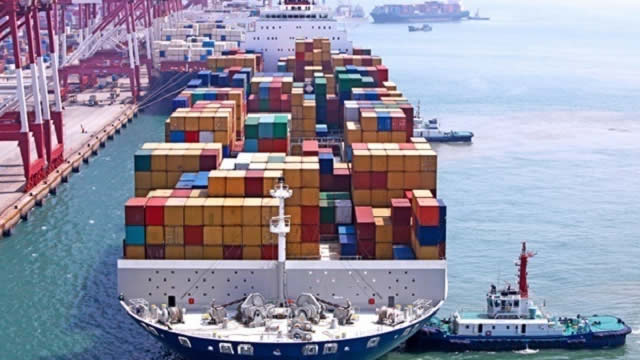
TORM plc is a specialist global shipping company focused on the transportation of petroleum products and, to a lesser extent, chemicals and other dry-bulk-adjacent niches depending on fleet deployment. The company operates primarily through a modern fleet of medium-range and flexibly utilized product tankers, enabling exposure to refined product trade flows rather than crude oil volumes alone. The core economic engine is the ability to secure charters for tanker capacity and convert prevailing freight rates into operating cash flow, while maintaining fleet efficiency, safety compliance, and disciplined technical/operational management.
TORM’s business model blends commercial chartering capabilities with in-house operational oversight. The company typically participates in a mix of charter structures (time-charter and voyage exposures) that can smooth cash flow versus pure spot-only dynamics, while still preserving upside potential when market conditions strengthen. Fleet strategy—fleet age profile, vessel utilization, and maintenance planning—directly influences both cost competitiveness and the ability to capture available commercial opportunities. In periods of stress, the ability to keep vessels trading efficiently and maintain counterpart relationships becomes a key determinant of resilience.
💰 Revenue Streams & Monetisation Model
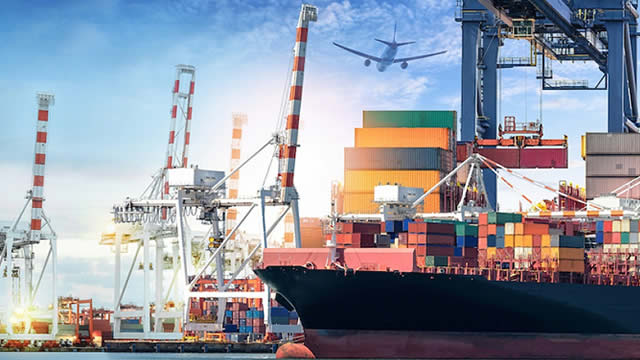
Revenue for product tanker operators is fundamentally tied to earned freight rates, which are influenced by global refined product demand, refinery utilization and output patterns, trade distance/geography shifts, fleet supply growth (including orderbooks and delivery schedules), and seasonal effects on product movement. Monetisation occurs through charter contracts that translate vessel availability into daily revenue streams. Depending on the charter type, TORM may bear more or less exposure to fuel costs, port and canal costs, and certain voyage-specific expenses; the economic sensitivity is therefore not uniform across the fleet.
The monetisation model can be summarized as follows:
- Freight earnings: Daily charter revenues (or voyage-based revenue streams converted to an effective daily figure) driven by market rates and route demand.
- Operational efficiency: Technical performance, maintenance scheduling, and crew/management practices that reduce off-hire time and improve utilization.
- Commercial discipline: Chartering strategy that balances rate levels, contract duration, and counterparty quality to manage downside risk while retaining upside.
- Capital allocation: Decisions around fleet renewal, sale-and-purchase activity, and capital returns that shape long-run earnings power and balance-sheet flexibility.
For investors, the principal analytical task is connecting fleet deployment decisions to expected utilization and net operating margin across cycles. Product tanker earnings are typically cyclical; therefore, value creation tends to be strongest when operational excellence and commercial risk management allow the company to preserve cash generation through downturns and capitalize during upcycles.
🧠 Competitive Advantages & Market Positioning
TORM operates in a commodity-like market structure—shipping rates are cyclical and influenced by macro and trade variables. That said, competitive advantage in tanker shipping often comes from execution rather than branding. Key differentiators for TORM typically include:
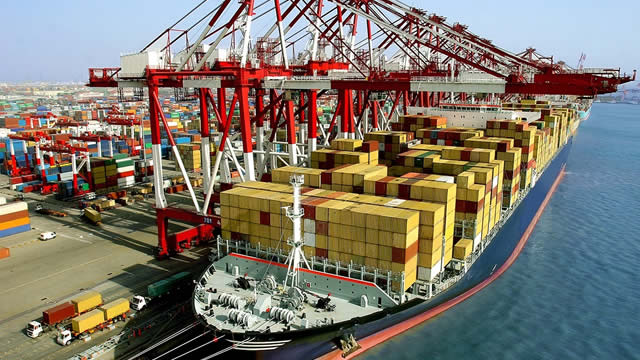
- Fleet quality and deployability: A modern, efficiently managed fleet can secure better commercial terms and experiences lower risk of extended off-hire, improving the conversion of market opportunities into realized earnings.
- Commercial and chartering capability: The ability to source and structure charters across changing trade routes can materially affect netback compared with peers that rely more heavily on less favorable timing or counterpart networks.
- Operational management and safety culture: In shipping, consistent compliance, reliability, and maintenance standards help avoid costly disruption and protect the vessel’s earning potential.
- Risk management focus: The company’s approach to maintaining liquidity, monitoring counterpart credit exposure, and managing balance-sheet resilience supports endurance through industry volatility.
Market positioning is reinforced by the company’s specialization in product tankers and its capacity to participate in refined products movement patterns that are tightly linked to global energy demand, refinery configurations, and regional consumption. As the refined product complex evolves (for example, due to changing refinery capacities and product yield patterns), demand for flexible shipping tonnage can shift; a capable operator can benefit by matching vessel capabilities with route characteristics and cargo requirements.
🚀 Multi-Year Growth Drivers
Long-term drivers for TORM are best viewed through the lens of fleet supply-demand dynamics and structural shifts in refined products trade. While shipping is cyclical, multi-year outcomes depend on whether industry fundamentals and fleet composition favor earnings stability.
- Refined product trade growth: Global demand for transportation of refined products remains supported by industrial activity, power generation inputs, and ongoing consumption patterns in major importing regions.
- Refinery configuration and yield changes: Shifts in what refineries produce and where products are consumed can increase average transport distances and alter trade lanes—supporting sustained ton-mile demand.
- Fleet supply discipline: The industry orderbook and delivery pace influence effective fleet growth. If deliveries slow, or if scrapping and recycling accelerate, market tightness can improve.
- Regulatory and efficiency tailwinds: Environmental standards create incentives for higher-quality vessels and can increase operating costs for older fleets, effectively tightening the competitive landscape and improving relative earning potential for compliant tonnage.
- Technological and operational optimization: Improvements in voyage planning, energy efficiency, maintenance regimes, and crew productivity can raise net earnings per day by reducing cost per ton-mile and off-hire risk.
- Potential fleet redeployment opportunities: Flexible deployment across charter structures can help capture better risk-adjusted returns, particularly when market dispersion widens across routes and contract tenors.
Over a full cycle, the most durable growth narratives typically combine (1) favorable industry fundamentals and (2) disciplined fleet and balance-sheet management that protects shareholder value when freight markets trough. For TORM, the strategic emphasis on fleet quality and operational excellence is the key pathway through which macro/industry conditions translate into sustained multi-year shareholder outcomes.
⚠ Risk Factors to Monitor
Investment outcomes for tanker operators are strongly exposed to cyclicality. A robust diligence framework should focus on both external risks (industry, macro, geopolitics) and company-specific execution risks.
- Freight rate volatility: Product tanker earnings can swing materially with changes in supply (fleet growth, scrapping, idling) and demand (refined product balances, economic activity).
- Charter counterparty risk: Exposure to counterpart credit quality can create cash flow disruptions if receivables or disputed performance terms arise.
- Fuel and operating cost pressure: The cost base can change with bunker prices, logistics, and compliance spending, affecting net margins even when gross revenue remains stable.
- Regulatory and compliance risk: Evolving emissions rules and reporting requirements can increase capex and operating costs, particularly for older vessels or for fleets requiring retrofits.
- Fleet technical and off-hire risk: Safety incidents, dry-docking schedules, and unplanned repairs can reduce utilization and compress earnings.
- Market structure and competitive dynamics: If new deliveries increase tonnage supply faster than demand growth, earnings can normalize to lower levels.
- Balance-sheet and liquidity sensitivity: Capital markets access, interest rate dynamics, and refinancing conditions can influence the ability to execute fleet strategy through downturns.
Given the sensitivity to market cycles, investors should also evaluate governance and risk controls around capital allocation: fleet purchases/sales, leverage targets, and dividend/buyback policies in relation to industry troughs and liquidity buffers. The objective is to ensure that shareholder returns remain sustainable across adverse freight environments rather than relying on favorable market timing.
📊 Valuation & Market View
Valuation for shipping equities like TORM is typically more nuanced than for steady-state industrial businesses. Traditional valuation multiples can be distorted by cyclicality in earnings and by mark-to-market or working-capital variability. As a result, investors often triangulate valuation using:
- Asset and fleet-backed value: Evaluating the implied net asset value trajectory based on vessel values, age profile, and expected residual values under regulatory constraints.
- Cash flow normalization: Using scenario-based freight earnings models across different parts of the cycle rather than relying on a single earnings point.
- Downside protection: Assessing the company’s ability to generate liquidity and maintain solvency through trough freight conditions, including debt maturities, covenant headroom, and expected operating cash flows.
- Earnings quality: Distinguishing between operating cash generation and accounting outcomes influenced by non-cash items or timing effects.
In market terms, a constructive view generally emerges when:
- Industry supply growth is constrained relative to refined product trade demand;
- Higher-quality or compliant fleets capture a larger share of available employment;
- TORM’s utilization and net operating costs remain competitive; and
- The balance sheet preserves optionality for fleet strategy in all market regimes.
Conversely, valuation risk increases when freight fundamentals deteriorate for extended periods and when fleet supply pressures intensify, particularly if combined with rising compliance-related costs and constrained refinancing conditions.
🔍 Investment Takeaway
TORM plc is a product tanker operator where the investment case rests on the interaction between (1) cyclical industry fundamentals, (2) disciplined operational execution, and (3) prudent capital and risk management. The company’s long-run prospects are most compelling when a supportive refined product trade environment coincides with favorable fleet supply dynamics and when fleet quality translates into superior utilization and net earnings.
From an investor’s perspective, the central question is not whether freight rates move—shipping equities are structurally cyclical—but whether TORM can consistently convert market conditions into resilient cash flows while preserving balance-sheet strength and maintaining fleet competitiveness under evolving regulatory standards. A well-modeled scenario approach that tests performance across multiple parts of the cycle is essential to underwrite durability of earnings power and shareholder value creation.
⚠ AI-generated — informational only. Validate using filings before investing.