CF Industries Holdings, Inc.

CF Industries Holdings, Inc. (CF) Market Cap

CF Industries Holdings, Inc. has a market capitalization of $17.44B.

Price: $113.49

-4.03 (-3.43%)

Market Cap: 17.44B

NYSE · time unavailable

CEO: Christopher D. Bohn

Sector: Basic Materials

Industry: Agricultural Inputs

IPO Date: 2005-08-11

Website: https://www.cfindustries.com

CF Industries Holdings, Inc. (CF) - Company Information

Market Cap: 17.44B|Sector: Basic Materials

Company Profile

CF Industries Holdings, Inc. manufactures and sells hydrogen and nitrogen products for energy, fertilizer, emissions abatement, and other industrial activities worldwide. Its principal products include anhydrous ammonia, granular urea, urea ammonium nitrate, and ammonium nitrate products. The company also offers diesel exhaust fluid, urea liquor, nitric acid, and aqua ammonia products; and compound fertilizer products with nitrogen, phosphorus, and potassium. It primarily serves cooperatives, independent fertilizer distributors, traders, wholesalers, and industrial users. The company was founded in 1946 and is headquartered in Deerfield, Illinois.

Analyst Sentiment

54%
Hold

From 22 Active Polls

1Y Forecast: $109.44

▼ -3.6% Potential Upside

Consensus Target Metrics

Low Bound

$72

Median

$103

High Bound

$145

Average

$109

Price & Moving Averages

Loading chart...

🎯 Wall Street Analyst Intelligence Report

1-Year structural target targets, chart projections, and sentiment maps.

Average 1Y Target
$109.44
▼ -3.57% Upside
Low Target
$72.00
-37% Risk
Median Target
$103.00
-9% Mid
High Target
$145.00
28% Max
Consensus
Buy
20 / 41 Buys

Consensus Trend Projection

Trailing closures vs. 12-month metrics map.

Analyst Vote Distribution

Aggregate institutional coverage sentiment weights.

📊 Historical Valuation Multiples

Real-time Trailing Twelve Month (TTM) momentum side-by-side with discrete quarterly metrics.

Fiscal QuarterTTMQ1 2026Q4 2025Q3 2025Q2 2025Q1 2025Q4 2024Q3 2024Q2 2024
Period EndingTrailing 12MMar 31, 2026Dec 31, 2025Sep 30, 2025Jun 30, 2025Mar 31, 2025Dec 31, 2024Sep 30, 2024Jun 30, 2024
Market Cap ($M)17,43520,02112,05714,44214,98713,17614,77715,30713,407
Enterprise Value ($M)19,01321,59914,02216,00016,62715,06616,40916,68014,807
Price to Earnings Ratio (P/E)9.958.147.4610.239.7110.5611.2613.867.98
Price/Earnings-to-Growth Ratio (PEG)1.340.580.711.161.001.15
Price to Sales Ratio (P/S)2.3510.086.448.717.937.929.7011.178.53
Price to Book Ratio (P/B)3.283.752.492.983.022.762.962.952.46
Price to Free Cash Flow Ratio (P/FCF)10.7673.3438.5220.1447.1329.0266.2719.3334.29
Enterprise Value to Sales (EV/Sales)10.887.499.648.809.0610.7712.179.42
Enterprise Value to EBITDA (EV/EBITDA)5.4924.8816.1019.4418.4121.6823.4126.5216.67
Debt to Equity Ratio0.460.680.820.700.670.690.650.630.59

CF Growth Runway Model

Standard long term linear growth fade

Multi-Stage Discounted Cash Flow Sandbox

Market Price$113.49
Intrinsic Value$290.44
Market Alignment
Undervalued by 155.9%relative to calculated intrinsic value
9.00%
Exp: 10%10%
i

Growth runway slowdown

This value provides a time window for the growth rate to decline beyond Stage 1 toward the terminal rate. Longer windows are most useful for companies with high growth starting conditions or strong competitive advantages. This option stretches out the growth rate slowdown across 5, 10, or 15-year steps. A high-growth starting condition (exceeding a 25% initial growth rate) automatically applies a curve decay to simulate realistic, rapid market saturation.
i

Terminal growth rate

With long-term inflation between 3-5%, revenue must grow by that baseline to maintain flat real-world market share. This value sets the permanent terminal growth rate to factor into the valuation beyond the growth slowdown runway toward maturity.

3-Stage Financial Runway Horizon

🧠 Perpetuity Horizon Engine (Stage 3: Post-2035)

Terminal FCF Base$3.87B
Perpetuity TV Value$72.78B
Discounted TV (PV)$30.74B
TV Weighting %63.0%
⚠️
Financial Model Disclaimer & Risk Disclosure: This interactive scenario simulator is an educational sandbox provided strictly for informational and analytical research purposes. Core historical financial statements and consensus estimates are sourced directly via Financial Modeling Prep (FMP). All downstream outputs are entirely deterministic, hypothetical projections generated by combining automated mathematical formulas (including linear interpolation and Gaussian bell-curve decay models) with user-selected variables and third-party financial data inputs. Users assume all liability for trading decisions executed based on these sandbox calculations.

📘 Full Research Report

ℹ️

AI-Generated Research: This report is for informational purposes only.

📘 CF INDUSTRIES HOLDINGS INC (CF) — Investment Overview

🧩 Business Model Overview

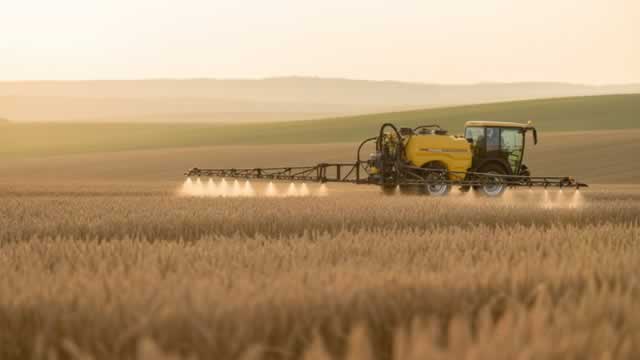
CF INDUSTRIES manufactures nitrogen-based products that serve agriculture and industrial customers. The value chain starts with low-cost natural gas feedstock (used to produce ammonia), followed by conversion into fertilizers such as urea and UAN and distribution through an established network of storage, terminals, and shipping capabilities—particularly oriented around Gulf and export logistics.

The operational model emphasizes an integrated cost position: feedstock procurement and conversion efficiency influence unit economics, while physical infrastructure determines delivered cost and the ability to access both domestic and export markets. Customer stickiness is driven less by contractual lock-in and more by reliability of supply, proximity, and the practical constraints of fertilizer logistics and timing.

💰 Revenue Streams & Monetisation Model

Revenue is predominantly transactional and tied to fertilizer/industrial pricing cycles, but margins are strongly influenced by the spread between product pricing and the underlying natural gas cost (plus power and freight). Key monetisation drivers include:

  • Nitrogen Fertilizers: Sales of urea, UAN, ammonium nitrate and related nitrogen solutions to crop producers and distributors. Fertilizer pricing typically reflects global supply-demand balance and substitution across nitrogen forms.
  • Industrial Nitrogen Products: Supply of ammonia-based products to industrial and specialty end markets, with pricing linked to industrial demand and relative value of nitrogen chemicals.
  • Logistics and Delivered Supply: While product volumes are commodity-like, delivered economics (freight, handling, storage/turnaround, and export access) can protect margins when competing producers face distance or capacity constraints.

Overall, CF’s monetisation model is best understood as a low-cost feedstock and logistics platform capturing margin when global nitrogen pricing exceeds the all-in cost of production and delivery.

🧠 Competitive Advantages & Market Positioning

CF’s competitive positioning is anchored in geographic cost advantage and logistical infrastructure—a combination that lowers delivered cost and expands market reach.

  • Low-Cost Feedstock: Nitrogen production is energy- and feedstock-intensive. Access to competitively priced natural gas and an efficient conversion setup supports a favorable cost curve versus higher-cost regions.
  • Logistical Infrastructure: Ownership and operation of distribution and export-oriented infrastructure improves delivery reliability and reduces effective freight/handling costs. This can matter in periods when alternative sourcing requires longer lead times or higher transport costs.
  • Scale and Operating Discipline: Large, continuous-production assets enable better utilization and fixed-cost absorption than smaller regional peers, which is crucial in a structurally capital-intensive industry.

Competitive benchmarking:

  • Nutrien: A diversified fertilizer producer with meaningful nitrogen exposure, but with a broader portfolio that includes potash and other nutrients. CF’s focus is more concentrated in nitrogen, increasing sensitivity—and potential advantage—to the relative cost of natural gas and delivered logistics.
  • Yara: A global leader in nitrogen fertilizers with strong European footprint. Yara’s cost position can be more exposed to higher European energy input costs and tighter regional supply constraints; CF’s advantage is typically tied to North American feedstock economics and export reach.
  • Mosaic (and other phosphate/potash players): Primarily differentiated by non-nitrogen nutrients. In fertilizer blending markets, nitrogen is often competed with by multi-nutrient suppliers offering mix-and-match crop solutions; CF’s nitrogen specialization provides stronger leverage to nitrogen cost curve dynamics.

Compared with these peers, CF’s edge is less about differentiated agronomy branding and more about cost and logistics mechanics that influence unit competitiveness globally.

🚀 Multi-Year Growth Drivers

Over a 5–10 year horizon, growth is less about company-specific product innovation and more about structural demand and capacity dynamics:

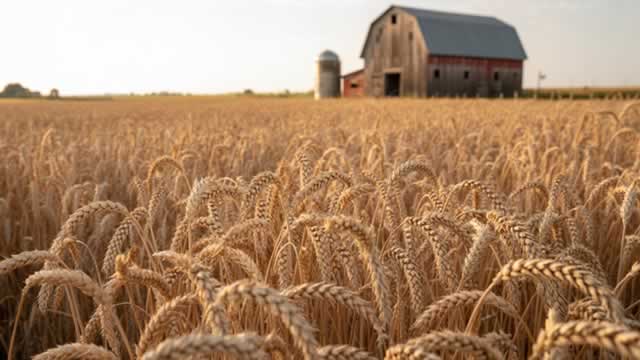
  • Global food and crop productivity needs: Continued demand for nitrogen to support crop yields and farm productivity sustains long-run nitrogen consumption.
  • Nitrogen intensity and application flexibility: Nitrogen remains a core nutrient for most major crops, with multiple product forms enabling substitution and enabling distributors to match farmer preferences and agronomic timing.
  • Global supply discipline and cost-curve dynamics: Because capacity additions are capital intensive and energy-cost sensitive, the industry can be prone to supply underinvestment in higher-cost regions. A low-cost operator can capture a larger share of margin when constraints tighten.
  • Industrial ammonia and downstream opportunities: Expanding industrial use cases for ammonia and nitrogen chemicals can complement fertilizer demand over time, supporting volume diversification (though total impact remains dependent on regulation, economics, and adoption rates).
  • Infrastructure utilization and export market access: Existing export logistics can support global reach as regional imbalances emerge, improving resilience when domestic demand patterns vary.

⚠ Risk Factors to Monitor

  • Energy and feedstock volatility: Natural gas pricing and power costs can swing production economics, altering the fertilizer spread and margin profile.
  • Regulatory and emissions requirements: Nitrogen production is exposed to tightening environmental standards (air permits, greenhouse gas regulation, and potential requirements affecting process efficiency and operating costs).
  • Capital intensity and turnaround risk: The asset base requires maintenance and periodic expansions or retrofits; costs and downtime can compress earnings even when fertilizer pricing is supportive.
  • Global competition from low-cost regions: Producers in other geographies—particularly those with favorable gas economics—can affect pricing and utilization, especially during weaker demand conditions.
  • Trade policy and logistics disruption: Antidumping/countervailing duties, export restrictions, and freight constraints can shift regional demand and delivered pricing.

📊 Valuation & Market View

Fertilizer and nitrogen producers are typically valued through earnings power relative to the cost curve, often expressed via EV/EBITDA or similar multiples that reflect cycle normalization. Key valuation drivers include:

  • Natural gas and product spread expectations: The market frequently focuses on margin sustainability under plausible feedstock-cost scenarios.
  • Utilization and operating leverage: Utilization rate and cost discipline drive how quickly earnings respond to commodity pricing swings.
  • Balance sheet and cash generation capacity: Capital intensity makes liquidity and debt management important for weathering commodity cycles.
  • Regulatory capex outlook: The path of compliance-related spending can alter long-run free cash flow.

Given the commodity-like nature of pricing, the most durable “valuation support” typically comes from a demonstrably lower all-in cost position and reliable logistics that protect delivered economics.

🔍 Investment Takeaway

CF INDUSTRIES is best viewed as a low-cost North American nitrogen and logistics platform positioned to benefit from global nitrogen demand and periodic supply constraints. The core moat is structural—feedstock-driven unit economics combined with export/distribution infrastructure that improves delivered competitiveness. Investment attractiveness hinges on maintaining operational discipline and sustaining cost advantage while managing regulatory and energy-price volatility.


⚠ AI-generated — informational only. Validate using filings before investing.

📰 Market News & Coverage

15 Stories Available

Real-time institutional reporting and market updates for CF.

zacks.com2026-06-05

Why Is CF (CF) Down 1% Since Last Earnings Report?

CF (CF) reported earnings 30 days ago. What's next for the stock?

zacks.com2026-06-04

Is CF Stock a Screaming Buy After a 50% Rally in 6 Months?

CF has surged nearly 50% in six months as strong nitrogen demand and higher prices fuel earnings growth.

zacks.com2026-06-03

Are Investors Undervaluing CF Industries (CF) Right Now?

Here at Zacks, our focus is on the proven Zacks Rank system, which emphasizes earnings estimates and estimate revisions to find great stocks. Nevertheless, we are always paying attention to the latest value, growth, and momentum trends to underscore strong picks.

zacks.com2026-06-02

Can CF Industries' Strong Cash Flow Drive More Growth and Returns?

CF's robust cash flows, backed by strong operations and nitrogen market tailwinds, are powering growth investments and shareholder returns.

zacks.com2026-05-29

Is CF Industries (CF) Outperforming Other Basic Materials Stocks This Year?

Here is how CF Industries (CF) and Dow Inc. (DOW) have performed compared to their sector so far this year.

zacks.com2026-05-29

What Makes CF Industries Stock a Solid Investment Option Now?

CF presents a compelling investment case backed by favorable nitrogen demand fundamentals, rising earnings estimates and an attractive valuation.

fool.com2026-05-27

ISCV Beat IJJ Over the Past Year. Here's Why That Gap Could Easily Reverse.

Compare expense ratios, diversification, and risk profiles as these two value-focused ETFs take distinct approaches to portfolio construction.

seekingalpha.com2026-05-22

CF Industries: The Fertilizer Rally Is Far From Over

CF Industries benefits from a structurally tight nitrogen fertilizer market, driven by geopolitical disruptions and limited new capacity until 2030. CF's North American asset base and low-cost position provide a competitive advantage as global supply remains constrained, supporting elevated pricing. With natural gas feedstock costs down 11% y/y and robust production, Q2 is poised for strong results, with EPS projected at $5.83 versus street at $5.61.

zacks.com2026-05-22

CF Stock Up 28% in 3 Months: Can it Keep Rallying on Strong Demand?

CF Industries rides strong nitrogen demand, higher prices and robust cash flow, fueling investor optimism.

zacks.com2026-05-19

CF Industries (CF) is a Great Momentum Stock: Should You Buy?

Does CF Industries (CF) have what it takes to be a top stock pick for momentum investors? Let's find out.

zacks.com2026-05-15

Bull of the Day: CF Industries (CF)

As a global fertilizer shortage looms and the Strait of Hormuz faces an unprecedented blockade, one North American giant is stepping in to fill the void.

zacks.com2026-05-14

Volatility to Turn Higher as Inflation Resurfaces: Stocks to Watch

Inflation is the biggest risk in this environment amid the Strait of Hormuz blockade, which continues to pressure global energy prices.

zacks.com2026-05-13

Can CF (CF) Run Higher on Rising Earnings Estimates?

CF Industries (CF) shares have started gaining and might continue moving higher in the near term, as indicated by solid earnings estimate revisions.

seekingalpha.com2026-05-13

CF Industries Holdings, Inc. (CF) Presents at 21st Annual Global Farm to Market Conference Transcript

CF Industries Holdings, Inc. (CF) Presents at 21st Annual Global Farm to Market Conference Transcript

zacks.com2026-05-12

Here's Why CF Industries (CF) is a Strong Momentum Stock

The Zacks Style Scores offers investors a way to easily find top-rated stocks based on their investing style. Here's why you should take advantage.

📊 AI Financial Analysis

Powered by StockMarketInfo
Earnings Data: Q Ending 2026-03-31

"CF delivered a strong 2026-03-31 quarter with Revenue of $1.99B and Net Income of $615M (EPS $3.99). YoY, Revenue rose from $1.66B to $1.99B (+19.3%), while Net Income increased from $351M to $615M (+75.3%)—outpacing sales growth and signaling improved profitability. QoQ, Revenue was up from $1.87B (+6.1%), and Net Income surged from $404M (+52.2%), indicating a sharp sequential earnings acceleration. Margins improved over the past year: Net margin expanded from 18.8% (2025-03-31) to 31.0% (2026-03-31). Gross margin declined sequentially (41.1% in 2025-12-31 to 37.6% in 2026-03-31), but the step-up in below-the-line income (income before tax $844M) helped drive a much higher net margin. Cash flow remained solid: Operating cash flow was $496M and Free Cash Flow $273M, with dividends paid of $78M and modest share repurchases ($28M). Balance sheet resilience looks better than the latest prior quarter: Total assets increased to $14.61B and total stockholders’ equity rose meaningfully to $11.17B, while net debt improved to $1.58B from $1.97B. Shareholder returns were strong given price momentum (1y_change +52.1%) and a modest dividend yield (~0.39%), supporting a high total-return profile despite the payout being relatively small."

Revenue Growth

Strong

Revenue increased YoY to $1.99B (+19.3% vs. 2025-03-31) and was up QoQ to $1.99B (+6.1% vs. 2025-12-31), with a generally constructive quarterly trajectory.

Profitability

Strong

Net Income jumped YoY to $615M (+75.3%) and QoQ to $615M (+52.2%). Net margin expanded from 18.8% (2025-03-31) to 31.0% (2026-03-31). Sequentially, gross margin contracted, but earnings still accelerated, implying improved overall cost/other income dynamics.

Cash Flow Quality

Positive

OCF was $496M and FCF $273M in the latest quarter. Dividends were $78M and buybacks were comparatively modest (-$28M repurchases). Cash generation looks adequate to support distributions, though FCF is not the strongest versus net income.

Leverage & Balance Sheet

Good

Total assets rose to $14.61B and stockholders’ equity increased to $11.17B from $7.78B in the prior quarter. Net debt improved to $1.58B from $1.97B, suggesting improving balance-sheet resilience.

Shareholder Returns

Strong

Strong price momentum with 1-year price change of +52.1%. Dividend yield is ~0.39%, so total returns appear driven primarily by capital appreciation; buybacks provided limited additional support in the quarter.

Analyst Sentiment & Valuation

Neutral

Valuation multiples are not provided directly for the latest quarter’s price, but the given price/earnings is ~8.14 with price-to-sales ~10.1. With strong momentum (+52% 1y), upside may be partially priced-in; consensus target is $108.89 vs. current price $112.68 (slightly below current), tempering the score.

Disclaimer:This analysis is AI-generated for informational purposes only. Accuracy is not guaranteed and this does not constitute financial advice.

Fundamentals Overview

Loading fundamentals overview...

CF Industries reported strong Q1 2026 cash-generation with adjusted EBITDA of $983 million and ~$3.98 diluted EPS, supported by a ~$170 million Orica/Nelson Brothers litigation gain. Operationally, the company ran nearly 100% available ammonia capacity and maintained recordable incident rate of 0.16, while adding incremental spring urea tons through targeted turnaround delay and rail/logistics reallocation. Management’s core message is that geopolitical shocks (Iran/Strait of Hormuz closure plus Russia-Ukraine disruptions and export nationalism) have transformed nitrogen risk economics, keeping markets tight through 2026 and into 2027. They expect higher-than-normal pricing into Q3/Q4, longer tails from damaged assets and disrupted vessel positioning, and demand-driven import needs particularly for India. Blue Point’s economics were framed as structurally improved by longer U.S. energy differentials and low-risk North American network advantages. Key risks remain prolonged restart timelines, higher risk premiums/insurance, and the possibility of partial policy-driven supply/price moderation later in 2026.

AI IconGrowth Catalysts

  • Blue Point ammonia plant expected to commence in 2026 after permits and add over 1.5 million tons of gross ammonia capacity when operational late 2029
  • Low-carbon/upgraded products premium uptake: low-carbon ammonia and upgraded products brought on in Donaldsonville; Blue Point expected 95%+ decarbonized
  • Incremental spring 2026 supply via operational flexibility (delayed turnaround and repurposed rail assets) to increase tons available during tight global nitrogen conditions

Business Development

  • Blue Point joint venture and Blue Point common infrastructure build at the site (named only as Blue Point JV/common infrastructure in remarks)
  • Partnership/contracting uptake with low-carbon industrial customers: Pepsi referenced as an example of industrial CPG decarbonization demand (and POET mentioned)
  • Commercial relationships with retailers, wholesalers, cooperatives for North American spring application base (no specific names beyond Pepsi/POET/ADM)

AI IconFinancial Highlights

  • Adjusted EBITDA: $983 million (reported results posted 2026 yesterday afternoon)
  • Net earnings attributable to common: ~$615 million, or $3.98 diluted EPS (litigation settlement gain included)
  • Litigation: ~$170 million gain from previously disclosed settlement with Orica and Nelson Brothers recorded in Q1; proceeds received in April (cash impact reflected next quarter)
  • Trailing twelve-month net cash from operations: ~$2.7 billion; trailing free cash flow: ~$1.65 billion
  • Capital efficiency: continued conversion of EBITDA to free cash flow at industry-leading margins (no explicit bps margin deltas provided)

AI IconCapital Funding

  • Share repurchase: ~150 thousand shares for ~$15 million in Q1
  • Remaining authorization: $1.7 billion open and intended to be executed before authorization expires
  • 2026 consolidated capex projection: ~$1.3 billion total; CF portion ~$950 million (includes ~$550 million sustaining and ~$400 million for Blue Point JV/common infrastructure)
  • No net debt/cash runway amounts explicitly quantified beyond operating cash flow and capex

AI IconStrategy & Ops

  • Safety: trailing twelve-month recordable incident rate ended quarter at 0.16 incidents per 200,000 hours worked
  • Ammonia availability: running available ammonia capacity at nearly 100%
  • Spring supply management: temporarily delayed a turnaround at Donaldsonville to produce ~100k additional tons of urea; repurposed Yazoo City rail assets to move urea from Donaldsonville to the Corn Belt; shipped ammonia from Medicine Hat, Canada, into the U.S. distribution network
  • Maintenance re-prioritization: one maintenance shift after safety review—late May to late June at a single site—small shift to enable additional ~100k tons of urea for the application season
  • Product switching flexibility: ability to shift production using an 8–10 hour shift between urea and UAN based on economic value; strategy not reversed mechanically—expected to adjust as urea values exceed UAN opportunities

AI IconMarket Outlook

  • Global nitrogen markets expected to remain tight through 2026 and into 2027; further structural tightening through end of decade
  • 2026 supply shock expectation: conflict with Iran implies a longer tail even if Strait reopens; vessel movement normal 30–40 days plus additional time for repairs/restart
  • 2027 pricing expectation: 2027 ahead of average pricing expected over last several years (qualitative); Q3 and Q4 prices higher than normal
  • India demand estimate: urea import requirements potentially 10–12 million metric tons in 2026 (potentially +10% to +30% vs 2025; nearly double 2024)
  • China export timing estimate: expect exports to come in 2026 from ~June through October at ~1 million+ tons per month (per analogy to last year)
  • Fill timing expectation: summer fill expected to be a Q3 event

AI IconRisks & Headwinds

  • Geopolitical disruptions: conflict with Iran and Strait of Hormuz closure severely tightened global nitrogen market; Russia-Ukraine war continues disrupting Russian production; widespread export restrictions
  • Inability to quickly restore damaged nitrogen/feedstock/upstream capacity and longer vessel re-positioning leading to persistent supply constraints
  • Higher-cost tail: inflation, risk premiums, and vessel insurance expected to rise with longer-lasting cost increases
  • Export/offtake restrictions: China (restricted exports), Egypt imposed a $90/metric ton duty on nitrogen fertilizer exports, and Russia implemented export restrictions
  • Operational restart risk: if facilities are shut down, equipment and inventory dynamics imply months-long impacts; estimated plant impacts include 31 ammonia plants in Middle East directly impacted/shut, 49 plants in India/Pakistan/Bangladesh curtailed due to constrained feedstock, and 20–21 plants impacted in Russia by drone activity
  • Potential price normalization risk acknowledged but not quantified: global market expects some price moderation in back half; company cannot estimate that price today

Q&A: Analyst Interest

  • Q3/Q4 pricing and sequential tightness: Management said Q3 and Q4 should be higher than normal, citing trade-flow disruption and long-term vessel and restart bottlenecks. They quantified a potential export-traded market shortfall of ~5 million tons conservatively without aggressive China restocking and higher freight/demurrage risk.
  • Blue Point economics and export opportunity under higher U.S. energy arbitrage: Management stated longer natural gas differentials increase Blue Point’s return profile and that investment decisions remain disciplined/conservative. They described value as broader than gas—transport and operating efficiency too—plus the ability to move product for exports and to the Midwest when needed.
  • Supply restoration timelines and magnitude of plant shutdown impacts: Management split restart into equipment re-upping (1–3 months if preserved) versus inventory/vessel constraints that can extend to months. They provided a scale estimate: 31 Middle East ammonia plants directly impacted/shut; 49 India/Pakistan/Bangladesh curtailed; and 20–21 Russian plants impacted by drone activity.

Sentiment: CAUTIOUS

Note: This summary was synthesized by AI from the CF Q1 2026 earnings transcript. Financial data is complex; please verify all metrics against official SEC filings before making investment decisions.

📋 Official Regulatory 10-K / 10-Q SEC Filings

Direct authenticated documentation links to audited SEC database reports for CF.

SEC EDGAR Live Feed
Loading financial data and tables...
📁

SEC Filings (CF)

© 2026 Stock Market Info — CF Industries Holdings, Inc. (CF) Financial Profile