Carpenter Technology Corporation

Carpenter Technology Corporation (CRS) Market Cap

Carpenter Technology Corporation has a market capitalization of $24.03B.

Price: $483.60

-9.02 (-1.83%)

Market Cap: 24.03B

NYSE · time unavailable

CEO: Tony R. Thene

Sector: Industrials

Industry: Manufacturing - Metal Fabrication

IPO Date: 1987-11-05

Website: https://www.carpentertechnology.com

Carpenter Technology Corporation (CRS) - Company Information

Market Cap: 24.03B|Sector: Industrials

Company Profile

Carpenter Technology Corporation engages in the manufacture, fabrication, and distribution of specialty metals in the United States, Europe, the Asia Pacific, Mexico, Canada, and internationally. It operates in two segments, Specialty Alloys Operations and Performance Engineered Products. The company offers specialty alloys, including titanium alloys, powder metals, stainless steels, alloy steels, and tool steels, as well as additives, and metal powders and parts. It serves aerospace, defense, medical, transportation, energy, industrial, and consumer markets. The company was founded in 1889 and is headquartered in Philadelphia, Pennsylvania.

Analyst Sentiment

81%
Strong Buy

From 9 Active Polls

1Y Forecast: $465.80

▼ -3.7% Potential Upside

Consensus Target Metrics

Low Bound

$425

Median

$459

High Bound

$500

Average

$466

Price & Moving Averages

Loading chart...

🎯 Wall Street Analyst Intelligence Report

1-Year structural target targets, chart projections, and sentiment maps.

Average 1Y Target
$465.80
▼ -3.68% Upside
Low Target
$425.00
-12% Risk
Median Target
$459.00
-5% Mid
High Target
$500.00
3% Max
Consensus
Buy
14 / 21 Buys

Consensus Trend Projection

Trailing closures vs. 12-month metrics map.

Analyst Vote Distribution

Aggregate institutional coverage sentiment weights.

📊 Historical Valuation Multiples

Real-time Trailing Twelve Month (TTM) momentum side-by-side with discrete quarterly metrics.

Fiscal QuarterTTMQ1 2026Q4 2025Q3 2025Q2 2025Q1 2025Q4 2024Q3 2024Q2 2024
Period EndingTrailing 12MMar 31, 2026Dec 31, 2025Sep 30, 2025Jun 30, 2025Mar 31, 2025Dec 31, 2024Sep 30, 2024Jun 30, 2024
Market Cap ($M)24,02819,70815,77312,30213,8479,0958,5197,9955,349
Enterprise Value ($M)24,43220,11216,24012,79814,2699,6469,0608,5475,891
Price to Earnings Ratio (P/E)50.4735.2937.4525.1130.9923.8325.3323.5714.29
Price/Earnings-to-Growth Ratio (PEG)3.087.883.220.86
Price to Sales Ratio (P/S)7.9324.2921.6716.7718.3312.5112.5911.146.70
Price to Book Ratio (P/B)11.699.537.946.447.345.104.964.823.28
Price to Free Cash Flow Ratio (P/FCF)58.98157.91183.63-3618.1069.20266.72220.71601.1237.72
Enterprise Value to Sales (EV/Sales)24.7822.3117.4418.8813.2713.3811.917.38
Enterprise Value to EBITDA (EV/EBITDA)31.2790.4392.1266.5574.9455.6358.2656.5340.94
Debt to Equity Ratio0.520.340.350.370.390.390.410.420.46

CRS Growth Runway Model

Standard long term linear growth fade

Multi-Stage Discounted Cash Flow Sandbox

Market Price$483.60
Intrinsic Value$361.21
Market Alignment
Overvalued by 25.3%relative to calculated intrinsic value
9.00%
Exp: 1%1%
i

Growth runway slowdown

This value provides a time window for the growth rate to decline beyond Stage 1 toward the terminal rate. Longer windows are most useful for companies with high growth starting conditions or strong competitive advantages. This option stretches out the growth rate slowdown across 5, 10, or 15-year steps. A high-growth starting condition (exceeding a 25% initial growth rate) automatically applies a curve decay to simulate realistic, rapid market saturation.
i

Terminal growth rate

With long-term inflation between 3-5%, revenue must grow by that baseline to maintain flat real-world market share. This value sets the permanent terminal growth rate to factor into the valuation beyond the growth slowdown runway toward maturity.

3-Stage Financial Runway Horizon

🧠 Perpetuity Horizon Engine (Stage 3: Post-2035)

Terminal FCF Base$1.02B
Perpetuity TV Value$19.29B
Discounted TV (PV)$8.15B
TV Weighting %58.1%
⚠️
Financial Model Disclaimer & Risk Disclosure: This interactive scenario simulator is an educational sandbox provided strictly for informational and analytical research purposes. Core historical financial statements and consensus estimates are sourced directly via Financial Modeling Prep (FMP). All downstream outputs are entirely deterministic, hypothetical projections generated by combining automated mathematical formulas (including linear interpolation and Gaussian bell-curve decay models) with user-selected variables and third-party financial data inputs. Users assume all liability for trading decisions executed based on these sandbox calculations.

📘 Full Research Report

ℹ️

AI-Generated Research: This report is for informational purposes only.

📘 CARPENTER TECHNOLOGY CORP (CRS) — Investment Overview

🧩 Business Model Overview

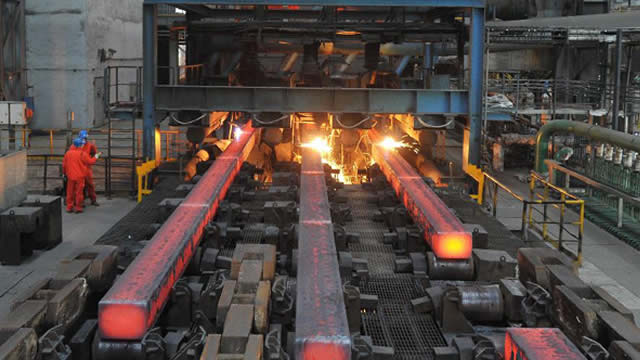
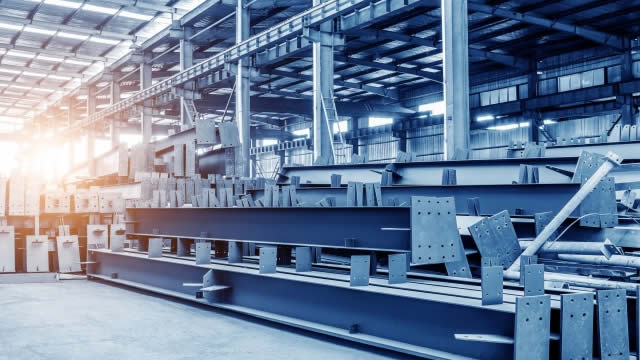
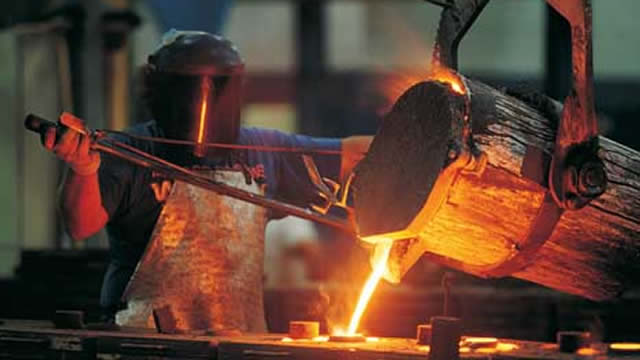
Carpenter Technology produces and supplies specialty alloy materials used in demanding applications where performance, reliability, and qualification matter. The business typically captures value across the melt/refining-to-finish value chain: custom alloy chemistry development, steel/metal processing, and transformation into customer-specified product forms. Customer engagement is often specification-driven (grade, composition, microstructure, mechanical properties), which translates into qualification work, repeat ordering, and long-running supply relationships with manufacturers in aerospace/defense, industrial markets, and select energy-related equipment.

The economic logic is straightforward: customers pay for engineered material performance and supply assurance, not for generic commodity metallurgy. Carpenter’s differentiation is reinforced when applications require tight tolerances, consistent heat-treatment outcomes, and documented traceability through procurement and manufacturing.

💰 Revenue Streams & Monetisation Model

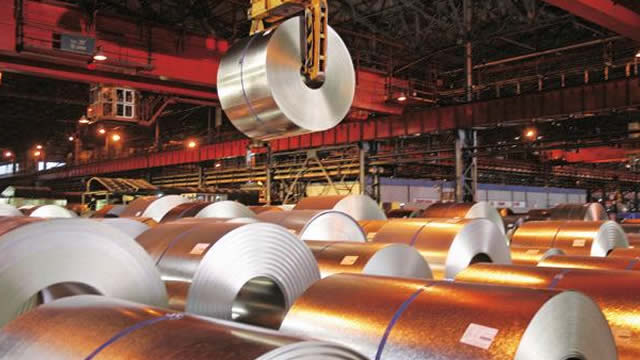
Revenue is primarily transactional, generated from selling specialty alloy products into end markets. Monetisation is driven by a combination of:

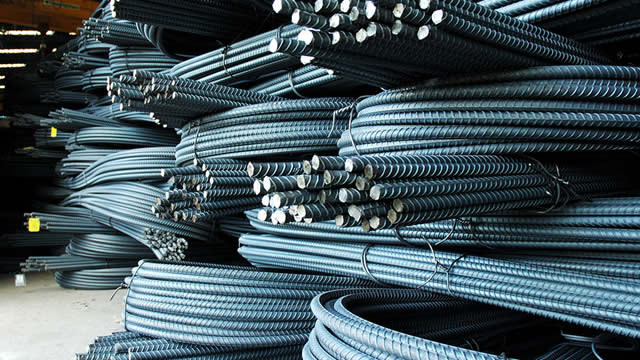
  • Price realization and premium product mix: Specialty grades and higher-performance alloys tend to carry premiums versus base commodity equivalents.
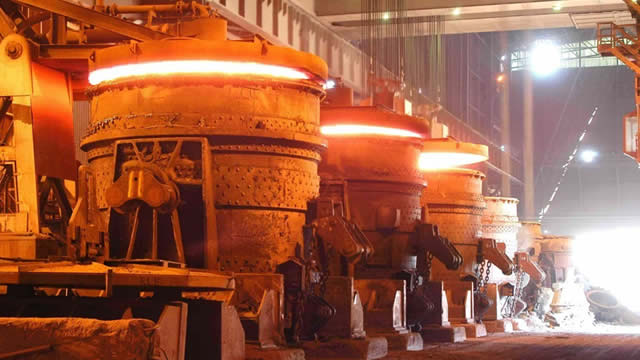
  • Manufacturing/processing economics: Conversion yield, heat-treatment efficiency, and scrap control affect gross margin in a way that is often more important than headline volume.
  • Order flow and contract structure: Some customers operate with longer qualification and procurement cycles, supporting repeat demand even when end-markets fluctuate.

While the revenue base is not “recurring” in the software sense, stickiness can be meaningful because re-qualification is costly and schedule-sensitive in regulated and performance-critical supply chains.

🧠 Competitive Advantages & Market Positioning

Carpenter’s moat is primarily rooted in switching costs and intangible capability—earned through metallurgical expertise, quality systems, and customer qualification history.

  • Switching Costs (Hard to Replace Specifications): Specialty alloys are selected through qualification and specification controls. Changing suppliers can require re-testing, re-certification, and process adjustments for downstream manufacturers.
  • Process/Materials Know-How (Intangible Asset): Proprietary or customer-aligned alloy design, processing parameters, and consistent outcomes across batches create an advantage that is difficult to replicate without time, data, and experience.
  • Customer Qualification and Traceability: Documented performance and compliance requirements (especially in aerospace/defense and industrial critical applications) act as structural barriers to entry.

Competitive benchmarking:

  • Allegheny Technologies (ATI): ATI is a major producer of titanium, nickel-based superalloys, and other specialty materials. ATI’s portfolio is broad across advanced materials; Carpenter’s positioning emphasizes custom alloy solutions and value-added metallurgy across engineered material needs.
  • Howmet Aerospace: Howmet focuses more heavily on engineered components (e.g., castings and forgings) for aerospace and industrial gas turbine segments. Carpenter competes by supplying upstream materials that enable these performance pathways, rather than primarily component manufacturing.
  • Outokumpu / Schmolz+Bickenbach (specialty and stainless competitors): These firms are more directly associated with stainless and specialty steel production. Carpenter differentiates by focusing on performance-critical engineered alloys and qualification-driven supply relationships, where composition/microstructure outcomes drive customer selection.

Overall, the competitive landscape includes both materials-focused and component-focused players. Carpenter’s defensibility is strongest where performance qualification and supply reliability dominate over pure scale.

🚀 Multi-Year Growth Drivers

Over a 5–10 year horizon, growth is likely to be supported by structural demand for high-performance materials and improved performance-per-weight in end markets:

  • Aerospace and defense performance requirements: Demand for components and systems that operate under higher stress, temperature, and reliability expectations supports long-cycle specialty alloy procurement.
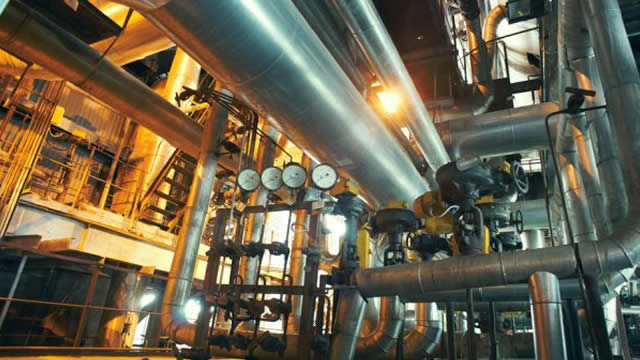
  • Industrial gas turbines and energy equipment modernization: Higher-efficiency designs typically require advanced materials that can sustain demanding thermal and mechanical conditions.
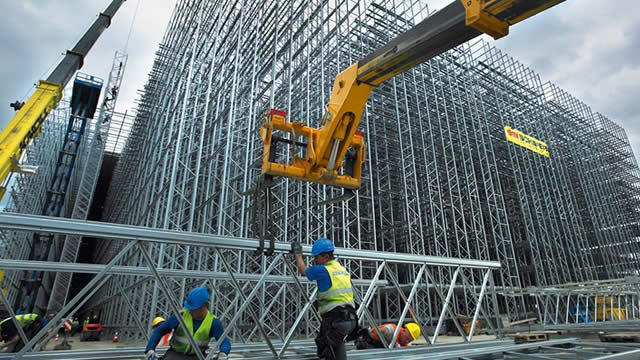
  • Electrification and grid hardening (indirect): Increased infrastructure investment can drive demand for industrial equipment where specialty alloys and pressure/heat-resistant components are used.
  • Additive manufacturing and high-value powder materials (select exposure): Where product qualification and material performance dominate, engineered powders and specialty feedstocks can benefit from expanding qualified use-cases.
  • Share gains in specification-driven niches: Specialty procurement tends to reward companies that can deliver consistent metallurgy, fast technical support, and reliable quality documentation.

TAM expansion is less about “volume at any cost” and more about penetrating application-specific requirements where performance attributes and qualification are decisive.

⚠ Risk Factors to Monitor

  • Cyclicality and customer capex cycles: End-market demand for aerospace/industrial equipment can swing with production plans and industrial spending.
  • Raw material and energy input volatility: Specialty metallurgy is sensitive to input costs; margin resilience depends on the ability to pass through costs and manage conversion yield.
  • Execution in capacity utilization: Specialty producers can experience margin pressure when fixed costs are spread across lower production volumes.
  • Qualification and customer adoption risk: Winning and maintaining qualified supplier status can be slow; application changes can take time to translate into order momentum.
  • Technological substitution risk: New process pathways (including advanced manufacturing methods) may reduce some usage patterns in certain applications, even if performance needs sustain demand for advanced materials.
  • Regulatory and ESG constraints: Emissions and supply-chain requirements can raise costs for metallurgical production and logistics.

📊 Valuation & Market View

Investors generally value specialty materials businesses based on earnings power through the cycle, with attention to:

  • EV/EBITDA and normalized margins: The market often discounts the volatility embedded in utilization and pricing.
  • Price/mix versus input costs: Sustainable gross margin improvement tends to rely on premium mix and disciplined conversion economics rather than temporary pricing.
  • Working capital intensity: Inventory and receivables dynamics matter in materials production; cash conversion can affect equity returns materially.
  • Quality of demand: Specification-driven customer relationships can support higher durability than commodity-linked peers, even within cyclical end markets.

A favorable valuation setup typically occurs when the market anticipates durable margin structure and improved utilization, not merely short-term pricing.

🔍 Investment Takeaway

Carpenter Technology’s long-term investment case is anchored in structural switching costs and intangible metallurgical capability—earned through customer qualification, consistent performance delivery, and engineered material know-how. The business monetises premiums through specification-driven procurement rather than commodity volume competition. While end markets remain cyclical and inputs can pressure margins, Carpenter’s defensibility is strongest where performance requirements and qualification create meaningful barriers to substitution.


⚠ AI-generated — informational only. Validate using filings before investing.

📰 Market News & Coverage

15 Stories Available

Real-time institutional reporting and market updates for CRS.

zacks.com2026-06-04

Carpenter Technology (CRS) Is Up 8.03% in One Week: What You Should Know

Does Carpenter Technology (CRS) have what it takes to be a top stock pick for momentum investors? Let's find out.

zacks.com2026-06-03

Carpenter (CRS) Upgraded to Buy: Here's Why

Carpenter (CRS) has been upgraded to a Zacks Rank #2 (Buy), reflecting growing optimism about the company's earnings prospects. This might drive the stock higher in the near term.

fool.com2026-06-03

ARKX vs. XAR: Two ETFs Worthy of Consideration

One fund leans into disruptive tech, while the other sticks to industry stalwarts-cost, volatility, and sector focus set them apart for investors.

fxempire.com2026-06-03

Carpenter Technology Gains on Record Earnings, Profits

Institutional inflows push Carpenter Technology Corporation (CRS) shares up 1,894% since 2005.

fool.com2026-05-29

Which Is the Better Aerospace and Defense ETF, Invesco's PPA or State Street's XAR?

One ETF captured higher recent returns, while the other showed greater resilience in downturns. See how their portfolios and costs stack up for investors.

invezz.com2026-05-29

Before SpaceX IPO, smart investors are buying these 3 stocks

SpaceX is expected to make its Nasdaq debut on June 12 in what could become the largest initial public offering in history. The company is targeting a valuation of about $1.75 trillion, with the proposed ticker SPCX and an unusually large retail allocation.

zacks.com2026-05-28

Here's Why Carpenter Technology (CRS) is a Strong Momentum Stock

Wondering how to pick strong, market-beating stocks for your investment portfolio? Look no further than the Zacks Style Scores.

zacks.com2026-05-22

Is Carpenter Technology (CRS) Stock Outpacing Its Basic Materials Peers This Year?

Here is how Carpenter Technology (CRS) and Lithium Americas Corp. (LAC) have performed compared to their sector so far this year.

gurufocus.com2026-05-21

Carpenter Technology Corp (CRS) Shares Surge 3.9% -- What GF Score of 74 Tells Investors

On May 21, 2026, Carpenter Technology Corp (CRS) shares rose 3.9% today, bringing the current price to $438.32. The stock has seen a 52-week range between $219.

barrons.com2026-05-21

Carpenter Technology: This Stock Will Melt Up

Earnings momentum, pricing power, and barriers to entry can help the alloy manufacturer's stock advance 42% from here.

zacks.com2026-05-20

Carpenter Technology (CRS) is a Top-Ranked Growth Stock: Should You Buy?

Whether you're a value, growth, or momentum investor, finding strong stocks becomes easier with the Zacks Style Scores, a top feature of the Zacks Premium research service.

businesswire.com2026-05-18

Aspera Biomedicines Successfully Launches Second ADAR1p150 Crystallization Experiment to the International Space Station Aboard SpaceX CRS-34

SAN DIEGO--(BUSINESS WIRE)--Aspera Biomedicines launches second ADAR1p150 crystallization experiment to the ISS aboard SpaceX CRS-34, advancing oral Rebecsinib for 20+ cancers.

seekingalpha.com2026-05-14

Allspring SMID Cap Growth Fund Q1 2026: Who Moved The Needle

The Allspring SMID Cap Growth Fund underperformed the Russell 2500 Growth Index benchmark during the first quarter that ended March 31, 2026. Carpenter Technology is benefiting from increased production rates at Boeing and recent regulatory approvals that are driving demand for mission-critical materials and components. As one of only a few contractors capable of building large-scale power plants, Argan benefits from pricing power and strong demand across both gas-fired and renewable projects tied to grid modernization.

seekingalpha.com2026-05-10

Carpenter: Waiting For A Dip

Carpenter Technology has delivered exceptional YTD and multi-year returns, driven by strong margin expansion and aerospace & defense demand. CRS guides for FY2024 operating income of $700–$705 million (+33% y/y) and $350 million in adjusted FCF, with continued growth expected into 2027. Despite robust fundamentals and margin gains, CRS trades at a low FCF yield (~1.6%), making shares unattractive for new entrants at current valuations.

zacks.com2026-05-07

Top 3D Printing Stocks With Solid Potential for Long-Term Growth

3D Printing is reshaping industries with faster production and lower costs, drawing investor interest. Stocks like NVDA, AME, CRS and ATI offer strong growth potential.

📊 AI Financial Analysis

Powered by StockMarketInfo
Earnings Data: Q Ending 2026-03-31

"CRS reported Q3’26 revenue of $811.5M and net income of $139.6M, with EPS of $2.79. YoY, revenue rose from $727.0M to $811.5M (+11.6%) and net income increased from $95.4M to $139.6M (+46.3%). QoQ, revenue grew from $728.0M to $811.5M (+11.5%) and net income rose from $105.3M to $139.6M (+32.7%). Profitability improved across the quarter: gross margin expanded to 31.0% (from 30.0% QoQ and 27.6% YoY), and net margin climbed to 17.2% (up from 14.5% QoQ and 13.1% YoY). The company also strengthened operating margin to 23.0%. Cash flow quality looks solid. Operating cash flow was $193.5M in the quarter (up from $132.2M QoQ and $74.2M YoY), producing free cash flow of $124.8M. Liquidity improved as cash grew to $294.8M, while total assets rose to $3.68B. Leverage remains manageable: total debt was $690.4M, and net debt declined to $395.6M from $466.8M QoQ. Shareholder returns are strong. The stock is up 158.9% over the last 1 year, far exceeding a 20% momentum threshold. Dividends were small (yield ~0.05%); buybacks continue (repurchased ~$52.7M in the quarter), supporting total return alongside price appreciation."

Revenue Growth

Strong

QoQ revenue +11.5% ($728.0M to $811.5M) and YoY +11.6% ($727.0M to $811.5M), showing consistent acceleration.

Profitability

Excellent

Margins expanded meaningfully: gross margin to 31.0% (vs 30.0% QoQ and 27.6% YoY) and net margin to 17.2% (vs 14.5% QoQ and 13.1% YoY). Net income grew faster than revenue (YoY +46.3%).

Cash Flow Quality

Strong

Operating cash flow $193.5M (QoQ +46.4%, YoY +160.0%); free cash flow $124.8M. Dividends are modest (~$10.1M/quarter) and easily covered by FCF.

Leverage & Balance Sheet

Good

Assets rose to $3.68B with equity increasing to $2.07B. Net debt improved to $395.6M from $466.8M QoQ; debt levels appear stable with strong interest coverage (~21x).

Shareholder Returns

Excellent

Total return signal is very strong: 1y price change +158.9% (well above 20%). Buybacks continue (repurchases in the quarter), while dividend yield remains minimal.

Analyst Sentiment & Valuation

Positive

Price is $445.69 vs consensus target ~$414 (implies modestly above-average expectations). Valuation multiples are elevated (e.g., P/E ~35x), but recent earnings acceleration supports sentiment.

Disclaimer:This analysis is AI-generated for informational purposes only. Accuracy is not guaranteed and this does not constitute financial advice.

Fundamentals Overview

Loading fundamentals overview...

Carpenter Technology delivered another record quarter in Q3 FY26, with diluted EPS of $2.77 and operating income of $186.5M (+20% sequentially; +35% YoY). The key driver was SAO profitability: adjusted operating margin expanded to 35.6%, up 250 bps QoQ (33.1% to 35.6%) and 650 bps YoY (29.1% to 35.6%), supported by productivity, mix, and pricing. Sales excluding surcharge grew 10% YoY on 15% higher volume and rose 11% sequentially on 10% higher volume, led by aerospace structural and energy/IGT demand; medical bookings improved even though medical sales fell. Cash generation strengthened: $364.9M operating cash flow YTD (~2x prior year), adjusted free cash flow of $207.3M YTD, and an increased FY26 outlook of at least $350M. Balance-sheet flexibility remains strong (liquidity $793.8M; net debt-to-EBITDA <1x), enabling buybacks ($133.9M repurchased in FY26). Management expects SAO Q4 operating income of $224M–$228M and sees lead times pushing out further near term amid supply-chain urgency.

AI IconGrowth Catalysts

  • Accelerating aerospace build rates driving higher demand for aerospace structural materials (including structural order intake increase).
  • Productivity gains and product mix optimization driving SAO margin expansion and higher earnings/operating income.
  • Energy end-use strength: industrial gas turbine (IGT) demand linked to data center growth supporting higher volumes (noting quarter-to-quarter fluctuation due to production scheduling).
  • Medical end-use bookings up significantly despite sequential and YoY sales decline (indicating early-stage recovery trajectory).

Business Development

  • Boeing: cited as ramping production (42 737s/month now; poised to 47/month this summer and 52+ thereafter) with supply-chain urgency/expedites.
  • Airbus: referenced as ramping production alongside Boeing (no named LTA partner cited).
  • OEM supply-chain: customers requesting urgent deliveries to avoid line shutdowns; engine programs asking for material sooner (no additional customer names disclosed).

AI IconFinancial Highlights

  • Total operating income: $186.5M in Q3 FY26, +20% vs Q2 and +35% vs Q3 FY25.
  • Operating income (SAO segment): $208M; SAO adjusted operating margin 35.6% vs 33.1% in prior quarter and 29.1% a year ago (bps change: +250 bps QoQ and +650 bps YoY).
  • SAO adjusted operating margin expansion: 17th consecutive quarter of margin expansion.
  • Total sales excluding raw material surcharge: +10% YoY and +11% sequentially.
  • Volume: +15% higher vs Q3 FY25 and +10% higher sequentially.
  • Gross profit: $251.8M, +25% YoY and +15% sequentially.
  • Effective tax rate: 21% in quarter (lower than anticipated) due to discrete tax benefits tied to estimate changes for prior-year tax positions; Q4 FY26 expected tax rate ~23% excluding discrete items.
  • Diluted EPS: $2.77.

AI IconCapital Funding

  • Adjusted free cash flow (YTD): $207.3M in FY26; raised outlook to at least $350M adjusted free cash flow for FY26.
  • Cash from operating activities (YTD): $364.9M (~2x vs same period prior year).
  • Capital spending: $157.6M spent YTD in FY26 (includes $125M annual targeted capex plus brownfield capacity expansion); Q3 capex $68.7M.
  • Full-year capex expectation: ~$260M (below earlier expectation due to timing estimate changes; project remains on budget/on schedule).
  • Share repurchases: $133.9M spent in FY26 to date; total $235.8M vs $400M authorization announced July 2024.
  • Liquidity: $793.8M total at most recent quarter end (cash $294.8M; $499M available borrowings).
  • Net debt-to-EBITDA: below 1x (described as very strong).

AI IconStrategy & Ops

  • SAO productivity improvements across facilities and shifts; manufacturing uptime and production planning prioritizing highest-margin materials across flow paths.
  • Safety: total case incident rate (TCIR) of 1.3; ongoing standardized work and disciplined safety practices.
  • Brownfield capacity expansion: construction phase underway; key equipment deliveries begun; focus on smooth startup preparation.
  • Lead-time management: lead times remain fairly consistent QoQ but anticipated to push out further over next couple of quarters as capacity/order timing tightens.

AI IconMarket Outlook

  • SAO operating income guidance for Q4 FY26: $224M to $228M.
  • Q4 FY26 corporate cost: $25M to $26M.
  • Q4 FY26 effective tax rate: ~23% excluding discrete items.
  • FY26 adjusted free cash flow outlook: at least $350M (explicitly increased).
  • FY26 operating income guidance implication: management states updated guidance increased for FY26, implying at least +33% vs record FY25.
  • Fiscal 2027 guidance: management states current FY27 earnings target is outdated and will be updated on the next quarter’s call.

AI IconRisks & Headwinds

  • Medical end-use sales decline persists in certain titanium products tied to specific medical distribution customers; recovery expected via bookings improvement.
  • Lead times expected to push out in near term (potential constraint risk).
  • IGT material sales can fluctuate due to order timing and production scheduling (quarterly volatility risk).
  • OEM concern that order intake is not yet sufficient for desired ramp—drives expedite/urgency but also signals potential supply-chain timing mismatch.

Q&A: Analyst Interest

  • Lead times & capacity/tonnage growth: Management said lead times remain fairly consistent QoQ but anticipates they will push out over the next couple of quarters, and described pockets of structural submarket volume opportunity beyond current 24/7 execution.
  • Boeing build rate / structural supply-chain reaction threshold: Analyst asked whether Boeing’s ~47% production-inventory metric is required to drive supplier ordering. Management replied they already see a structural order jump, don’t think waiting for 47% is necessary, and emphasized Boeing exhausted inventory while awaiting 30–60 day follow-through.
  • Working-capital/cash-flow profile tied to demand ‘bow wave’: Analyst asked if accelerating orders eventually create working-capital builds. Management (Tim) said cash flow should be fairly consistent over time, with inventory as the biggest opportunity, and they do not plan to invest heavily in inventory merely to chase demand.

Sentiment: POSITIVE

Note: This summary was synthesized by AI from the CRS Q3 2026 earnings transcript. Financial data is complex; please verify all metrics against official SEC filings before making investment decisions.

📋 Official Regulatory 10-K / 10-Q SEC Filings

Direct authenticated documentation links to audited SEC database reports for CRS.

SEC EDGAR Live Feed
Loading financial data and tables...
📁

SEC Filings (CRS)

© 2026 Stock Market Info — Carpenter Technology Corporation (CRS) Financial Profile