Chevron Corporation

Chevron Corporation (CVX) Market Cap

Chevron Corporation has a market capitalization of โ€”.

No quote data available.

CEO: Michael K. Wirth

Sector: Energy

Industry: Oil & Gas Integrated

IPO Date: 1921-06-24

Website: https://www.chevron.com

Chevron Corporation (CVX) - Company Information

Market Cap: -|Sector: Energy

Company Profile

Chevron Corporation, through its subsidiaries, engages in integrated energy and chemicals operations worldwide. The company operates in two segments, Upstream and Downstream. The Upstream segment is involved in the exploration, development, production, and transportation of crude oil and natural gas; processing, liquefaction, transportation, and regasification associated with liquefied natural gas; transportation of crude oil through pipelines; and transportation, storage, and marketing of natural gas, as well as operates a gas-to-liquids plant. The Downstream segment engages in refining crude oil into petroleum products; marketing crude oil, refined products, and lubricants; manufacturing and marketing of renewable fuels; transporting crude oil and refined products by pipeline, marine vessel, motor equipment, and rail car; and manufacturing and marketing of commodity petrochemicals, plastics for industrial uses, and fuel and lubricant additives. It is also involved in the cash management and debt financing activities; insurance operations; real estate activities; and technology businesses. The company was formerly known as ChevronTexaco Corporation and changed its name to Chevron Corporation in 2005. Chevron Corporation was founded in 1879 and is based in San Ramon, California.

Analyst Sentiment

76%
Strong Buy

From 25 Active Polls

1Y Forecast: $200.13

โ–ฒ +0.0% Potential Upside

Consensus Target Metrics

Low Bound

$168

Median

$204

High Bound

$230

Average

$200

Price & Moving Averages

Loading chart...

๐ŸŽฏ Wall Street Analyst Intelligence Report

1-Year structural target targets, chart projections, and sentiment maps.

Average 1Y Target
$200.13
โ–ฒ +6.84% Upside
Low Target
$168.00
-10% Risk
Median Target
$204.00
9% Mid
High Target
$230.00
23% Max

Consensus Trend Projection

Trailing closures vs. 12-month metrics map.

Analyst Vote Distribution

Aggregate institutional coverage sentiment weights.

Sentiment volume allocation data unavailable.

Historical valuation matrix unavailable.

๐Ÿ“˜ Full Research Report

โ„น๏ธ

AI-Generated Research: This report is for informational purposes only.

๐Ÿ“˜ CHEVRON CORP (CVX) โ€” Investment Overview

๐Ÿงฉ Business Model Overview

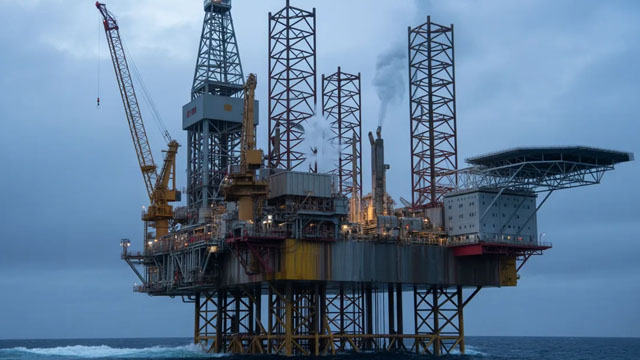
Chevron operates an integrated energy value chain spanning upstream production (finding and producing crude oil, natural gas, and natural gas liquids), midstream and logistics (moving and processing hydrocarbons via pipelines, terminals, and LNG-related infrastructure), and downstream refining and marketing (turning crude into transportation fuels and other refined products). The economic โ€œhow it worksโ€ is value capture across the chain: upstream provides feedstock; logistics and processing convert feedstock into saleable commodities; downstream and marketing monetize through refined product demand and product-specific margins. Net cash generation is driven by (i) production volumes and asset reliability, (ii) realized pricing versus benchmark curves, and (iii) cost discipline across operating and capital expenditures.

๐Ÿ’ฐ Revenue Streams & Monetisation Model

Chevronโ€™s monetisation is predominantly transactional rather than subscription-like. Revenue comes from the sale of:

  • Upstream volumes: crude oil, natural gas, and condensates (pricing linked to commodity benchmarks, with asset-specific differentials).
  • Natural gas liquids and refined feedstocks: monetised through downstream operations and/or third-party sales.
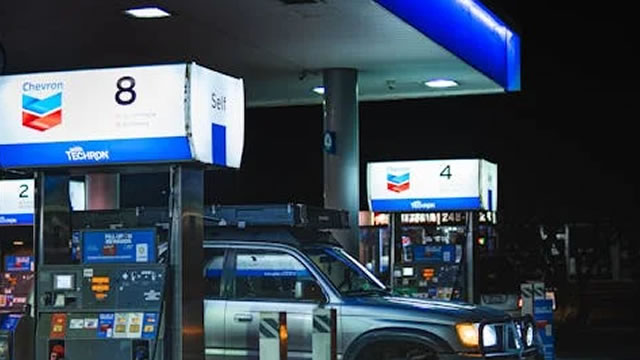
  • Downstream products: gasoline, diesel, jet fuel, and other refined products (margins linked to refining spreads and product demand).
  • Other energy-related activities: including marketing and specialty product streams tied to refined output.

Margin drivers are separable by segment. Upstream margins depend on lifting costs and realized differentials, while downstream profitability depends on throughput, refining utilization, product yield, and crack/refining spreads. Integration can smooth earnings variability: upstream feedstock can support downstream operations, and logistics can reduce basis/transport costs relative to less integrated peers.

๐Ÿง  Competitive Advantages & Market Positioning

Chevronโ€™s structural advantage is rooted in physical energy assets with long-lived supply, logistics, and operational know-how. Key moats include:

  • Geographic cost advantage (low-cost feedstock): value creation is supported by access to oil and gas development areas where production economics can be competitive across commodity cycles, reflecting resource quality, reservoir performance, and scale in operating footprints.
  • Logistical infrastructure moat: pipelines, terminals, shipping arrangements, and LNG-related capabilities reduce effective transportation and handling friction. These assets improve reliability of supply to customers and lower delivered-cost uncertainty.
  • Scale and execution capability: large, diversified project portfolios and mature operating systems improve the probability of meeting production targets and maintaining output through maintenance cycles.
  • Capital discipline as an economic barrier: sustained ability to fund multi-year projects, access long-lead services/equipment, and manage capital allocation creates a practical barrier to smaller entrants.

COMPETITIVE BENCHMARKING

  • Exxon Mobil: like Chevron, focuses on large integrated upstream exposure with substantial global operations. Competition centers on acreage quality and execution of long-cycle developments.
  • Shell: similarly integrated, with emphasis on LNG and global trading. Shell competes strongly on large-scale gas projects and downstream/refining breadth.
  • BP: also operates across upstream and downstream. BPโ€™s competitive posture can emphasize portfolio shaping and capital allocation strategy alongside operational efficiency.

Chevronโ€™s competitive differentiation versus these peers is anchored in the combination of low-cost feedstock access in key producing regions and the ability to monetize through owned/controlled logistics and downstream conversion capacity, improving delivered economics and reliability.

๐Ÿš€ Multi-Year Growth Drivers

Over a 5โ€“10 year horizon, growth is less about โ€œunit growthโ€ and more about managing the energy supply base through cycles:

  • Project pipeline and resource replacement: maintaining production requires disciplined reserve and development activity, with emphasis on sustaining long-lived output from high-quality assets.
  • Gas and LNG value chain progression: natural gas and LNG tend to benefit from contractual structures, infrastructure buildout, and customer demand from power generation and industrial use, supporting multi-year volume visibility where arrangements are secured.
  • Operational excellence: reliability, uptime, and cost optimization across upstream lifting and downstream throughput can compound through cycles.
  • Midstream/logistics optimization: leveraging existing infrastructure and debottlenecking opportunities improves the economic conversion of feedstock into monetizable products.
  • Demand substitution within hydrocarbons: while energy transition is ongoing, the pace and composition of demand across refined products and petrochemical feedstocks support continued utilization of legacy infrastructure and refined capacity.

The TAM is global and largely constrained by physical supply limitations: energy demand is served by long-cycle capital and physical infrastructure, which supports durable cash generation for operators with efficient assets and strong logistics.

โš  Risk Factors to Monitor

  • Commodity price and margin volatility: oil and refined product spreads fluctuate, impacting cash flow and the capacity to fund capital plans.
  • Regulatory and policy risk: carbon intensity standards, methane regulations, and tightening emissions requirements can raise compliance costs and affect project sanctioning.
  • Resource and execution risk: project delays, cost overruns, reservoir underperformance, and operational incidents can impair production replacement and returns.
  • Geopolitical and counterparty exposure: cross-border operations and supply arrangements can face sanctions, instability, and contract changes.
  • Stranded-asset and demand-shift risk: accelerated substitution away from oil products or constrained access to capital markets for high-emissions projects may compress long-term profitability.

๐Ÿ“Š Valuation & Market View

Equity valuation for integrated oil and gas companies typically anchors on cash-flow power and cycle-adjusted earnings rather than purely on balance-sheet book measures. Market frameworks commonly include:

  • EV/EBITDA or EV/FCF: driven by upstream margins, downstream crack spreads, and capital intensity.
  • Dividend and capital return capacity: supported by free cash flow generation and discipline in capital spending.
  • Quality of the asset base: reserve life, lifting cost competitiveness, and infrastructure monetisation potential.

Key variables that move valuation include expectations for (i) long-term commodity curve direction and volatility, (ii) the durability of margins given cost structure, (iii) execution success across the development pipeline, and (iv) the commitment to capital discipline and shareholder returns through the cycle.

๐Ÿ” Investment Takeaway

CRO: Chevronโ€™s long-term investment case is based on durable physical moats in low-cost feedstock access and logistics infrastructure that improve delivered economics and monetize production across the value chain. While earnings remain exposed to commodity cycles and energy-transition policy risk, the companyโ€™s scale, execution capability, and integrated asset network support resilient cash generation and the ability to fund multi-year projects with discipline.


โš  AI-generated โ€” informational only. Validate using filings before investing.

๐Ÿ“Š AI Financial Analysis

Powered by StockMarketInfo
Earnings Data: Q Ending 2026-03-31

"CVX reported Q1โ€™26 revenue of $47.6B and net income of $2.21B (EPS $1.12). QoQ, revenue fell from $45.8B in Q4โ€™25 to $47.6B in Q1โ€™26 (+4.0% QoQ), but net income declined from $2.77B to $2.21B (-20.3% QoQ). YoY, revenue rose from $46.1B in Q1โ€™25 to $47.6B (+3.2% YoY) while net income increased from $3.51B to $2.21B (-37.1% YoY), indicating weaker earnings despite modest top-line growth. Margins contracted materially over the last 4-quarter run: net margin declined from ~7.6% (Q1โ€™25) to ~4.6% (Q1โ€™26) and operating margin slipped to 6.8% from 9.3% in Q1โ€™25. Operating cash flow was $2.51B in the quarter, but free cash flow was negative (-$1.55B) due to capex of -$4.06B; this contrasts with positive FCF in several prior quarters (e.g., Q2โ€™25/Q3โ€™25/Q4โ€™25). Balance sheet resilience remains solid for a major integrated oil player: total assets were $329.6B and total equity $189.4B, with debt of $45.4B and net debt roughly flat versus prior quarters ($40.1B). Shareholder returns look supported: market performance shows strong momentum (1Y change +35.9%) alongside an indicated dividend yield ~0.86%. Total return should therefore remain positive, even though earnings/FCF weakened this quarter. Analyst valuation appears mixed: consensus target ~$194.9 is below the current price (~$184), implying limited upside versus a still-negative earnings trend."

Revenue Growth

Neutral

Revenue was $47.6B in Q1โ€™26, up +3.2% YoY and +4.0% QoQ, but the earnings decline suggests the incremental revenue did not translate into profit.

Profitability

Caution

Net income fell -37.1% YoY and -20.3% QoQ. Net margin compressed to 4.65% from 7.59% in Q1โ€™25, indicating contracting profitability over the period.

Cash Flow Quality

Caution

Operating cash flow was $2.51B, but free cash flow was -$1.55B due to higher capex (-$4.06B). Prior quarters often showed positive FCF, so cash generation weakened this quarter.

Leverage & Balance Sheet

Positive

Major bank-style metrics are not applicable, but as a large-cap energy producer CVX shows stability: total assets $329.6B and equity $189.4B remain strong; debt increased modestly with net debt ~ $40.1B.

Shareholder Returns

Good

Stock momentum is strong (+35.9% over 1Y, +21.3% over 6M). Dividend yield is ~0.86% per the provided ratios, supporting total return even with earnings softness.

Analyst Sentiment & Valuation

Neutral

Consensus target ~$194.9 is slightly above the current price (~$184), implying modest upside; valuation appears less compelling given sharply lower net income and negative quarterly FCF.

Disclaimer:This analysis is AI-generated for informational purposes only. Accuracy is not guaranteed and this does not constitute financial advice.

Fundamentals Overview

Loading fundamentals overview...

CVXโ€™s Q1 2026 results show solid underlying performance but with large, clearly signposted volatility-driven timing effects (~$3B) from inventory valuation and mark-to-market paper derivatives tied to physical cargoes. Management emphasized that these effects should unwind/normalize into Q2 (about $1B paper unwind, largely April deliveries) rather than represent structural earnings deterioration. Operational execution stayed strong: U.S. output rose (integration of legacy Hess) and LNG/refining ran at high rates, while the enterprise optimization approach increased equity crude routing, supporting margin capture in tight markets. Capital allocation remains disciplined: $2.5B buybacks in-line with guidance, full-year CapEx within guidance, and continued progress toward $3Bโ€“$4B structural cost reductions by year end; 2026 guidance was reiterated unchanged. Key uncertainties are geopolitical and Venezuela-related (fiscal clarity, dispute resolution, and receivables timing), while the company is not adjusting its framework so early in the conflict. Overall tone: mixed execution noise, strong portfolio discipline.

AI IconGrowth Catalysts

  • Integration-driven value capture: global enterprise optimization team keeping system utilization high and routing equity crude to capture volatility-driven margin opportunities
  • Second-quarter throughput ramp: global equity crude throughput expected to more than double y/y to 40% (Asia >80% refinery utilization), supporting margin capture and supply reliability in tight markets
  • Tamar/Leviathan expansion momentum: additional 600 MMcf/d of production (100% basis) expected to ramp this year; Leviathan longer-term expansion with FID in January; Aphrodite FEED underway
  • TCO operational recovery: returned to full service in March post-February electrical system repairs; near-full availability expected for remainder of 2026

Business Development

  • Venezuela asset swap with PDVSA: increased Chevron position in the Orinoco (Ayacucho 8), expanding contiguous acreage with PetroPR and adding operating/development synergies
  • Venezuela JV PetroIndependencia: increased equity stake to 49%; current operations running smoothly; management described ongoing debt-recovery mode
  • Microsoft exclusivity agreement for West Texas power projects: confirmed exclusive discussions; EPC selected; air permit submitted; turbines delivery starting in 2026; FID expected later in 2026 (subject to definitive agreements)

AI IconFinancial Highlights

  • Reported earnings: $2.2B or $1.11/share; adjusted earnings $2.8B or $1.41/share; includes $360M legal reserve charge; foreign currency reduced earnings by $223M
  • Adjusted earnings: $440M lower than Q4 2025; adjusted upstream increased on higher realizations, lower DD&A, and favorable OpEx and tax impacts; adjusted downstream decreased due to unfavorable timing effects, partly offset by higher refining margins
  • Timing effects were ~ $3B in Q1 2026, driven by steep March commodity price rise; evenly split between inventory valuation and mark-to-market accounting on paper derivatives tied to physical cargoes
  • Expect ~ $1B of paper derivative positions to unwind in Q2 2026 (majority of related cargoes delivered in April); additional timing effects expected if prices rise and further unwinds if prices fall
  • Cash flow: CFO excluding working capital $7.1B; adjusted free cash flow $4.1B; includes $1B loan repayment from TCO; working capital impacted by sharp commodity price increases and inventory build

AI IconCapital Funding

  • Share repurchases: $2.5B in Q1, in line with guidance
  • Commercial paper issued: >$5B to manage liquidity; about half paid down in April; further decline expected through Q2
  • Organic CapEx: $3.9B; inorganic CapEx: ~ $200M; company expects to finish within full-year capital guidance

AI IconStrategy & Ops

  • Downstream/optimization operations: enterprise optimization team focusing on maximizing value across upstream and downstream; high utilization maintained through volatility
  • Asia equity crude routing: expectations to run >40% equity crude in 2Q (north of 50% and higher at some U.S. refineries), materially above historical average (about 15% equity crude historically)
  • Refining and logistics: U.S. used Jones Act waiver to move crudes Gulf Coast to West Coast; Asia ran CPC Blend, Mars, and WTI in GS Caltex refinery in South Korea
  • Production and reliability: near-minimum rates in the Partitioned Zone for storage management; Tamar and Leviathan operating at full capacity; offshore expansion scope completed for Tamar optimization and Leviathan third gathering line

AI IconMarket Outlook

  • 2026 guidance unchanged; capital spending and production outlook consistent with prior guidance
  • 2026 structural cost reduction: on track to deliver $3B to $4B by year end
  • Second-quarter expected mix/throughput: global equity crude throughput to more than double y/y to 40%; Asia refinery utilization expected to exceed 80%
  • 2030 targets reiterated (shared Nov 9): over 10% growth in adjusted free cash flow and EPS and 3% improvement in ROCE at $70 Brent

AI IconRisks & Headwinds

  • Timing/derivative volatility risk: steep commodity price movements create large mark-to-market and inventory valuation timing effects; reversals expected as prices change
  • Venezuela operating risk: management described continued debt-recovery mode, unclear fiscal terms and tax/royalty ranges, and dispute-resolution uncertainties
  • Geopolitical supply shock uncertainty: long-term energy system impacts not yet clear; management emphasized consistency and did not change capital allocation framework early in conflict
  • Localized operational disruptions risk: TCO had February electrical system repairs and early March Black Sea weather dynamics; ongoing need for reliability and availability to sustain throughput

Q&A: Analyst Interest

  • Timing effects and derivative unwind: Management explained Q1 timing effects (~$3B) split between inventory valuation and mark-to-market paper derivatives linked to physical cargoes. They guided ~$1B paper unwind in Q2, majority with April deliveries, and said more timing effects occur when prices rise, reversing when prices fall.
  • Equity crude integration and margin capture: Management described a global enterprise optimization team, higher equity-crude routing (>40% in Asia, north of 50% at some U.S. refineries), and use of crude flexibility (including Jones Act waiver and specific blends run at GS Caltex). They did not quantify value, but said it flows through earnings beyond Q2.
  • Venezuela capital intensity and receivables: Management said Venezuela remains in debt-recovery mode with recycling cash flow while fiscal terms are still unclear (tax/royalty ranges and dispute resolution not settled). For receivables, they cited ~$1.5B at year start, faster paydown in 2026, lower year-end balance, and near full payoff by 2027.

Sentiment: MIXED

Note: This summary was synthesized by AI from the CVX Q1 2026 earnings transcript. Financial data is complex; please verify all metrics against official SEC filings before making investment decisions.

Loading financial data and tables...
ยฉ 2026 Stock Market Info โ€” Chevron Corporation (CVX) Financial Profile