Harley-Davidson, Inc.

Harley-Davidson, Inc. (HOG) Market Cap

Harley-Davidson, Inc. has a market capitalization of $2.58B.

Price: $24.49

0.14 (0.57%)

Market Cap: 2.58B

NYSE · time unavailable

CEO: Arthur Francis Starrs

Sector: Consumer Cyclical

Industry: Auto - Recreational Vehicles

IPO Date: 1986-07-08

Website: https://www.harley-davidson.com

Harley-Davidson, Inc. (HOG) - Company Information

Market Cap: 2.58B|Sector: Consumer Cyclical

Company Profile

Harley-Davidson, Inc. manufactures and sells motorcycles. The company operates in two segments, Motorcycles and Related Products and Financial Services. The Motorcycles and Related Products segment designs, manufactures, and sells Harley-Davidson motorcycles, including cruiser, touring, standard, sportbike, and dual models, as well as motorcycle parts, accessories, apparel, and related services. This segment sells its products to retail customers through a network of independent dealers, as well as e-commerce channels in the United States, Canada, Latin America, Europe, the Middle East, Africa, and the Asia-Pacific. The Financial Services segment provides wholesale financing services, such as floorplan and open account financing of motorcycles, and parts and accessories; and retail financing services, including installment lending for the purchase of new and used Harley-Davidson motorcycles, as well as point-of-sale protection products comprising motorcycle insurance, extended service contracts, and motorcycle maintenance protection. This segment also licenses third-party financial institutions that issue credit cards bearing the Harley-Davidson brand. Harley-Davidson, Inc. was founded in 1903 and is based in Milwaukee, Wisconsin.

Analyst Sentiment

56%
Buy

From 16 Active Polls

1Y Forecast: $23.60

▼ -3.6% Potential Upside

Consensus Target Metrics

Low Bound

$15

Median

$25

High Bound

$28

Average

$24

Price & Moving Averages

Loading chart...

🎯 Wall Street Analyst Intelligence Report

1-Year structural target targets, chart projections, and sentiment maps.

Average 1Y Target
$23.60
▼ -3.63% Upside
Low Target
$15.00
-39% Risk
Median Target
$25.00
2% Mid
High Target
$28.00
14% Max
Consensus
Hold
8 / 35 Buys

Consensus Trend Projection

Trailing closures vs. 12-month metrics map.

Analyst Vote Distribution

Aggregate institutional coverage sentiment weights.

📊 Historical Valuation Multiples

Real-time Trailing Twelve Month (TTM) momentum side-by-side with discrete quarterly metrics.

Fiscal QuarterTTMQ1 2026Q4 2025Q3 2025Q2 2025Q1 2025Q4 2024Q3 2024Q2 2024
Period EndingTrailing 12MMar 31, 2026Dec 31, 2025Sep 30, 2025Jun 30, 2025Mar 31, 2025Dec 31, 2024Sep 30, 2024Jun 30, 2024
Market Cap ($M)2,5782,2252,3423,3652,8963,1303,8045,0124,316
Enterprise Value ($M)2,9732,6202,3046,7538,2208,5479,24110,6189,981
Price to Earnings Ratio (P/E)11.6922.45-2.102.236.735.88-8.1410.534.94
Price/Earnings-to-Growth Ratio (PEG)0.160.870.06
Price to Sales Ratio (P/S)0.601.904.722.512.222.355.534.362.67
Price to Book Ratio (P/B)0.880.730.750.940.870.981.201.461.26
Price to Free Cash Flow Ratio (P/FCF)58.77-8.5623.32-26.068.7128.0549.3816.689.99
Enterprise Value to Sales (EV/Sales)2.234.645.046.296.4313.449.236.17
Enterprise Value to EBITDA (EV/EBITDA)6.4929.11-6.9212.9146.1037.58-76.0659.0432.13
Debt to Equity Ratio0.860.720.971.462.082.312.222.292.19

HOG Growth Runway Model

Standard long term linear growth fade

Multi-Stage Discounted Cash Flow Sandbox

Market Price$24.49
Intrinsic Value$13.43
Market Alignment
Overvalued by 45.2%relative to calculated intrinsic value
9.00%
Exp: -4%-4%
i

Growth runway slowdown

This value provides a time window for the growth rate to decline beyond Stage 1 toward the terminal rate. Longer windows are most useful for companies with high growth starting conditions or strong competitive advantages. This option stretches out the growth rate slowdown across 5, 10, or 15-year steps. A high-growth starting condition (exceeding a 25% initial growth rate) automatically applies a curve decay to simulate realistic, rapid market saturation.
i

Terminal growth rate

With long-term inflation between 3-5%, revenue must grow by that baseline to maintain flat real-world market share. This value sets the permanent terminal growth rate to factor into the valuation beyond the growth slowdown runway toward maturity.

3-Stage Financial Runway Horizon

🧠 Perpetuity Horizon Engine (Stage 3: Post-2035)

Terminal FCF Base$0.12B
Perpetuity TV Value$2.19B
Discounted TV (PV)$0.93B
TV Weighting %63.6%
⚠️
Financial Model Disclaimer & Risk Disclosure: This interactive scenario simulator is an educational sandbox provided strictly for informational and analytical research purposes. Core historical financial statements and consensus estimates are sourced directly via Financial Modeling Prep (FMP). All downstream outputs are entirely deterministic, hypothetical projections generated by combining automated mathematical formulas (including linear interpolation and Gaussian bell-curve decay models) with user-selected variables and third-party financial data inputs. Users assume all liability for trading decisions executed based on these sandbox calculations.

📘 Full Research Report

ℹ️

AI-Generated Research: This report is for informational purposes only.

📘 HARLEY DAVIDSON INC (HOG) — Investment Overview

🧩 Business Model Overview

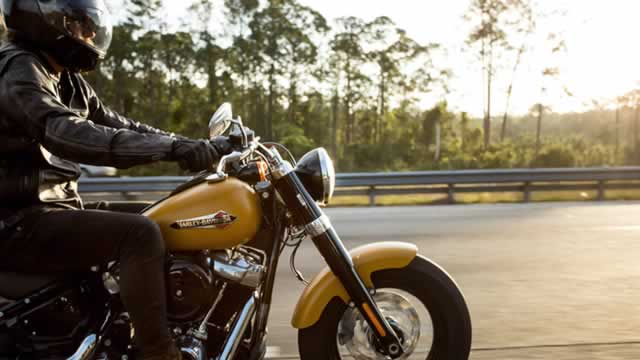
Harley-Davidson operates a branded “vehicle + lifecycle” model. It designs and manufactures motorcycles and sells them through a dealer network, then monetizes the installed base over time through high-margin aftermarket activities—parts, accessories, and branded apparel—alongside service and extended-cycle demand drivers created by ownership (repairs, customization, and replacement cycles). Dealer relationships and financing programs support unit sales, while the aftermarket converts a large portion of demand into less cyclical, repeatable revenue tied to the size and longevity of the owner base.

💰 Revenue Streams & Monetisation Model

The monetisation model blends:

  • Transactional vehicle revenue from the sale of motorcycles (more cyclical, driven by consumer discretionary spending and inventory/dealer cycles).
  • Aftermarket revenue from parts, accessories, and apparel (generally supported by the installed base; often higher margin and more resilient than unit sales).
  • Service and related revenue through the dealer ecosystem, supporting continued spend after purchase.
  • Financing/credit-related economics tied to dealer and customer financing programs (where structured, it can help smooth demand and improve conversion rates).

Margin drivers typically hinge on product mix (premium touring vs. lower-priced segments), aftermarket penetration per owner, and production efficiency. The aftermarket stream is the key stabilizer: it turns vehicle ownership into recurring monetisation of customization and maintenance needs.

🧠 Competitive Advantages & Market Positioning

Harley-Davidson’s primary moat is the combination of Intangible Brand Equity and Installed-Base Driven Switching Costs.

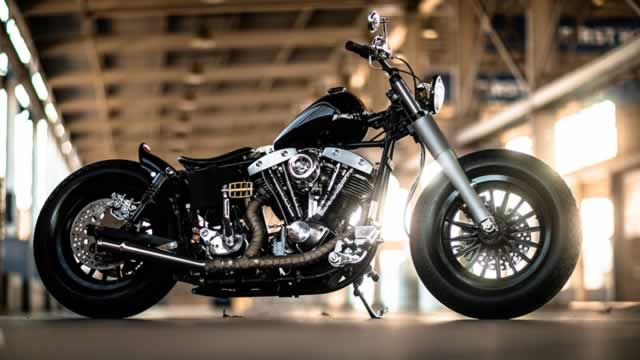
  • Switching Costs / Customization Lock-In: Motorcycle ownership builds a portfolio of compatible parts, accessories, and riding identity. Customization and dealer familiarity reduce friction to remain within the ecosystem over multiple purchase cycles.
  • Aftermarket Scale Advantage: A large installed base supports predictable demand for parts and accessories, strengthening merchandising and distribution economics.
  • Dealer Network Embeddedness: Dealer relationships and product training deepen distribution efficiency and influence local service capacity—critical for customer retention.

Competitive benchmarking (industry focus contrast):

  • Polaris / Indian Motorcycle: Competes strongly in the heavyweight cruiser space with a similar brand-led approach. Harley’s differentiation relies more heavily on long-cycle aftermarket monetisation and the breadth of its established ownership ecosystem.
  • Honda and Yamaha: Strong in broader motorcycle categories with greater emphasis on efficiency and model diversity. These rivals compete for share earlier in the purchase funnel (entry-to-mid segments), while Harley targets premium identity-driven segments and uses lifecycle monetisation to defend value.
  • BMW Motorrad: Competes at the premium end with engineering-led positioning and touring performance. Harley’s defense is less about technological parity and more about ownership culture, customization depth, and the installed-base aftermarket model.

🚀 Multi-Year Growth Drivers

Growth over a 5–10 year horizon is more likely to come from monetizing the installed base and expanding the premium ownership lifecycle than from purely unit-volume expansion. Key drivers include:

  • Aftermarket penetration: Higher attach rates for parts, accessories, and apparel supported by ongoing customization trends and expanding product assortment.
  • Premium mix and longevity: Touring and premium models typically improve dollar contribution per unit and extend lifecycle spending opportunities.
  • Dealer productivity and retail execution: Better inventory discipline, improved conversion of leads, and service capacity can raise effective demand capture without requiring market-wide unit growth.
  • Electrification transition within the brand ecosystem: The shift to electric two-wheel segments can create new ownership experiences. The value lies in translating existing brand community and distribution relationships into adoption, while managing cost and supply chain learning curves.
  • Geographic and segment expansion: Growth opportunities in markets where premium motorcycles and aftermarket support infrastructure can scale, subject to distribution build-out economics.

⚠ Risk Factors to Monitor

  • Demand cyclicality and dealer inventory risk: Motorcycle retail is sensitive to consumer credit conditions and discretionary spending; mismatches can pressure margins.
  • Regulatory and compliance costs: Emissions and safety standards can raise engineering and certification expenses and compress product roadmaps if not managed.
  • Competitive intensity: Faster model cycles, stronger incentives, and improved financing offers from rivals can limit pricing power.
  • Technology transition execution risk: Electrification requires supply chain readiness, cost-down trajectories, and credible product performance targets; missteps can affect brand credibility and margins.
  • Capital intensity of manufacturing footprint: Fixed cost absorption and labor/supply commitments can heighten operating leverage in downturns.

📊 Valuation & Market View

Motorcycle OEM equities typically trade off cyclical earnings power while the market assigns incremental value to aftermarket-like durability. Common valuation frameworks include:

  • EV/EBITDA and EV/Operating profit: Sensitive to cycle normalization, margin structure, and production efficiency.
  • P/S (price-to-sales): Useful when investors expect mix shift toward aftermarket and services; penalizes businesses where unit volume volatility dominates.
  • Quality of earnings: Aftermarket attachment rate, service growth, and the stability of dealer economics can raise the valuation multiple versus purely transactional peers.

Key “needle movers” usually include sustainable aftermarket contribution, normalized gross margin over the cycle, disciplined inventory management, and credible execution of product roadmap and cost structure.

🔍 Investment Takeaway

Harley-Davidson’s long-term investment case rests on the defensibility of its ownership ecosystem: intangible brand positioning supports a durable installed base, and that installed base generates a meaningful aftermarket and lifecycle revenue stream that can dampen motorcycle-cycle volatility. While the business remains exposed to unit-cycle fluctuations and regulatory/transition risks, the central question for investors is whether aftermarket monetisation and dealer-driven retention continue to offset manufacturing and competitive pressures over a multi-year horizon.


⚠ AI-generated — informational only. Validate using filings before investing.

📰 Market News & Coverage

15 Stories Available

Real-time institutional reporting and market updates for HOG.

foxbusiness.com2026-06-05

Harley-Davidson under fire from Robby Starbuck over alleged 'woke' leadership

Conservative activist Robby Starbuck warns Harley-Davidson's recent executive hires risk alienating American riders fed up with wokeness and DEI.

zacks.com2026-06-04

Harley-Davidson (HOG) Up 1.7% Since Last Earnings Report: Can It Continue?

Harley-Davidson (HOG) reported earnings 30 days ago. What's next for the stock?

nypost.com2026-06-03

Robby Starbuck renews Harley-Davidson boycott call over alleged ‘woke' leadership: ‘Leave and go to another brand'

“I regret to inform you unfortunately today I am going to have to expose them again,” Starbuck said in a new social media post from Wednesday.

prnewswire.com2026-06-02

Harley-Davidson, Inc. to Present at Baird 2026 Global Consumer, Technology & Services Conference

MILWAUKEE, June 2, 2026 /PRNewswire/ -- Harley-Davidson, Inc. (the "Company") (NYSE: HOG) announced today that it will present at Baird 2026 Global Consumer, Technology & Services Conference at the InterContinental New York Barclay in New York, New York on Wednesday, June 3, 2026. President and Chief Executive Officer Artie Starrs and Head of Investor Relations Shawn Collins will present in one-on-one and group sessions and answer questions about the Company.

prnewswire.com2026-05-21

Harley-Davidson, Inc. Declares Dividend

MILWAUKEE, May 21, 2026 /PRNewswire/ -- The Harley-Davidson, Inc. (NYSE: HOG) Board of Directors has approved a cash dividend of $0.1875 per share for the second quarter of 2026. The dividend is payable June 25, 2026 to the shareholders of record of the Company's common stock as of June 8, 2026.

marketbeat.com2026-05-10

Harley-Davidson Q1 Earnings Call Highlights

Harley-Davidson NYSE: HOG reported higher first-quarter retail motorcycle sales but sharply lower earnings as the company absorbed tariff costs, restructuring expenses and the effects of a new capital-light model at Harley-Davidson Financial Services.

fool.com2026-05-07

Is Harley-Davidson Stock a Buy After Robinson Value Initiated a New Position?

Harley-Davidson generates revenue from motorcycles, branded merchandise, and financial services for a global customer base.

seekingalpha.com2026-05-06

Harley-Davidson's Cultural Resurgence (Rating Upgrade)

Harley Davidson (HOG) is at a pivotal turnaround moment, with operational synergies and cultural resurgence driving a bullish long-term outlook. HOG's Q1 showed real demand growth, dealer network revitalization, and a shift toward a rider-first, culture-centric strategy to reclaim relevance and profitability. The equity is moderately undervalued, with a bull-case 2-year CAGR of 35–40% and a 12-month price target of $31.50, but downside risk remains significant.

seekingalpha.com2026-05-05

Harley-Davidson, Inc. (HOG) Q1 2026 Earnings Call Transcript

Harley-Davidson, Inc. (HOG) Q1 2026 Earnings Call Transcript

zacks.com2026-05-05

HOG Q1 Earnings Miss Estimates on Tariff-Pressured Margins

HOG Q1 EPS misses as tariffs and incentives squeeze HDMC margins, even with retail sales up and 2026 guidance reaffirmed.

zacks.com2026-05-05

Compared to Estimates, Harley-Davidson (HOG) Q1 Earnings: A Look at Key Metrics

While the top- and bottom-line numbers for Harley-Davidson (HOG) give a sense of how the business performed in the quarter ended March 2026, it could be worth looking at how some of its key metrics compare to Wall Street estimates and year-ago values.

barrons.com2026-05-05

Harley-Davidson Stock Pops on Solid Earnings. It Has a Turnaround Plan.

The motorcycle maker reported earnings per share of 22 cents from sales of $1.2 billion. Wall Street was looking for earnings per share of 22 cents from sales of $1 billion.

zacks.com2026-05-05

Harley-Davidson (HOG) Misses Q1 Earnings Estimates

Harley-Davidson (HOG) came out with quarterly earnings of $0.22 per share, missing the Zacks Consensus Estimate of $0.34 per share. This compares to earnings of $1.07 per share a year ago.

wsj.com2026-05-05

Harley-Davidson's New Boss Wants to Sell You a Bike You Can Actually Afford

The motorcycle company's new chief executive, Artie Starrs, hopes to increase sales with lower-priced bikes.

prnewswire.com2026-05-05

Harley-Davidson Announces "Back to the Bricks" Strategic Plan to Restore Performance and Deliver Profitable Growth

Strategy Leverages Harley-Davidson's Competitive Advantages to Restore Volumes and Build Platform for Value Creation; Targeting over $350 million of HDMC EBITDA in 2027 Conference Call at 8 a.m. CT to Present Strategy and Discuss First Quarter 2026 Financial Results; Presentation Available on Harley-Davidson's Investor Relations Website MILWAUKEE, May 5, 2026 /PRNewswire/ -- Harley-Davidson, Inc. ("Harley-Davidson" or the "Company") (NYSE: HOG) today announced "Back to the Bricks," its new strategic plan designed to restore the Company's performance and deliver profitable growth.

📊 AI Financial Analysis

Powered by StockMarketInfo
Earnings Data: Q Ending 2026-03-31

"HOG reported Q1 2026 Revenue of $1.17B and Net Income of $24.8M (EPS $0.23). YoY, revenue declined (Q1’26 vs Q1’25: -11.8%), and net income was down materially (Q1’26 vs Q1’25: -81.4%). QoQ, revenue surged (Q1’26 vs Q4’25: +136.6%), while net income improved from a loss (Q4’25 net income -$279.3M to Q1’26 +$24.8M). Margins were significantly lower than last year: gross margin fell to ~29.5% from ~35.3% in Q1’25, and net profit margin narrowed to ~2.1% from ~10.0%. Cash flow was weaker in Q1’26: operating cash flow was -$228.0M and free cash flow was -$259.8M, contrasting with Q4’25 where operating cash flow was positive (~$152.0M) and free cash flow positive (~$100.4M). On balance sheet resilience is still acceptable but deteriorated versus prior quarter: total assets fell to $7.25B (from $8.04B in Q4’25) and equity was broadly stable at ~$3.08B. Net debt moved to a higher level (about $0.40B vs net cash ~-$0.04B in Q4’25), reflecting the cash burn and debt repayment dynamics. Shareholder returns: shares were up modestly over 1 year (+7.5%)—below the >20% momentum threshold. Dividend yield is ~1.0%; buybacks were modest in the quarter (repurchase -$70.0M), so total return looks primarily price-driven rather than yield-led."

Revenue Growth

Caution

QoQ revenue jumped +136.6% (Q1’26 $1.17B vs Q4’25 $0.50B) but YoY revenue fell -11.8% (vs Q1’25 $1.33B), indicating a weaker underlying trend despite seasonal/Q4 rebound.

Profitability

Neutral

Net income swung to profit QoQ (Q4’25 -$279.3M to Q1’26 +$24.8M) but YoY fell -81.4%. Net margin contracted to ~2.1% from ~10.0% and gross margin to ~29.5% from ~35.3%.

Cash Flow Quality

Neutral

Operating cash flow was -$228.0M and free cash flow -$259.8M in Q1’26 versus Q4’25 positive operating cash flow (~$152.0M) and positive FCF (~$100.4M). Cash burn weakens near-term earnings quality.

Leverage & Balance Sheet

Neutral

Equity remains solid (~$3.08B) and current ratio improved to ~1.91 from ~2.10, but leverage worsened: net debt rose to ~$0.40B from net cash in Q4’25.

Shareholder Returns

Neutral

1-year price change +7.5% (no strong momentum). Dividend yield ~1.0% and buybacks continued (Q1 repurchases ~$70M), providing some support but not enough to offset earnings/cash volatility.

Analyst Sentiment & Valuation

Neutral

With price around $23.49 and consensus target $22, valuation implies limited upside vs target (slightly below consensus). High-level multiples (P/E ~22) reflect earnings volatility; sentiment appears neutral-to-mixed.

Disclaimer:This analysis is AI-generated for informational purposes only. Accuracy is not guaranteed and this does not constitute financial advice.

Fundamentals Overview

Loading fundamentals overview...

HOG’s Q1 2026 shows a business in reset mode: volumes and share improved, but profitability collapsed on tariffs and operational mix. North America retail new motorcycles rose 14% and Harley-Davidson gained +2pp to 38% share of the U.S. 601cc+ market, aided by Touring/Trike strength and the 2026 launch. Inventory was aggressively right-sized (global -22% YoY) with healthier current-model mix supporting future execution. Financially, consolidated operating income fell to $23M and EPS dropped to $0.22, reflecting HDMC margin compression of 380 bps to 25.3%. The tariff narrative is central: Q1 tariff costs were $45M, with full-year 2026 now guided $75M-$90M. HDFS earnings remain positive but revenue is down 54% after the capital-light model. Management also reaffirmed 2026 unit guidance and expects shipment cadence smoothing (Q2/Q4 up, Q3 flat) alongside $150M annual run-rate cost savings starting 2027+. Sentiment is mixed but improving optimism is attributed to retail and cost actions.

AI IconGrowth Catalysts

  • North America new motorcycle retail sales up 14% YoY (U.S. +16%, Canada -8%); strength driven by Touring and Trike models and new 2026 Motorcycle Launch
  • Global retail sales of new motorcycles up 8% YoY to ~34,000 units; early model-year 2026 product momentum in EMEA with quicker sell-through
  • Market share gain: Harley-Davidson reached 38% of the U.S. 601cc+ market, up 2 percentage points YoY
  • Rev Max platform outperformance led by adventure touring (EMEA), plus share movement from ~2% to ~4% of European market in Q1
  • Latin America retail up 21% YoY; Touring and Trike standout
  • Dealer inventory normalization: global inventory down 22% YoY; improving mix (North America ~2/3 current model year 2026 vs <1/2 prior year period)
  • HDFS credit originations up 14% YoY to $671M; LiveWire revenue +87% YoY tied to electric motorcycle and static brand electric balance bank units

Business Development

    AI IconFinancial Highlights

    • Consolidated revenue down 12% YoY, driven primarily by HDFS revenue down 54% due to capital-light model after HDFS transaction (sold retail loan book; forward flow to sell ~2/3 of future originations)
    • Consolidated operating income $23M vs $160M in Q1 2025; operating loss at LiveWire -$18M (in line with expectations; $2M favorable vs prior year)
    • EPS $0.22 vs $1.07 in Q1 2025
    • HDMC revenue down 2% to $1.1B; motorcycles $836M, C&A $200M, licensing/other $20M; drivers: lower volume/shipments, lower net pricing and incentive spend; partially offset by favorable FX
    • HDMC gross margin 25.3% vs 29.1% prior year (down 380 bps YoY)
    • HDMC operating income $19M vs $116M prior year; margin headwinds tied to $45M tariff cost in Q1, net pricing/incentive spend from sell-through of prior-model inventory, product mix/volume, and higher-than-expected supply management costs; partial offsets from tariff recovery settlement (prior years) and FX
    • HDMC operating expenses $248M, +$49M YoY: includes $15M restructuring (role elimination; termination benefits/other charges) and $34M higher costs (warranty spend from select product recalls, select people costs from executive changes, higher marketing spend as marketing development fund matures)
    • HDFS Q1 revenue $112M (-54% YoY); HDFS operating income $22M with operating margin 19.9%
    • HDFS annualized retail credit loss ratio on managed loans 3.6% vs 3.8% prior year period (improvement of 20 bps)
    • LiveWire revenue +87% YoY; consolidated operating loss improved 11% YoY; net cash used from operating activities improved by >25% YoY

    AI IconCapital Funding

    • Q1 buybacks: repurchased 6.6M shares for $128M in Q1 2026 (discretionary).
    • ASR recap: $200M ASR initiated in Q4 2025; $160M (80%) and 6.3M shares delivered by Dec 31, 2025; remaining shares delivered Feb 12-13 2026 (3.1M shares), value $64.7M during ASR performance; additional discretionary repurchases 3.5M shares for $63.3M in Q1 2026.
    • Total repurchased since Q2 2024 plan announcement: 26.8M shares for $726M value through early 2026; company concluded that program to align with refreshed capital allocation approach.
    • Cash and cash equivalents: $1.8B at Q1 2026 close vs $1.9B a year ago.
    • Operating cash flow: net cash use of $228M from operating activities in Q1 2026 vs $142M operating cash inflow prior year; declines driven by reduced HDMC wholesale shipments and HDFS timing effects (held-for-sale classification and originations for sale to strategic partners/outflows).

    AI IconStrategy & Ops

    • Dealer inventory rightsizing: global inventory down 22% YoY; Q1 inventory comprised more current model year units (North America ~2/3 current model year 2026 vs <1/2 prior year).
    • Wholesale shipment cadence: Q1 wholesale deliveries ~37,300 units vs 386,000 units in Q1 2025 (as stated; down 3% YoY per management framing); expected Q2 and Q4 shipments higher YoY, Q3 lower YoY to smooth cadence.
    • Tariff mitigation: management cited early April U.S. administration exemption on certain motorcycles and for parts/accessories used in manufacturing promoter cycles; emphasized U.S.-centered manufacturing footprint (3 of 4 manufacturing centers U.S.-based; 100% of U.S. core product manufactured in U.S.).
    • Cost actions: restructuring and inventory/cost initiatives; expects $150M annual run-rate cost savings impacting 2027+ vs 2025 levels.
    • Marketing platform rollout: early reception to new Ride marketing platform; positioned as a community and brand engagement lever.
    • LiveWire: focus on imminent launch of F4 Honcho products; network expansion cost savings and product innovation targeted for profitable cash flow.

    AI IconMarket Outlook

    • Company reaffirms 2026 guidance; increased optimism attributed to North America retail results and early cost reduction actions.
    • Full-year 2026 HDMC retail units expected: 130,000 to 135,000 (management label in transcript shows 'a' likely meaning retail units).
    • Full-year 2026 HDMC wholesale units expected: 130,000 to 135,000.
    • Shipment cadence expectation: higher in Q2, relatively flat in Q3, up again in Q4; production units expected lower than wholesale shipped due to prudent inventory management (deleverage impact on operating margin expected in 2026; alignment by next year).
    • Tariff outlook: cost of new/increased tariffs forecast $75M to $90M for full-year 2026 (updated from prior range $75M to $105M).
    • Full-year 2026 operating income expectations: HDMC positive $10M to loss of $40M; HDFS operating income $45M to $60M; LiveWire operating loss $70M to $80M.
    • HDFS credit outlook (managed loans): retail credit loss ratio guidance direction not explicitly provided beyond Q1 reported 3.6% vs 3.8%.

    AI IconRisks & Headwinds

    • Tariff cost pressure: Q1 cost of new/increased tariffs $45M; forecast full-year $75M to $90M vs 2025 new/increased tariffs cost of $67M (24 baseline referenced).
    • Margin compression: HDMC gross margin down 380 bps to 25.3% due to tariffs, pricing/incentives from prior-model sell-through, unfavorable product mix/volumes, and higher supply management costs.
    • Demand uncertainty: management cited uneven global consumer discretionary environment; customer sensitivity to pricing amid inflation, rates above recent historical lows, and geopolitical uncertainty.
    • Dealer-related: expectation to manage dealer inventory/wholesale cadence carefully; Q1 wholesale unit base and model year mix influence cash flows and earnings timing.
    • Operating leverage risk: 2026 production units expected lower than wholesale shipped, creating deleverage and operating margin pressure (alignment expected in 2027).
    • LiveWire: continued operating losses with 2026 operating loss range $70M-$80M.

    Q&A: Analyst Interest

      Sentiment: MIXED

      Note: This summary was synthesized by AI from the HOG Q1 2026 earnings transcript. Financial data is complex; please verify all metrics against official SEC filings before making investment decisions.

      📋 Official Regulatory 10-K / 10-Q SEC Filings

      Direct authenticated documentation links to audited SEC database reports for HOG.

      SEC EDGAR Live Feed
      Loading financial data and tables...
      📁

      SEC Filings (HOG)

      © 2026 Stock Market Info — Harley-Davidson, Inc. (HOG) Financial Profile