HP Inc.

HP Inc. (HPQ) Market Cap

HP Inc. has a market capitalization of $23.39B.

Price: $25.58

-0.72 (-2.74%)

Market Cap: 23.39B

NYSE · time unavailable

CEO: Bruce Dale Broussard

Sector: Technology

Industry: Computer Hardware

IPO Date: 1957-11-06

Website: https://www.hp.com

HP Inc. (HPQ) - Company Information

Market Cap: 23.39B|Sector: Technology

Company Profile

HP Inc. provides personal computing and other access devices, imaging and printing products, and related technologies, solutions, and services in the United States and internationally. The company operates through three segments: Personal Systems, Printing, and Corporate Investments. The Personal Systems segment offers commercial and consumer desktop and notebook personal computers, workstations, thin clients, commercial mobility devices, retail point-of-sale systems, displays and peripherals, software, support, and services. The Printing segment provides consumer and commercial printer hardware, supplies, solutions, and services. The Corporate Investments segment is involved in the HP Labs and business incubation, and investment projects. It serves individual consumers, small- and medium-sized businesses, and large enterprises, including customers in the government, health, and education sectors. The company was formerly known as Hewlett-Packard Company and changed its name to HP Inc. in October 2015. HP Inc. was founded in 1939 and is headquartered in Palo Alto, California.

Analyst Sentiment

25%
Underperform

From 18 Active Polls

1Y Forecast: $19.83

▼ -22.5% Potential Upside

Consensus Target Metrics

Low Bound

$19

Median

$20

High Bound

$22

Average

$20

Price & Moving Averages

Loading chart...

🎯 Wall Street Analyst Intelligence Report

1-Year structural target targets, chart projections, and sentiment maps.

Average 1Y Target
$19.83
▼ -22.48% Upside
Low Target
$19.00
-26% Risk
Median Target
$19.50
-24% Mid
High Target
$22.00
-14% Max
Consensus
Hold
16 / 52 Buys

Consensus Trend Projection

Trailing closures vs. 12-month metrics map.

Analyst Vote Distribution

Aggregate institutional coverage sentiment weights.

📊 Historical Valuation Multiples

Real-time Trailing Twelve Month (TTM) momentum side-by-side with discrete quarterly metrics.

Fiscal QuarterTTMQ2 2026Q1 2026Q4 2025Q3 2025Q2 2025Q1 2025Q4 2024Q3 2024
Period EndingTrailing 12MApr 30, 2026Jan 31, 2026Oct 31, 2025Jul 31, 2025Apr 30, 2025Jan 31, 2025Oct 31, 2024Jul 31, 2024
Market Cap ($M)23,39319,23318,00125,95423,48624,29230,81034,77435,332
Enterprise Value ($M)29,35625,19625,78533,14631,39033,51138,83342,43543,356
Price to Earnings Ratio (P/E)9.2410.688.268.167.7014.9613.639.6013.80
Price/Earnings-to-Growth Ratio (PEG)1.611.432.422.46
Price to Sales Ratio (P/S)0.411.331.251.771.691.842.282.472.61
Price to Book Ratio (P/B)-163.78-133.56-23.50-75.01-26.07-19.04-28.74-26.28-25.38
Price to Free Cash Flow Ratio (P/FCF)6.1925.44120.0118.1916.24-167.53427.9223.6628.00
Enterprise Value to Sales (EV/Sales)1.751.792.262.252.532.883.023.21
Enterprise Value to EBITDA (EV/EBITDA)7.4835.4926.5028.4029.2539.1037.2734.8736.62
Debt to Equity Ratio1.52-67.13-14.28-31.45-11.96-9.34-10.17-8.24-7.77

HPQ Growth Runway Model

Standard long term linear growth fade

Multi-Stage Discounted Cash Flow Sandbox

Market Price$25.58
Intrinsic Value$52.04
Market Alignment
Undervalued by 103.4%relative to calculated intrinsic value
9.00%
Exp: -3%-3%
i

Growth runway slowdown

This value provides a time window for the growth rate to decline beyond Stage 1 toward the terminal rate. Longer windows are most useful for companies with high growth starting conditions or strong competitive advantages. This option stretches out the growth rate slowdown across 5, 10, or 15-year steps. A high-growth starting condition (exceeding a 25% initial growth rate) automatically applies a curve decay to simulate realistic, rapid market saturation.
i

Terminal growth rate

With long-term inflation between 3-5%, revenue must grow by that baseline to maintain flat real-world market share. This value sets the permanent terminal growth rate to factor into the valuation beyond the growth slowdown runway toward maturity.

3-Stage Financial Runway Horizon

🧠 Perpetuity Horizon Engine (Stage 3: Post-2035)

Terminal FCF Base$3.44B
Perpetuity TV Value$64.77B
Discounted TV (PV)$27.36B
TV Weighting %55.4%
⚠️
Financial Model Disclaimer & Risk Disclosure: This interactive scenario simulator is an educational sandbox provided strictly for informational and analytical research purposes. Core historical financial statements and consensus estimates are sourced directly via Financial Modeling Prep (FMP). All downstream outputs are entirely deterministic, hypothetical projections generated by combining automated mathematical formulas (including linear interpolation and Gaussian bell-curve decay models) with user-selected variables and third-party financial data inputs. Users assume all liability for trading decisions executed based on these sandbox calculations.

📘 Full Research Report

ℹ️

AI-Generated Research: This report is for informational purposes only.

📘 HP INC (HPQ) — Investment Overview

🧩 Business Model Overview

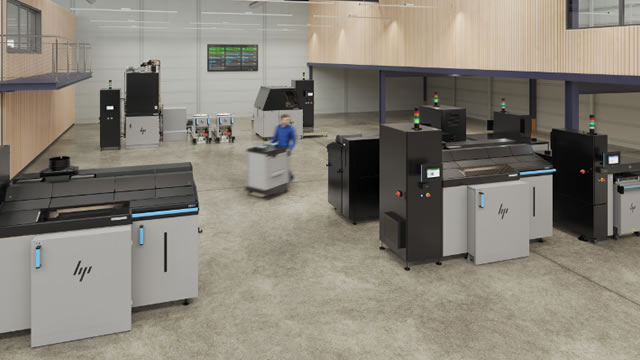
HP Inc. operates through two tightly linked segments: (1) client devices (primarily PCs and related accessories) and (2) imaging/printing solutions (printers plus consumables and related services). The economic engine is the installed base. Devices create a base of users that then generate repeat demand for printer supplies (toner/ink), accessories, and—where adopted—managed print workflows. In commercial environments, printer fleets and document processes tend to be standardized and administered centrally, which increases procurement and workflow stickiness.

💰 Revenue Streams & Monetisation Model

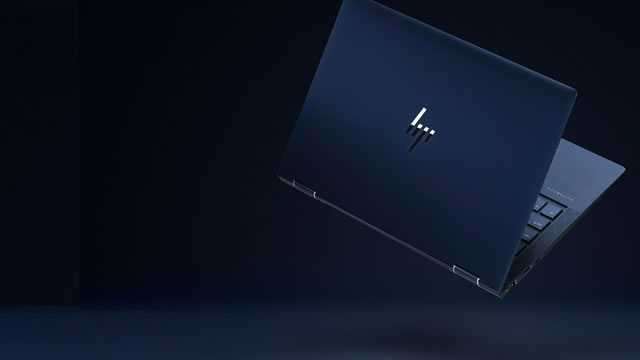
HP monetizes via a mix of one-time hardware sales and recurring usage-based economics:
  • Transactional revenue: PCs, printers, and accessories sold through OEM/channel partners and enterprise channels. Device margins are typically sensitive to component costs, competitive pricing, and mix (consumer vs. commercial).
  • Recurring/usage revenue: Supplies (toner/ink), imaging-related consumables, and certain services. Supplies tend to exhibit steadier demand because printers require periodic replenishment.
  • Service-like monetisation: Managed print services and document workflow offerings (where bundled/contracted) monetize per-page or fleet-level outcomes rather than only one-time equipment sales.
Margin drivers generally follow mix: stronger supplies mix and favorable channel pricing support gross margin, while device cycles influence utilization of fixed cost structures (R&D, manufacturing overhead, and logistics).

🧠 Competitive Advantages & Market Positioning

HP’s moat is best described as installed-base switching costs combined with scale cost advantages in hardware supply chains and (in commercial printing) process integration.
  • Switching costs (high in practice): Printer fleets become operationally “sticky” due to installed base, IT/admin integration, workflow standardization, and the purchasing and replenishment rhythm of supplies. Even when competitors offer comparable printers, switching can require requalification, IT changes, training, and procurement realignment.
  • Consumables economics: Supplies consumption creates ongoing monetisation tied to the installed base. This dynamic makes HP less dependent on each new hardware unit for long-run profitability.
  • Cost advantages (scale and procurement): HP’s manufacturing footprint and component sourcing scale support competitive unit economics, particularly in devices where performance differentiation is often incremental.
Competitive benchmarking (industry context):
  • PC competitors: Dell Technologies and Lenovo emphasize end-to-end PCs and infrastructure adjacencies. HP competes across client devices with similar channel reach, while seeking differentiation through commercial fleet optimization and imaging ecosystem benefits.
  • Printing competitors: Canon and Epson (and in some categories Brother) compete on printers and imaging systems. Canon/Epson tend to be more printing-first, while HP’s portfolio spans both PCs and imaging, allowing it to leverage shared enterprise relationships and channel access.
The key distinction: HP’s competitive posture blends a device franchise with an installed-base consumables model, whereas many rivals skew more heavily to either client devices (e.g., Dell/Lenovo) or imaging systems (e.g., Canon/Epson/Brother).

🚀 Multi-Year Growth Drivers

A durable thesis over a 5–10 year horizon rests on several structural drivers:
  • Commercial fleet refresh and security-driven upgrades: Enterprises continue to upgrade endpoints for security, manageability, and lifecycle compliance, supporting a replacement-driven PC market.
  • Digitization does not eliminate printing; it changes mix: Printing volumes can shift toward color, specific document types, and distributed printing models. The addressable opportunity expands around workflow solutions rather than only page volume.
  • Managed print workflows and per-page models: Contracted fleet management can stabilize demand for supplies and service-like revenues, especially in regulated or operationally complex environments.
  • Product mix and productivity features: Higher-value printer categories and configurations can improve average selling characteristics by targeting business-critical use cases (speed, reliability, manageability).

⚠ Risk Factors to Monitor

  • Hardware commoditization and pricing pressure: PCs and printers face rapid performance parity and competitive undercutting, which can compress device margins and reduce operating leverage.
  • Supply-dependent economics: Supplies profitability hinges on installed base health and competitive cartridge/ecosystem dynamics. Any erosion in usage economics can offset device volume gains.
  • Regulatory and right-to-repair/certification constraints: Cartridge and printing ecosystem regulations can affect monetisation models and compatibility practices, altering competitive dynamics.
  • Technological substitution: Continued movement toward digital document workflows can reduce certain print demand categories, requiring ongoing portfolio adaptation toward business-relevant outputs.
  • Supply chain and component volatility: Manufacturing and logistics costs can swing with component pricing, freight costs, and geopolitical disruptions.

📊 Valuation & Market View

Equity valuation for HPQ typically reflects a blend of:
  • Cyclical hardware cash flow: Investors often anchor on free-cash-flow durability through device cycles and working-capital discipline.
  • Supplies and imaging “quality premium”: Sustained supplies economics can justify a higher multiple than a pure hardware platform.
  • Operating leverage potential: Market sensitivity to gross margin stability, cost control, and mix (devices vs. imaging/supplies) is high.
Common analytical frames include EV/EBITDA for cash generative capacity and P/S when investor emphasis shifts to revenue resilience from the installed base. Drivers that usually move the needle are supplies mix, imaging profitability, sustainable device margins, and credible capital returns supported by cash generation.

🔍 Investment Takeaway

HP Inc. offers a pragmatic, installed-base-driven model in a hardware market that can be cyclical but is partially cushioned by recurring imaging economics. The investment case centers on switching costs from fleet standardization and consumables dependency, complemented by scale-driven cost advantages in device manufacturing. Returns depend on maintaining supplies profitability while navigating commoditization in PCs and printers, with managed print and workflow solutions serving as the bridge between transactional hardware and more resilient lifecycle revenue.


⚠ AI-generated — informational only. Validate using filings before investing.

📰 Market News & Coverage

15 Stories Available

Real-time institutional reporting and market updates for HPQ.

seekingalpha.com2026-06-05

Dividend Champion, Contender, And Challenger Highlights: Week Of June 7

A weekly summary of dividend activity for Dividend Champions, Contenders, and Challengers. Companies which changed their dividends. Companies with upcoming ex-dividend dates.

globenewswire.com2026-06-04

HP Shifts into a New Gear with Ferrari, Fueling PC Innovation with Shared Design and Engineering Vision

The HP Limited Edition Scuderia Ferrari AI PC celebrates iconic heritage and innovation The HP Limited Edition Scuderia Ferrari AI PC celebrates iconic heritage and innovation

investorplace.com2026-06-04

The SpaceX IPO Just Hit the Reality Wall (Plus, the Trades Behind It)

The SpaceX IPO just hit its valuation reality wall. Luke Lango breaks down which IPOs burst through, which die - and what it signals for AI, chips, and drones.

seekingalpha.com2026-06-02

HP Inc. (HPQ) Presents at 2026 Evercore Global TMT Conference Transcript

HP Inc. (HPQ) Presents at 2026 Evercore Global TMT Conference Transcript

zacks.com2026-06-02

Will Iran Peace Talks Hit a Roadblock? ETFs to Play

Iran peace talks face fresh risks as oil surged on Monday. ETFs tied to energy, commodities, income, the dollar and AI could help navigate volatility.

benzinga.com2026-06-02

HP Shares Are Picking Up Momentum— But Goldman Sachs Isn't Buying It

Shares of HP Inc. (NYSE:HPQ) were in focus on Monday following Nvidia Corp.'s (NASDAQ:NVDA) blockbuster unveiling of its RTX Spark Superchip at Computex 2026. The announcement pushed HPQ's week-on-week Benzinga Edge momentum score to an 82.28th percentile, capping off a massive 40.85% rally over the month.

techcrunch.com2026-06-01

Nvidia chases $200B CPU market with AI agent PCs from Microsoft, Dell, and HP

Nvidia opened Taipei's enormous Computex trade show on Sunday with a spark, literally. The chipmaker unveiled a new PC CPU called the RTX Spark, which it dubbed a “superchip,” and named a who's who list of PC makers that will soon deliver AI PCs powered by it.

schaeffersresearch.com2026-06-01

Stocks Mixed as Oil, Iran Tensions Overshadow Chip Rally

Stocks are trading mixed as surging oil prices and Iran updates overshadow an earlier chip stock rally

zacks.com2026-06-01

HP (HPQ) International Revenue in Focus: Trends and Expectations

Examine HP's (HPQ) international revenue patterns and their implications on Wall Street's forecasts and the prospective trajectory of the stock.

247wallst.com2026-06-01

Live Nasdaq Composite: Markets Open June With Caution as Oil Spikes and Nvidia Powers Tech Higher

Live Updates Act now: the analyst who called NVIDIA in 2010 just named his top 10 AI stocks - and CoreWeave, Inc. Class A Common Stock didn't make the cut. Grab the names FREE today. Diller's Deal 17 minutes ago Live Barry Diller is making a move to take MGM Resorts (NYSE: MGM) private, according to... Live Nasdaq Composite: Markets Open June With Caution as Oil Spikes and Nvidia Powers Tech Higher

investopedia.com2026-06-01

5 Things to Know Before the Stock Market Opens

Stocks futures are slightly higher to kick off the week as announcements from AI chipmaker Nvidia spark big moves in a number of tech sector shares; Nvidia stock gaining after CEO Jensen Huang delivered a keynote address at a conference in Taiwan; Huang unveiled a new line of AI agent-focused laptops Nvidia is building in partnership with a group of companies, news that sent IBM soaring and Intel sliding; Berkshire Hathaway is acquiring Taylor Morrison Home Corp. in the firm's first big acquisition under CEO Greg Abel; investors are preparing for a busy week of earnings reports and economic data. Here's what you need to know today.

businesswire.com2026-06-01

Hirect Advances Heavy Haul Capability with Successful Loaded Run of 6,000 HP Locomotive Propulsion System

OMAHA, Neb.--(BUSINESS WIRE)--Hirect, a premier global manufacturer of heavy-duty electrical and power electronic components for rolling stock, today announced the successful integration and first loaded test run of its 6,000 HP electric locomotive propulsion system. The entirely internally designed and manufactured system includes the traction inverter/converter controller and software, and interfaces with cab controls and displays. The new propulsion system, mounted in a WAG-9 locomotive, suc.

globenewswire.com2026-06-01

HP Debuts PCs Built for the Next Wave of Windows PC Experiences Powered by NVIDIA RTX Spark™

Unified portfolio delivers pre‑configured tools and secure local processing to accelerate AI workflows for creators, developers, and gamers Unified portfolio delivers pre‑configured tools and secure local processing to accelerate AI workflows for creators, developers, and gamers

cnbc.com2026-06-01

Nvidia jumps into PCs with new Arm-based chip debuting in laptops from Microsoft, Dell, HP

Nvidia, which has dominated the market for AI chips in data centers, is pushing into PCs with a new processor called N1X on a new RTX Spark superchip. The Arm-based chip will debut on laptop models from Microsoft, Dell, HP, ASUS, Lenovo and MSI.

investorplace.com2026-06-01

The Biggest Winner From Nvidia’s RTX Spark Announcement Isn’t Nvidia

Nvidia's RTX Spark just entered the PC market. The obvious trade is NVDA - but the cleanest win may already be collecting royalties.

📊 AI Financial Analysis

Powered by StockMarketInfo
Earnings Data: Q Ending 2026-04-30

"HPQ reported Q2 2026 revenue of $14.41B and net income of $0.45B (EPS $0.49). QoQ, revenue slipped slightly (-0.2%), while net income rose (+ (450M/545M -1) = -17.4%? actually down): net income declined from $545M in Q1 to $450M in Q2 (-17.4%). YoY, revenue grew from $13.22B in Q2 2025 to $14.41B (+9.0%), and net income increased from $406M to $450M (+10.8%). Profitability improved on a quarterly basis? Over the last four quarters, margins have been volatile but generally stronger into Q4 2025 before easing in Q2 2026: gross margin ticked up vs Q2 2025 (20.7% -> 20.9%), while net margin rose vs Q2 2025 (3.1% -> 3.1%) but contracted vs Q1 2026 (3.8% -> 3.1%). Operating income and income before tax declined QoQ, consistent with lower earnings conversion in the quarter. Cash flow remained positive: operating cash flow was $0.93B and free cash flow $0.76B in Q2 2026. The company continued shareholder distributions with dividends paid of $0.27B and buybacks of $0.10B (net cash used in financing $0.36B). Balance sheet liquidity strengthened (cash up to $3.70B from $3.15B QoQ) and equity increased to $3.87B from $3.41B QoQ, indicating improved resilience. Total shareholder return is mixed: the stock price is $19.88, down -15.3% over 1 year, which is a headwind for total return despite the dividend (yield ~1.4%). Revenue and Earnings-based metrics were applicable (not pre-revenue)."

Revenue Growth

Positive

YoY revenue increased +9.0% in Q2 2026 ($14.41B vs $13.22B). QoQ revenue was roughly flat (-0.2% vs Q1 2026).

Profitability

Fair

YoY net income increased +10.8%, but QoQ net income fell -17.4% (from $545M to $450M). Net margin eased vs Q1 (3.8% -> 3.1%) though gross margin held slightly higher vs Q2 2025 (20.7% -> 20.9%).

Cash Flow Quality

Positive

Operating cash flow was strong at $0.93B and free cash flow $0.76B in Q2 2026. Shareholder payouts continued (dividends $0.27B; buybacks $0.10B) while maintaining positive FCF.

Leverage & Balance Sheet

Neutral

Balance sheet improved QoQ: cash increased to $3.70B and total equity rose to $3.87B. Net debt remained elevated ($5.96B), and leverage is still meaningful (total debt $9.67B).

Shareholder Returns

Fair

Dividend yield is modest (~1.4%). Price momentum is negative: 1y change -15.3%, so total return is likely lagging despite ongoing buybacks/dividends.

Analyst Sentiment & Valuation

Positive

Street consensus target is ~$19.6 vs current $19.88 (roughly flat to slightly downside). Valuation appears reasonable for a cash-generative value stock, with P/E ~10.7.

Disclaimer:This analysis is AI-generated for informational purposes only. Accuracy is not guaranteed and this does not constitute financial advice.

Fundamentals Overview

Loading fundamentals overview...

HP’s Q2 shows resilient growth (revenue +9% y/y) and disciplined profitability (operating margin +20 bps to 7.5%; EPS $0.86 up >20% y/y). The beat is attributed to execution against a mitigation playbook—memory reconfiguration, qualifying lower-cost components, strategic inventory usage, and repricing for commodity increases. Growth is concentrated in Personal Systems: AIPC momentum (mix to 44%), advanced compute/workforce solutions, and premium-category share gains lifted PS operating margin to 5.2% (+30% y/y). The main swing factor is cost trajectory. Management repeatedly guided that memory/storage and broader commodity pressures rise through Q3/Q4, making Q4 a likely trough for PS and putting print margins near the low end in Q3, though improvement is expected in Q4. Demand appears to be shifting from units to value (pricing/mix/attach offsets high-teens TAM unit declines). Net: execution-led beats now, margin volatility later, with tariffs uncertain.

AI IconGrowth Catalysts

  • AIPCs mix rising from >35% to 44% of shipments in the quarter
  • Personal Systems revenue +13% y/y driven by AIPCs, advanced compute solutions, and workforce solutions
  • Industrial Graphics delivered 11 straight quarters of revenue growth (momentum in hardware, supplies, services)
  • Print: tank printer share gains and portfolio extensions; continued double-digit 3D printing growth (5th straight quarter)
  • All-in Plan subscriber growth, supporting higher-margin consumer subscription revenues

Business Development

  • Software collaboration/partner references: Zoom and CrowdStrike
  • GoodNotes leveraging NPU for local audio transcription and summarization
  • “AI Producer” transforming HP AI PCs into professional production studios

AI IconFinancial Highlights

  • Revenue +9% y/y (+6% constant currency); eighth consecutive quarter of top-line growth
  • EPS $0.86, up >20% y/y and above guidance range due to mitigation actions
  • Gross margin 20.9% (up y/y); operating margin 7.5% up 20 bps y/y
  • Personal Systems operating margin 5.2% and +30% y/y, above expectations driven by accelerated mitigation
  • Print revenue flat y/y as expected; Print operating margin 0.3% down y/y as expected (trade-related costs and promotional investment, especially big tanks)
  • Cash flow/capital: $900m+ cash from operations; ~$800m free cash flow; returned nearly $400m via dividends and share repurchase
  • Input cost pressure: memory/storage costs increased sequentially in Q2 and expected to continue rising in Q3 and Q4

AI IconCapital Funding

  • Returned nearly $400 million to shareholders via dividends and share repurchase in the quarter
  • Finished quarter within target leverage ratio; commitment to return ~100% of free cash flow over time subject to gross leverage under 2x
  • Annual free cash flow guidance: solidly $2.8B to $3.0B

AI IconStrategy & Ops

  • 4-pillar mitigation playbook: supplier relationships/long-term agreements; operational planning model aligning supply-demand-configuration in real time; strategic inventory positions and new supplier enrollment; disciplined pricing/cost actions
  • Personal Systems cost actions: lower memory cost via accelerated product reconfiguration and qualifying lower-cost components; repricing for commodity increases; sourcing/platform cost reductions; company productivity actions
  • AI/ops execution: modernizing software development/delivery; consolidating platforms; scaling initiatives across supply chain, go-to-market, and customer support
  • WXP: workforce experience platform manages 5.2 million devices across 180 countries (AI-driven proactive management)
  • Restructuring: voluntary early retirement plan announced in the quarter; Q2 restructuring charges include related expenses

AI IconMarket Outlook

  • Q3 diluted net EPS: $0.61 to $0.71
  • Full-year diluted net EPS: $2.90 to $3.10 (improved confidence vs prior expectation of lower end)
  • Full-year operating margin (directional): expected solidly in the range; PS OP margin rate expected below long-term range for remainder of year
  • Q3 Personal Systems: revenue expected below seasonal due to first-half demand pull forward and increasing input costs
  • Print Q3: operating margins near lower end of long-term range; Q4 improvement expected and full-year print margins solidly in range
  • Supplies: FY expectations unchanged—down low single digit in constant currency; long-term decline low-to-mid single digits
  • Macro demand framing: PC unit TAM down high teens rate in 2H calendar year

AI IconRisks & Headwinds

  • Memory and storage cost pressure expected to rise sequentially through Q3 and Q4
  • Broader inflationary pressures beyond memory/storage (including oil prices and downstream effects)
  • Print margins face commodity/transport pressures (oil-related commodities and transportation costs) in 2H
  • Competitive environment in print/office; enterprise customers prioritizing PC over print in the near term
  • PC market elasticity concerns: rising price environment expected to reduce unit demand (offset by mix/pricing/attach)

Q&A: Analyst Interest

  • Back-half margin offsets (PS): Management explained Q3/Q4 margins will be below long-term range due to rising input costs and less benefit from lower-cost inventory versus Q2, while mitigation actions could create upside. They expect Q4 PS margins to be the trough, then sequential improvement into FY2027.
  • Commercial PC demand durability: Management quantified commercial pull-forward at roughly 2%–3% of revenue, with underlying demand supported by disciplined pricing, richer mix and services expansion. They pointed to Windows refresh tailwinds and structurally improving demand as workloads move to the edge due to rising GenAI costs.
  • Print margin dynamics and tariff refund uncertainty: Management said Q3 print op margins near the low end from seasonality plus placing incremental hardware and commodity/transport pressures; improvement expected in Q4. On tariffs, they noted government refund processing was not currently occurring for complex multinational companies and they are monitoring the evolving process.

Sentiment: MIXED

Note: This summary was synthesized by AI from the HPQ Q2 2026 earnings transcript. Financial data is complex; please verify all metrics against official SEC filings before making investment decisions.

📋 Official Regulatory 10-K / 10-Q SEC Filings

Direct authenticated documentation links to audited SEC database reports for HPQ.

SEC EDGAR Live Feed
Loading financial data and tables...
📁

SEC Filings (HPQ)

© 2026 Stock Market Info — HP Inc. (HPQ) Financial Profile