Kinetik Holdings Inc.

Kinetik Holdings Inc. (KNTK) Market Cap

Kinetik Holdings Inc. has a market capitalization of .

No quote data available.

CEO: Jamie W. Welch

Sector: Energy

Industry: Oil & Gas Midstream

IPO Date: 2018-11-13

Website: https://www.kinetik.com

Kinetik Holdings Inc. (KNTK) - Company Information

Market Cap: -|Sector: Energy

Company Profile

Kinetik Holdings Inc. operates as a midstream company in the Texas Delaware Basin. It provides gathering, transportation, compression, processing, and treating services for companies that produce natural gas, natural gas liquids, crude oil, and water. The company is headquartered in Midland, Texas.

Analyst Sentiment

79%
Strong Buy

From 15 Active Polls

1Y Forecast: $50.50

▲ +0.0% Potential Upside

Consensus Target Metrics

Low Bound

$46

Median

$51

High Bound

$53

Average

$51

Price & Moving Averages

Loading chart...

🎯 Wall Street Analyst Intelligence Report

1-Year structural target targets, chart projections, and sentiment maps.

Average 1Y Target
$50.50
▲ +11.75% Upside
Low Target
$46.00
2% Risk
Median Target
$51.00
13% Mid
High Target
$53.00
17% Max

Consensus Trend Projection

Trailing closures vs. 12-month metrics map.

Analyst Vote Distribution

Aggregate institutional coverage sentiment weights.

Sentiment volume allocation data unavailable.

Historical valuation matrix unavailable.

📘 Full Research Report

ℹ️

AI-Generated Research: This report is for informational purposes only.

📘 KINETIK HOLDINGS INC CLASS A (KNTK) — Investment Overview

🧩 Business Model Overview

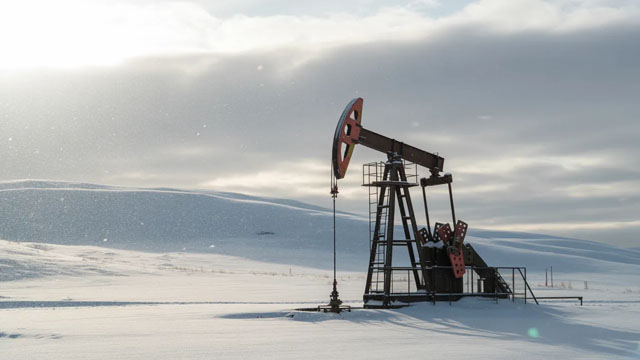
KINETIK HOLDINGS INC CLASS A operates midstream energy infrastructure that connects upstream producers to downstream markets. The value chain is built around physically moving and converting hydrocarbons—through gathering and compression, processing, and transport/storage services—so producers can monetize production while end-users receive consistent supply.

The business model typically works through a combination of fee-based arrangements tied to volumes (e.g., gathering, processing, transportation, storage) and commodity-linked exposures where applicable (e.g., value derived from throughput and product mix). Operational discipline—maintenance reliability, capacity utilization, and contracting of incremental volumes—drives long-run cash generation and reduces earnings volatility.

💰 Revenue Streams & Monetisation Model

Monetisation is anchored in throughput-linked service fees, with revenue recognition influenced by:

  • Volume and utilization: incremental production growth and sustained contract take-or-pay/fee structures typically support more stable cash flows.
  • Service mix: gathering, processing, transportation, and storage often carry different fee profiles and cost structures.
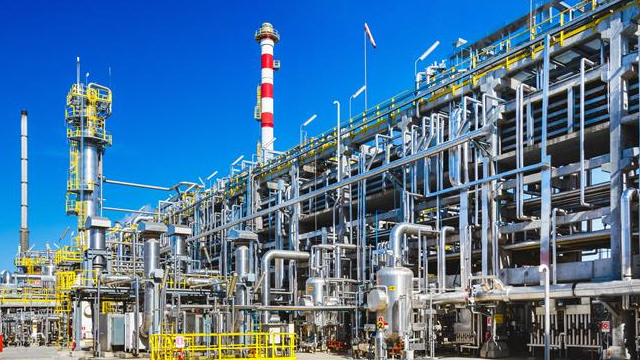
  • Product mix and fractionation/processing economics: when the system captures value from NGL or refined-product streams, margins can reflect quality, yields, and differential relationships.

Primary margin drivers tend to include capacity utilization, operating cost management, and the ability to pass or manage commodity-linked economics through pricing mechanisms or hedging frameworks. In midstream models like this, margin quality usually improves when fixed-cost coverage is supported by contracted volumes and when expansion capital converts into incremental fee streams rather than exposed commodity risk.

🧠 Competitive Advantages & Market Positioning

KINETIK’s competitive positioning is best understood as a logistical infrastructure moat with high effective switching costs. Once pipelines, processing capacity, and storage facilities are built and permitted, competitors cannot easily replicate the right-of-way, interconnects, operating history, and customer interdependencies that determine system reliability and access to end-markets.

Moat thesis (hard-to-replicate advantages):

  • Switching costs & physical network effects (infrastructure lock-in): upstream customers benefit from existing interconnects and integrated routing; downstream counterparties rely on consistent supply timing and quality.
  • Geographic cost advantage: assets placed near supply basins and connected to major demand corridors reduce incremental gathering/transport costs and improve delivered-cost competitiveness.
  • Scale in operations: centralized control of field operations, maintenance, and processing optimization can lower per-unit operating costs and support margin resilience.

Competitive benchmarking (industry peers):

  • EnLink Midstream: similarly operates fee-based gathering, processing, and transportation assets but tends to emphasize different basin footprints and contract structures.
  • ONEOK: a larger-scale network across natural gas and NGL infrastructure; its breadth can support system optimization, while KINETIK’s differentiator is often the specificity of its regional interconnect and throughput capture.
  • Williams Companies: competes through extensive pipeline and processing systems; KINETIK’s competitive edge typically rests on targeted infrastructure placements near supply and demand nodes, rather than purely on size.

Overall, rivals compete for the same upstream volumes and downstream access, but KINETIK’s advantage is the cost and execution reality of building/operating comparable systems in the same operating regions—an activity constrained by permitting, right-of-way, and time-to-completion.

🚀 Multi-Year Growth Drivers

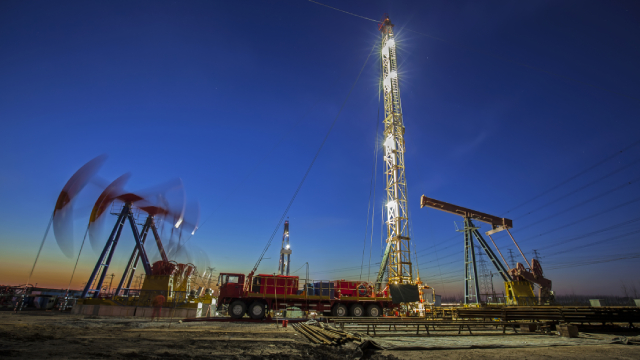
Over a 5–10 year horizon, growth is most plausibly driven by structural demand and basin-to-market dynamics that favor capable midstream operators:

  • North American natural gas and NGL supply growth: expanding upstream drilling programs increase the need for gathering, processing, and takeaway capacity.
  • Rising value of liquids and processing yields: systems that can capture NGL economics benefit from higher recoveries and downstream product demand (e.g., petrochemical feedstocks).
  • Infrastructure buildout where pipelines are constrained: scarcity of incremental transportation/storage capacity often elevates the importance of existing connected assets and supports utilization.
  • Contracting and capacity optimization: reliability improvements, debottlenecking, and incremental commercial arrangements can convert into durable distributable cash flow even when upstream growth is uneven.

The long-term TAM expands as more production requires downstream logistics and processing, and as regulatory and engineering constraints slow greenfield buildouts—tending to strengthen incumbent infrastructure economics.

⚠ Risk Factors to Monitor

  • Regulatory and permitting risk: pipeline routing, emissions compliance, and operational permits can alter project timelines and cost structures.
  • Volume and throughput risk: upstream production declines, customer drilling pauses, or contract renegotiations can reduce utilization.
  • Commodity-linked margin pressure: if any revenue exposure is tied to product spreads/differentials, weaker market conditions can compress cash margins.
  • Capital intensity and execution risk: growth requires continued investment in expansions, integrity maintenance, and reliability upgrades; overruns can impair returns.
  • Counterparty credit risk: midstream economics can be affected by customer payment behavior, especially where take-or-pay structures are less protective.
  • Environmental and operational risk: leaks, downtime, and safety incidents can lead to remediation costs and reputational/regulatory impacts.

📊 Valuation & Market View

Market valuation for infrastructure midstream businesses typically emphasizes distributable cash flow durability and coverage metrics, with common frameworks including:

  • EV/EBITDA (sector-relative): reflects operating scale and margin potential, with adjustments for growth capex and contract structure.
  • DCF yield / distributable cash flow: the principal driver is the gap between cash generated and maintenance/expansion capital needs.
  • Cash flow coverage and leverage: balance sheet strength affects the ability to fund projects without diluting equity returns.

Key drivers that move the needle include contract coverage quality, throughput/volume outlook, cost inflation and reliability performance, and the pace/returns of growth capital deployed into fee-generating assets.

🔍 Investment Takeaway

KINETIK’s long-term investment case rests on infrastructure-based switching costs and geographic logistical advantages that make capacity and interconnects difficult to replicate. As upstream supply and the need for processing/transportation expand, well-positioned midstream operators can sustain utilization, convert capital into incremental fee streams, and manage downside through operational discipline and contracting structures. The thesis is strongest when growth capital translates into stable throughput and when regulatory and volume risks are contained through resilient customer relationships and asset reliability.


⚠ AI-generated — informational only. Validate using filings before investing.

📊 AI Financial Analysis

Powered by StockMarketInfo
Earnings Data: Q Ending 2026-03-31

"Kinetic? (KNTK) reported Q1’26 revenue of $410.0M and net loss of $5.1M (EPS: -$0.07). QoQ, revenue declined from $430.4M (Q4’25) to $410.0M (-4.8% QoQ). Net income swung from +$143.2M (Q4’25) to -$5.1M (-$148.3M QoQ), with margins contracting sharply (net margin: -1.25% vs +33.27% in Q4’25). YoY, revenue was down slightly versus $443.3M in Q1’25 (-7.5% YoY). Net income deteriorated materially versus +$19.3M in Q1’25, moving to -$5.1M (down ~126%). Over the last four quarters, profitability has been highly unstable: net margins ranged from +17.4% (Q2’25) and +33.3% (Q4’25) down to negative in Q1’26, indicating significant earnings volatility. Cash flow quality remains mixed. Operating cash flow was $185.1M in Q1’26 (improving vs -/lower quarters), implying some cash earnings despite the accounting loss; however, leverage is very high with total debt ~$4.04B and equity deeply negative at -$4.04B (balance-sheet stress). Dividend/buyback support appears limited in Q1’26 (dividends paid: $0 reported), while prior quarters showed large payouts. Total shareholder return is supported by strong market momentum: the stock is up +7.7% over 1Y and +29% over 6M, but below a 20% 1Y threshold; valuation sentiment is hard given the negative EPS (price/earnings not meaningful)."

Revenue Growth

Caution

Revenue fell -4.8% QoQ (Q1’26 vs Q4’25) and -7.5% YoY (Q1’26 vs Q1’25), indicating a slowing demand/volume or mix headwind.

Profitability

Neutral

Net margin contracted to -1.25% in Q1’26 from +33.27% in Q4’25; YoY net income swung from +$19.3M to -$5.1M. EPS moved to -$0.07, reflecting major earnings volatility.

Cash Flow Quality

Caution

Operating cash flow was strong at $185.1M in Q1’26 despite net loss. Free cash flow roughly matched operating cash flow (CapEx reported as $0). Prior quarters included large dividends, so sustainability is unclear.

Leverage & Balance Sheet

Neutral

Balance sheet stress is evident: total assets collapsed to ~$0.72M while total debt/liabilities remain very large (~$4.04B) and total equity is deeply negative (-$4.04B). This elevates risk and reduces resilience.

Shareholder Returns

Fair

Market momentum is solid (+28.99% 6M, +7.73% 1Y), but below the >20% 1Y “strong momentum” threshold. Q1’26 dividends paid were $0 in the cash flow line item, limiting near-term yield support.

Analyst Sentiment & Valuation

Neutral

Street target consensus ~$48.5 vs current price $46.67 suggests modest upside (~+4%). Valuation multiples based on earnings are not meaningful due to negative EPS (P/E not interpretable).

Disclaimer:This analysis is AI-generated for informational purposes only. Accuracy is not guaranteed and this does not constitute financial advice.

Fundamentals Overview

Loading fundamentals overview...

Kinetik delivered a record Q1 2026: $251M adjusted EBITDA (above the prior high end), $181M distributable cash flow, and $101M free cash flow. Results were supported by spread-based marketing gains in Midstream Logistics that outweighed ~170 MMcf/d Waha price-related shut-ins, alongside stronger-than-expected system performance (condensate/NGL recoveries, fee margins, and lower unit Opex). Guidance stays firm at $950M–$1.05B adjusted EBITDA and a $450M–$510M CapEx range. The key change is volume expectations: curtailments rise to ~220 MMcf/d average in 2026, reducing growth by >6 percentage points versus February assumptions, yet management frames it as temporary “deferred revenue.” Operational momentum is visible in King’s Landing sour conversion (approvals secured, spud targeted this summer) and ECCC nearing in-service. Commercially, Durango amendments expand acreage ~25% and amend ~75% of legacy Durango volumes, improving long-term visibility into the mid/late 2030s and fee exposure. Overall tone is positive, with cautious acknowledgment of persistent Waha volatility and the reliance on marketing spreads to bridge curtailments.

AI IconGrowth Catalysts

  • Durango contract amendments: ~25% expansion of dedicated acreage in New Mexico; amendments consolidated into a single contract extending through 2039; ~75% of legacy Durango gas processing volumes amended over past four months
  • King’s Landing sour conversion project: approvals from BLM and NMOCD for full 20 MMcf/d TAG capacity; plan to spud first acid gas injection well this summer; enables 26.5 MMcf/d total operational TAG capacity and >31 MMcf/d permitted capacity
  • ECCC pipeline nearing completion with in-service later in Q1/Q2 2026 timeframe; described as a capital-light/optionality enabler for processing incremental “sweet New Mexico” volumes prior to further King’s Landing expansion
  • Diamond Cryer 40 MW behind-the-meter power generation at Delaware South: turbine equipment started arriving; EPC/permitting underway

Business Development

  • Pecos Power zero CapEx interconnection: Delaware Link residue gas pipeline connected to Pecos Power Plant in Reeves County
  • CPV Basin Ranch interconnection announced late 2025 (referenced as additional linkage to power generation demand)
  • European LNG price contract with INEOS starting early 2027 (named as a forward premium/hedge-like support to offset Waha weakness)
  • Contract amendment with a large existing New Mexico customer expanding dedicated acreage by ~25% and extending terms through 2039
  • Pilot program with Palantir (Feb start) to improve data-driven execution

AI IconFinancial Highlights

  • Q1 2026 adjusted EBITDA: $251 million, record and above the high end of the prior outlook range
  • Distributable cash flow: $181 million; free cash flow: $101 million
  • Midstream Logistics adjusted EBITDA: $179 million, up 12% YoY on flat volumes; spread-based marketing gains more than offset ~170 MMcf/d Waha price-related production shut-ins
  • Pipeline Transportation adjusted EBITDA: $78 million, down YoY due to EPIC Crude divestiture (closed Oct 31) and lower Chinook throughput
  • Updated 2026 processed gas volume outlook: low- to mid-single-digit YoY growth vs prior high single-digit; reflects ~220 MMcf/d average curtailments in 2026 vs prior ~100 MMcf/d curtailments
  • Volume change magnitude: incremental 120 MMcf/d curtailments implies decline of >6 percentage points vs original growth expectations
  • 2026 guidance: adjusted EBITDA range affirmed at $950 million to $1.05 billion; management estimates ~+$20 million uplift from mark-to-market commodity price exposure at forward pricing (excluding Gulf Coast marketing spread)
  • Waha pricing stress cited: March/April gas daily average price at Waha negative $4.81
  • Hedging: ~50% of transport spread exposure hedged for 2026; equity volumes hedged ~75% for propane/butane and ~85% for crude and C5+
  • Leverage: 3.9x within targeted range; revolver capacity described as ample

AI IconCapital Funding

  • Q1 CapEx (growth + maintenance): $91 million
  • Full-year 2026 CapEx guidance reaffirmed: $450 million to $510 million; remaining spend expected to be evenly weighted across quarters
  • Return of capital: described as supported by “flexibility” from balance sheet and cash flow profile; no explicit buyback/debt dollar amounts disclosed in transcript

AI IconStrategy & Ops

  • Automation/data: Palantir pilot began in February; early results support more data-driven execution
  • Operating cost optimization: operating + G&A tracking in line with budget; efficiencies identified to optimize cost structure for 2027 and thereafter
  • Gulf Coast takeaway capacity resilience: secured more residue gas transport capacity to Gulf Coast at end of last year to provide financial insulation against Waha price-related production shut-ins
  • Gulf Coast exposure risk management: “extremely vigilant” about medium- and long-term Gulf Coast transportation capacity portfolio
  • Earnings cadence guidance maintained: Q2 expected $230–$240M; Q3 and Q4 each $260–$270M (no cadence change despite Q1 beat)

AI IconMarket Outlook

  • 2026 adjusted EBITDA guidance affirmed: $950 million to $1.05 billion
  • 2026 CapEx guidance reaffirmed: $450 million to $510 million; ~$91 million spent in Q1
  • Processed gas volumes revised: from high single-digit growth (inclusive of 100 MMcf/d curtailments) to low- to mid-single-digit growth with ~220 MMcf/d average curtailments in 2026
  • Waha-to-Houston Ship Channel spread: wider than assumed in guidance; ~50% of transport spread exposure hedged in 2026
  • Back-half earnings cadence reiterated: Q2 $230–$240M; Q3/Q4 $260–$270M each
  • Near-term Permian egress build timing: >5 Bcf/d new capacity in service by early 2027; additional ~6 Bcf/d anticipated across 2028 and 2029

AI IconRisks & Headwinds

  • Waha price environment remained exceptionally weak: negative $4.81 Waha daily average in March/April
  • Higher-than-expected price-related production shut-ins: curtailments increased to ~220 MMcf/d average in 2026 (vs prior 100 MMcf/d), driving a >6 percentage point reduction vs original processed volume growth expectations
  • Marketing gains vs curtailment losses dependency: management indicates curtailed volumes persist and marketing margins decline later (Gulf Coast marketing margins declining into December)
  • Volatility risk: management described “unprecedented volatility” and difficulty rationalizing negative Waha pricing into October despite forward curve improvements
  • Maintenance-season spread/curtailment risk: spread hedging lower during spring/fall maintenance and higher in summer/winter; additional risk if pipeline reliability differs from expectations
  • No fee floors on G&P side (explicitly stated): curtailments can directly impact margin structure

Q&A: Analyst Interest

  • Durango amendments economics & portfolio mix: Management guided that incremental EBITDA contribution for 2026 is “modest” at 1% to 2% of the base business. They emphasized term extensions through 2039, increased fee-based weighting from ~60% fee/40% commodity toward higher fee exposure, and reduced commodity within the contract portfolio.
  • Waha shut-ins vs earnings cadence drivers (back-half ramp): Management reaffirmed no change to Q2 $230–$240M and Q3/Q4 $260–$270M cadence. They stated curtailed volumes are expected to persist through most of 2026 and resume in December, while marketing revenues act as “deferred revenue” support; Waha remains negative through October per forward spreads.
  • King’s Landing 2 timing & FID optionality: Management said they are “getting close” to FID after knocking down incremental steps toward the plant end-point. They positioned ECCC as a capital-light bridge enabling incremental processing before King’s Landing 2, and referenced timing alignment to avoid being “on an island” in Delaware North.

Sentiment: POSITIVE

Note: This summary was synthesized by AI from the KNTK Q1 2026 earnings transcript. Financial data is complex; please verify all metrics against official SEC filings before making investment decisions.

Loading financial data and tables...
© 2026 Stock Market Info — Kinetik Holdings Inc. (KNTK) Financial Profile