Gladstone Land Corporation

Gladstone Land Corporation (LAND) Market Cap

Gladstone Land Corporation has a market capitalization of $399.9M.

Price: $9.27

β–Ό -0.06 (-0.64%)

Market Cap: 399.88M

NASDAQ Β· time unavailable

CEO: David John Gladstone

Sector: Real Estate

Industry: REIT - Specialty

IPO Date: 2013-01-29

Website: https://www.gladstonefarms.com

Gladstone Land Corporation (LAND) - Company Information

Market Cap: 399.88M|Sector: Real Estate

Company Profile

Founded in 1997, Gladstone Land is a publicly traded real estate investment trust that acquires and owns farmland and farm-related properties located in major agricultural markets in the U.S. and leases its properties to unrelated third-party farmers. The Company, which reports the aggregate fair value of its farmland holdings on a quarterly basis, currently owns 127 farms, comprised of approximately 94,000 acres in 13 different states, valued at approximately $1.0 billion. Gladstone Land's farms are predominantly located in regions where its tenants are able to grow fresh produce annual row crops, such as berries and vegetables, which are generally planted and harvested annually. The Company also owns farms growing permanent crops, such as almonds, apples, figs, olives, pistachios, and other orchards, as well as blueberry groves and vineyards, which are generally planted every 10 to 20-plus years and harvested annually. The Company may also acquire property related to farming, such as cooling facilities, processing buildings, packaging facilities, and distribution centers. The Company pays monthly distributions to its stockholders and has paid 93 consecutive monthly cash distributions on its common stock since its initial public offering in January 2013. The Company has increased its common distributions 20 times over the prior 23 quarters, and the current per-share distribution on its common stock is $0.0449 per month, or $0.5388 per year.

Analyst Sentiment

66%
Buy

From 6 Active Polls

1Y Forecast: $13.33

β–² +43.8% Potential Upside

Consensus Target Metrics

Low Bound

$10

Median

$14

High Bound

$16

Average

$13

Price & Moving Averages

Loading chart...

🎯 Wall Street Analyst Intelligence Report

1-Year structural target targets, chart projections, and sentiment maps.

Average 1Y Target
$13.33
β–² +43.80% Upside
Low Target
$10.00
8% Risk
Median Target
$14.00
51% Mid
High Target
$16.00
73% Max
Consensus
Buy
6 / 11 Buys

Consensus Trend Projection

Trailing closures vs. 12-month metrics map.

Analyst Vote Distribution

Aggregate institutional coverage sentiment weights.

πŸ“Š Historical Valuation Multiples

Real-time Trailing Twelve Month (TTM) momentum side-by-side with discrete quarterly metrics.

Fiscal QuarterTTMQ1 2026Q4 2025Q3 2025Q2 2025Q1 2025Q4 2024Q3 2024Q2 2024
Period EndingTrailing 12MMar 31, 2026Dec 31, 2025Sep 30, 2025Jun 30, 2025Mar 31, 2025Dec 31, 2024Sep 30, 2024Jun 30, 2024
Market Cap ($M)400417334332368381391498484
Enterprise Value ($M)8798968458018348379001,016983
Price to Earnings Ratio (P/E)-64.37-24.2019.8339.71-11.686.30181.0720756.43-146.97
Price/Earnings-to-Growth Ratio (PEG)β€”β€”0.150.89β€”β€”β€”3469.78-28.48
Price to Sales Ratio (P/S)4.5425.188.0618.6429.9322.6518.5422.0722.72
Price to Book Ratio (P/B)0.550.610.500.500.550.550.570.720.68
Price to Free Cash Flow Ratio (P/FCF)64.1145.9235.11-24.59326.24142.5237.81-165.7232.10
Enterprise Value to Sales (EV/Sales)β€”54.1520.3845.0167.8249.7842.6845.0046.18
Enterprise Value to EBITDA (EV/EBITDA)16.6981.2443.6849.76133.9228.3961.7571.3472.59
Debt to Equity Ratio9.100.710.800.730.740.720.770.770.78

⚑ LAND Growth Runway Model

Standard long term linear growth fade

Multi-Stage Discounted Cash Flow Sandbox

Market Price$9.27
Intrinsic Value$9.27
Market Alignment
Undervalued by 0.0%relative to calculated intrinsic value
9.00%
Exp: 1%1%
i

Growth runway slowdown

This value provides a time window for the growth rate to decline beyond Stage 1 toward the terminal rate. Longer windows are most useful for companies with high growth starting conditions or strong competitive advantages. This option stretches out the growth rate slowdown across 5, 10, or 15-year steps. A high-growth starting condition (exceeding a 25% initial growth rate) automatically applies a curve decay to simulate realistic, rapid market saturation.
i

Terminal growth rate

With long-term inflation between 3-5%, revenue must grow by that baseline to maintain flat real-world market share. This value sets the permanent terminal growth rate to factor into the valuation beyond the growth slowdown runway toward maturity.

3-Stage Financial Runway Horizon

🧠 Perpetuity Horizon Engine (Stage 3: Post-2035)

Terminal FCF Base$0.08B
Perpetuity TV Value$1.49B
Discounted TV (PV)$0.63B
TV Weighting %58.3%
⚠️
Financial Model Disclaimer & Risk Disclosure: This interactive scenario simulator is an educational sandbox provided strictly for informational and analytical research purposes. Core historical financial statements and consensus estimates are sourced directly via Financial Modeling Prep (FMP). All downstream outputs are entirely deterministic, hypothetical projections generated by combining automated mathematical formulas (including linear interpolation and Gaussian bell-curve decay models) with user-selected variables and third-party financial data inputs. Users assume all liability for trading decisions executed based on these sandbox calculations.

πŸ“˜ Full Research Report

ℹ️

AI-Generated Research: This report is for informational purposes only.

πŸ“˜ GLADSTONE LAND REIT CORP (LAND) β€” Investment Overview

🧩 Business Model Overview

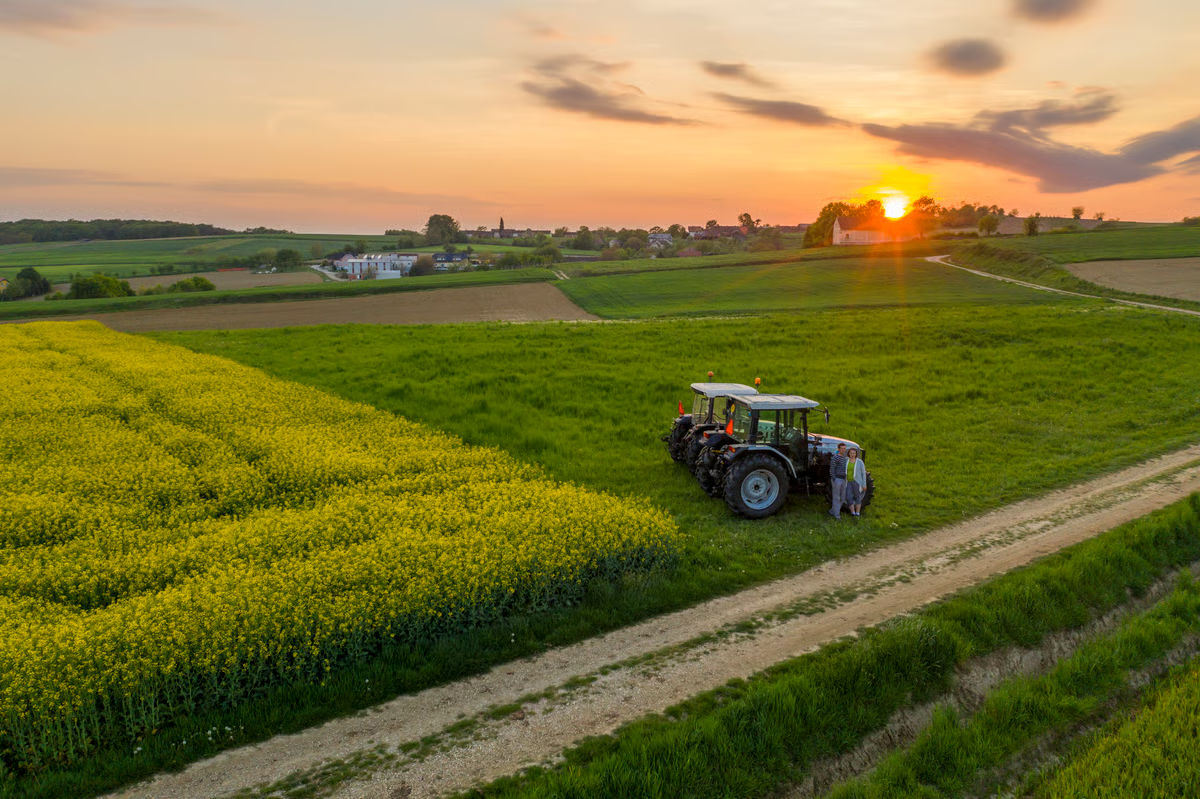
Gladstone Land REIT Corp owns and acquires productive agricultural real estate and leases it to farming operators. The value chain is primarily: (1) sourcing farmland assets with durable productivity characteristics, (2) underwriting long-duration cash-flow potential through tenant/lease structure and local operating conditions, and (3) maintaining and improving the land and infrastructure needed for reliable crop output. The customer relationship is lease-based; tenant operators generally prefer continuity on well-located parcels with established land quality, drainage/irrigation characteristics, and operational familiarity, which can reduce churn versus renting unfamiliar or less-prepared acreage.

πŸ’° Revenue Streams & Monetisation Model

Revenue is dominated by recurring rental income from farmland leases, which is typically structured to transfer a portion of operating costs to tenants (consistent with common net-lease mechanics in farmland). This provides a relatively stable core cash-flow stream where margins are driven by:
  • Rental occupancy and renewal economics (lease terms, rent step-ups, and re-leasing outcomes after expirations).
  • Land productivity and asset selection (soil quality, water access, and parcel-level yield potential translate into tenant demand and pricing power).
  • Expense pass-through and cost control (where lease structure allows expenses to be recovered, or where asset-level efficiency lowers owner costs).
A secondary monetisation channel can come from property dispositions, where gains (or losses) depend on the gap between acquisition yield and prevailing land valuations, less transaction and selling costs. The REIT structure also channels most cash distributions through to investors, making AFFO quality and balance-sheet resilience central to the model.

🧠 Competitive Advantages & Market Positioning

LAND’s moat is strongest around geographic and asset-specific scarcity plus an execution platform for acquiring and managing productive farmland. While farmland is not a β€œnetwork” business, the competitive edge is structural: arable land with desirable water access, appropriate soil characteristics, and workable locations is limited, and the underwriting and sourcing process is operationally demanding. Over time, LAND’s established relationships with tenants and local professionals can support smoother leasing and better visibility into farm economics, which functions similarly to β€œswitching costs” on the asset levelβ€”tenants are less inclined to change parcels when productivity and operational readiness are proven. Competitive benchmarking (primary alternatives for capital exposure):
  • Farmland Partners (FPI) β€” Both invest in farmland exposure, but LAND’s focus emphasizes building a dense portfolio of agricultural real estate where operating and lease-structure discipline can be applied consistently. The contest is often over asset selection quality and the ability to sustain occupancy and rental economics through agricultural cycles.
  • Institutional farmland funds (private) and other platform managers β€” These rivals may compete aggressively on scale and acquisition pricing. Private vehicles can have different liquidity constraints and capital sources, but often lack the same day-to-day public-market discipline on transparency and distribution coverage.
  • Forestry and other real-asset land exposure (e.g., timber REITs such as Rayonier and PotlatchDeltic) β€” They provide alternative β€œland-as-an-asset” exposure. Their moats are tied to timber growth cycles rather than crop economics, so their tenant and demand drivers differ; however, they compete for investor allocation to real assets.
Overall, LAND’s positioning is best viewed as cropland-focused real estate selection and lease management rather than a broad natural-resource allocator.

πŸš€ Multi-Year Growth Drivers

Over a 5–10 year horizon, growth is tied to both cash-yield durability and reinvestment opportunities:
  • Land scarcity and long-duration demand for food production β€” Productive agricultural acreage is limited, while demand for agricultural output remains structurally supported by population growth and changing diets.
  • Portfolio diversification across crop types and geographies β€” Diversification can reduce the impact of localized weather events and crop-specific volatility, improving the stability of rental income.
  • Lease renewals and rent reset economics β€” Where land productivity is proven, renewal rates and rent levels can benefit from inflation and farm-revenue dynamics.
  • Capital recycling with disciplined underwriting β€” The ability to recycle capital from mature assets into higher-quality parcels can lift blended yield over time, provided spreads are maintained through cycles.
  • Incremental infrastructure and land improvement β€” Investments that preserve or enhance productivity (e.g., water access, drainage, or other improvements) can support tenant profitability and thus tenant retention.

⚠ Risk Factors to Monitor

Key structural and cyclical risks include:
  • Agricultural and weather risk β€” Drought, excess rainfall, and regional yield impacts can affect tenant economics and lease performance, even when rental agreements include cost-sharing provisions.
  • Interest rate and refinancing risk β€” REIT leverage and property acquisition cadence can be pressured if financing costs rise or if market liquidity tightens.
  • Tenant credit and lease concentration β€” Concentrated exposure to certain operators, crops, or regions can amplify downturn impacts if a small number of tenants face persistent profitability stress.
  • Regulatory and ESG constraints β€” Water usage regulations, environmental compliance, and land-use restrictions can increase operating costs or limit improvement activities.
  • Valuation and disposition cycle risk β€” Gains from property sales depend on maintaining favorable cap rates and transaction liquidity; weak exit markets can delay monetisation and pressure NAV.

πŸ“Š Valuation & Market View

Market valuation for farmland REITs typically emphasizes NAV-based frameworks and cash-flow durability rather than purely earnings multiples. The principal drivers include:
  • Property-level capitalization rates (cap rate assumptions for agricultural land influence NAV and the market’s pricing of new acquisitions).
  • AFFO quality and distribution coverage (stability of rental income, expense recovery, and vacancy/renewal outcomes).
  • Spread between acquisition yields and cost of capital (the ability to compound returns through disciplined reinvestment).
  • Leverage profile (sensitivity to interest rates and refinancing conditions).
In this sector, the market frequently re-prices assets based on changes in real rates, cap rate trends, and expectations for rental durability through agricultural cycles.

πŸ” Investment Takeaway

LAND’s long-term thesis rests on owning scarce, productivity-driven agricultural real estate and converting that scarcity into stable, lease-based cash flows. The competitive advantage is not a conventional β€œbrand” moat, but a combination of asset specificity (location, water access, soil characteristics), operational underwriting capability, and tenant retention dynamics that can support rent durability through cycles. The primary determinants of per-share outcomes are acquisition discipline, lease performance, and maintaining balance-sheet flexibility across interest-rate and commodity-driven periods.

⚠ AI-generated β€” informational only. Validate using filings before investing.

πŸ“° Market News & Coverage

15 Stories Available

Real-time institutional reporting and market updates for LAND.

fool.comβ€’2026-06-06

2 Stable REITs for Growth, Even in High-Inflation Periods

For investors looking for income, Gladstone Land and Realty Income provide stability along with dividend yields above 5%.

invezz.comβ€’2026-06-04

FTSE 100 drops amid China banking concerns and falling oil prices

The UK's benchmark FTSE 100 index fell to its lowest level in more than two weeks on Thursday, weighed down by sharp declines in Asia-focused lenders and miners after reports of tighter offshore banking restrictions in China. Lower crude oil prices also dragged energy stocks lower, adding to the market's weakness.

accessnewswire.comβ€’2026-06-02

Gladstone Land Corporation Announces Election of George "Chip" Stelljes, III as Director

MCLEAN, VA / ACCESS Newswire / June 2, 2026 / Gladstone Land Corporation (NASDAQ:LAND) (the "Company") announced that George "Chip" Stelljes, III has been elected to the 2028 class of directors for the Company, effective June 1, 2026. Mr. Stelljes has also been appointed to serve on the Company's Compensation Committee, Ethics, Nominating & Corporate Governance Committee and Valuation Committee.

etftrends.comβ€’2026-05-30

Mailbag: A Follow-Up on Pfizer & Other Questions

Two weeks ago, I said that one of my favorite stocks right now is Pfizer (PFE). The pharmaceutical giant is in the middle of a transformational period with the goal to return to growth by 2029.

seekingalpha.comβ€’2026-05-18

Gladstone Land Q1: Lease Restructuring Is Reaching Earnings (Rating Upgrade)

Gladstone Land is navigating severe agricultural headwinds by restructuring leases and recapitalizing its balance sheet. LAND's shift from fixed-base rents to participation-based leases increases earnings volatility but supports tenant viability amid industry stress. A $500 million share issuance and ongoing asset sales are focused on deleveraging and capital preservation, with acquisitions paused.

seekingalpha.comβ€’2026-05-17

Inflation Reignites, Yields Spike

Surging oil prices and hotter inflation reports reignited rate-hike concerns, sending Treasury yields to one-year highs as the Iran conflict remained stalemated despite the highly anticipated Trump-Xi summit.

seekingalpha.comβ€’2026-05-12

Gladstone Land Corporation (LAND) Q1 2026 Earnings Call Transcript

Gladstone Land Corporation (LAND) Q1 2026 Earnings Call Transcript

marketbeat.comβ€’2026-05-12

Gladstone Land Q1 Earnings Call Highlights

Gladstone Land NASDAQ: LAND reported a first-quarter net loss as management said it continues to work through tenant issues, vacant farms and a greater reliance on crop-participation arrangements, while early pistachio revenue helped lift adjusted funds from operations from a year earlier.

zacks.comβ€’2026-05-11

Gladstone Land (LAND) Tops Q1 FFO and Revenue Estimates

Gladstone Land (LAND) came out with quarterly funds from operations (FFO) of $0.08 per share, beating the Zacks Consensus Estimate of $0.01 per share. This compares to FFO of $0.06 per share a year ago.

accessnewswire.comβ€’2026-05-11

Gladstone Land Announces First Quarter 2026 Results

Please note that the limited information that follows in this press release is a summary and is not adequate for making an informed investment decision. MCLEAN, VA / ACCESS Newswire / May 11, 2026 / Gladstone Land Corporation (Nasdaq:LAND) ("Gladstone Land" or the "Company") today reported financial results for the first quarter ended March 31, 2026.

accessnewswire.comβ€’2026-05-07

Gladstone Land Corporation Earnings Call and Webcast Information

MCLEAN, VA / ACCESS Newswire / May 7, 2026 / Gladstone Land Corporation (Nasdaq:LAND) announces the following event: What: Gladstone Land Corporation's First Quarter Ended March 31, 2026, Earnings Call & Webcast When: Tuesday, May 12, 2026 @ 8:30 a.m. ET Where: https://event.choruscall.com/mediaframe/webcast.html?webcastid=v9W0cELA How: By webcast -- Log on to the web at the address above By phone -- Please call (877) 407-9046 Contact: Gladstone Land Corporation, (703) 287-5893 A conference call replay will be available after the call and will be accessible through May 19, 2026.

seekingalpha.comβ€’2026-04-27

Gladstone Land's 7.2% Yielding Preferreds Benefitting From Buybacks

Gladstone Land's common shares have likely fully discounted higher rates and are poised to benefit from long-term farmland demand and potential soft commodity rebounds. The preferreds, yielding around 7.2%, remain attractive but are less compelling than at peak spreads; management's capital allocation has supported preferred performance. We expect common shares to outperform as the company halts below-NAV issuance and as farmland fundamentals improve.

defenseworld.netβ€’2026-04-21

Head to Head Analysis: Gladstone Land (NASDAQ:LAND) versus Postal Realty Trust (NYSE:PSTL)

Gladstone Land (NASDAQ: LAND - Get Free Report) and Postal Realty Trust (NYSE: PSTL - Get Free Report) are both small-cap finance companies, but which is the superior business? We will contrast the two businesses based on the strength of their institutional ownership, analyst recommendations, valuation, profitability, risk, dividends and earnings. Profitability This table compares Gladstone Land

defenseworld.netβ€’2026-04-10

Accordant Advisory Group Inc Has $1.18 Million Stock Holdings in Gladstone Land Corporation $LAND

Accordant Advisory Group Inc cut its holdings in Gladstone Land Corporation (NASDAQ: LAND) by 49.4% in the undefined quarter, according to its most recent 13F filing with the SEC. The firm owned 128,650 shares of the real estate investment trust's stock after selling 125,383 shares during the quarter. Gladstone Land comprises 0.8% of

seekingalpha.comβ€’2026-04-08

Mousetraps: 9 High-Yield REITs With Risky Dividends

High-yield 'mousetrap' REITs consistently underperform, with significant risk of dividend cuts and capital loss, as evidenced by recent 12-month returns lagging VNQ by over 1,000 bps. Dividend Safety scores are critical; REITs rated F face a 40% chance of a cut within 12 months, often resulting in sharp share price declines. Key danger signals include high payout ratios, weak revenues, and heavy debt loads.

πŸ“Š AI Financial Analysis

Powered by StockMarketInfo
Earnings Data: Q Ending 2026-03-31

"LAND reported Q1’26 revenue of $14.8M, with net income of -$10.0M (EPS -$0.24). QoQ, revenue fell sharply from $41.5M in Q4’25 to $14.8M (-64.3%), and net income swung from +$4.2M to -$10.0M. YoY, revenue decreased from $16.8M in Q1’25 to $14.8M (-12.0%), while net income deteriorated from +$15.1M to -$10.0M (down ~166.0%). Profitability is highly volatile across the last four quarters: gross margin expanded to ~98.9% in Q1’26 versus 19.9% in Q4’25, but the company still produced a deep net loss driven by heavy other income/expense effects (income before tax was -$10.0M). Operating income remained positive at $12.7M (operating margin 85.7%), yet the total pre-tax and net result moved materially lower due to ~$22.7M of unfavorable β€œtotalOtherIncomeExpensesNet.” Cash flow turned negative for shareholders: operating cash flow was +$9.3M, but dividends paid were -$6.0M and total cash decreased by -$18.6M QoQ, ending with $8.6M cash. Shareholder returns from the stock were positive but modest (price +8.65% over 1y), and there is no buyback support disclosed in the quarter. Overall leverage remains dominated by a large asset base and large liabilities; equity is stable but not improving in the latest quarter (equity ~ $688M vs ~$670M at Q4’25)."

Revenue Growth

Caution

Revenue was $14.8M in Q1’26, down -64.3% QoQ from $41.5M (Q4’25) and down -12.0% YoY from $16.8M (Q1’25).

Profitability

Neutral

Operating income stayed positive ($12.7M; 85.7% margin) but net income swung to -$10.0M vs +$4.2M QoQ and +$15.1M YoY. Net margin contracted sharply and pre-tax income was deeply negative.

Cash Flow Quality

Caution

Operating cash flow was +$9.3M in Q1’26, but net income remained negative and cash fell materially QoQ (-$18.6M). Dividends paid (-$6.0M) reduced flexibility; free cash flow was +$9.3M for the quarter.

Leverage & Balance Sheet

Fair

Total assets were ~$1.20B in Q1’26, with equity around $688M (slightly higher QoQ). However, leverage is still meaningful (liabilities ~$515M) and cash is low vs prior quarter.

Shareholder Returns

Caution

Price return was +8.65% over 1y, below the >20% momentum threshold. Dividends were paid (-$6.0M in Q1’26) but the profit payout profile is challenged by net losses.

Analyst Sentiment & Valuation

Neutral

Consensus target is ~$13.33 vs current price $10.30 (~+29% upside), but the earnings profile is deteriorating (net losses), which typically increases valuation risk despite target upside.

Disclaimer:This analysis is AI-generated for informational purposes only. Accuracy is not guaranteed and this does not constitute financial advice.

Fundamentals Overview

Loading fundamentals overview...

Gladstone Land’s Q1 2026 results show improved AFFO (to $0.08/share) driven by an early pistachio marketing bonus, partially offset by tenant stress and reduced fixed rent. Management highlighted a transition toward modified/participation leases and direct operations using third-party operators, with the stated goal to return to fixed-based rents only if interest rates fall and tenant capital constraints easeβ€”suggesting participation structures likely persist into 2026 and possibly 2027. Operating volatility remains tied to tree nut crop outcomes: a March pistachio bloom heat spell aborted some fruit, though it may be muted by alternate-bearing dynamics and could be offset by strong pricing from supply reductions. Liquidity improved materially via credit-facility collateral expansion and ATM funding, while leverage reduction continued through preferred redemption (5% to 8% step-up avoided) and >$6 million preferred buybacks at a 7.4% yield. Re-leasing vacant acreage is shifting toward water/solar/fallowing alternatives, with a near-term 3-month execution target.

AI IconGrowth Catalysts

  • Early pistachio crop bonus recognized in Q1 2026, with remaining portion expected to be recognized in Q4 2026
  • 2025 harvest strength (almonds and pistachios meeting/exceeding projections) continuing to pay in 2026 with similar earning patterns expected
  • Pistachio pricing firming up as 2025 crop is strong and supply reductions are expected to support upward pricing; 2026 minimum pricing expected to be significantly higher than 2025
  • High spring soil water content following above-normal rainfall and reservoirs above normal, supporting strong crop starts despite weak winter snowpack

Business Development

  • Lease expirations: 5 leases scheduled to expire over the next 6 months, representing ~4% of total lease revenue year-to-date in 2026
  • Vacancy remediation: 8 farms wholly or partially vacant; management expects to have them stabilized before year-end
  • Tenancy cash-basis accounting: 4 tenants where revenue is recognized on a cash basis; one situation resolved in the quarter and 2 additional tenants added after falling behind
  • Colorado potato farm moved from fixed base rent to participation rents; base rent cut roughly in half while variable component expected to bring total near prior economics
  • Re-leasing strategy for vacant acreage: alternative streams including fallowing incentive programs, water leases, and solar leases; management targeted execution within ~3 months (at least half the acreage within 3–6 months)

AI IconFinancial Highlights

  • Q1 2026 net loss: ~$4.3 million; net loss to common shareholders ~$10.0 million or $0.24/share
  • Q1 2026 Adjusted FFO (AFFO): $3.1 million or $0.08/share vs $2.0 million or $0.06/share prior year quarter
  • AFFO increase driven by early pistachio crop bonus payment received, partially offset by ongoing tenant-related issues
  • Year-over-year fixed base cash rents decreased by ~$2.4 million due to (1) one property transitioned to direct operations in 2025 and (2) two tenants on nonaccrual status in Q1 2026 (prior year included a $2.4 million termination fee from an outgoing tenant)
  • Participation rents increased by ~$4.4 million primarily from early partial bonus payment on the 2025 pistachio crop (remaining portion expected in Q4 2026)
  • Cash operating expenses increased by ~$0.75 million; property operating expenses increased due to supplemental water provided under a lease and higher professional fees protecting water rights
  • Liquidity: ~$150 million immediately available capital; ~$110+ million unpledged properties for additional collateral
  • Capital structure: redeemed Series D Term Preferred Stock in January to avoid coupon step-up from 5% to 8%; redemption funded via ATM common stock issuance and a line of credit draw later repaid
  • Buybacks: repurchased >$6 million of Preferred Stock in 2026 at an average repurchase yield of 7.4%, generating ~+$0.7 million total gain
  • Borrowing profile: >99% fixed rate with weighted average interest rate of 3.41% locked in for another 2.5 years
  • Common dividend: $0.0467/share monthly for Q2 2026; implied 5.9% annualized yield at $9.44 stock price

AI IconCapital Funding

  • No new borrowings or loan repayments during the quarter
  • Added unencumbered properties to existing/new credit facilities increasing immediately available liquidity by ~+$50 million
  • ATM raised ~$50 million YTD 2026; used primarily to reduce leverage including preferred redemption, line-of-credit repayment, and preferred repurchases
  • Repurchase program: >$6 million preferred repurchased YTD 2026; average repurchase yield 7.4%; ~+$0.7 million gain
  • Debt amortization: ~$17 million scheduled principal amortization over next 12 months (<4% of total debt)
  • Rate resets: ~$155 million loans with fixed-rate terms resetting over the next year; includes ~$133 million under the MetLife facility scheduled to reprice in January 2027
  • Revolver status (Q&A): revolver fully repaid to minimum balance; management continued to route excess to preferred repurchases rather than revolver paydown

AI IconStrategy & Ops

  • Continued emphasis on modified lease agreements and/or direct operations using third-party farm operators
  • Plan to transition modified lease structures back toward fixed-based rents, but timing tied to macro rate environment and tenant capital constraints; management suggests participation-based structure likely persists into at least the 2026 and possibly 2027 crop years
  • Vacant acreage: pursuing non-traditional income streams (water leases, solar leases, fallowing incentives) rather than standard ag leasing initially
  • Water security initiative: acquiring water for current and future years; investing in water delivery/storage infrastructure and pursuing synergies across farm assets

AI IconMarket Outlook

  • Management expects remaining marketing bonus from the 2025 pistachio crop to be recorded in Q4 2026; bonus total anticipated to be higher than 2024 at a management-guess range of ~$0.40/lb to possibly ~$0.90/lb (vs $0.90/lb total last year and ~$0.50/lb received early)
  • Management expects 2026 minimum pricing to be significantly higher than 2025
  • Tenant re-leasing timeline (vacant farms): target execution within ~3 months; aim to return at least half of vacant acreage to income-producing status within 3–6 months
  • Lease expirations: 5 leases over next 6 months (~4% of 2026 lease revenue year-to-date) with discussions ongoing for renewals/new tenants

AI IconRisks & Headwinds

  • Tenant credit/occupancy: ongoing tenant-related issues; two tenants placed on nonaccrual status in Q1 2026 contributing to fixed base cash rent decline
  • Vacancy risk: 8 farms wholly or partially vacant; alternative lease structures may be slower to execute and may not fully replace fixed rent economics
  • Pistachio crop uncertainty: March hot spell during pistachio bloom caused trees to abort a significant crop percentage; impact may be limited by 2026 being a pistachio down year/alternate bearing, but outcome remains uncertain
  • Rate environment risk: management explicitly conditions lease structure transitions on lower interest rates; CEO urged rates closer to ~3.5% previously used for borrowing
  • Water and cost variability: potential for increased water expense on a couple of ranches; one farm required supplemental water under a lease in Q1
  • Macros: war/tariff drama and trade tension referenced as ongoing, though management believes crop markets have partially accepted uncertainty

Q&A: Analyst Interest

  • Pistachio marketing bonus timing and magnitude: Management said the remaining bonus should be recorded in Q4 2026, but the final amount is unknown. Early payment represented about $0.50/lb versus $0.90/lb total last year. Management suggested a $0.40/lb to as high as $0.90/lb range.
  • Vacant property re-leasing approach and timeline: Management described vacant farms as close to deals, but re-leasing may not be traditional leases. They are pursuing fallowing incentive programs, water leases, and solar leases. They targeted execution within ~3 months and at least half acreage income-producing within 3–6 months.
  • Return of participation-based farms to fixed rent: Management said timing is uncertain and likely not for 2026, while 2027 remains in flux. The core issue is tenant pool risk-taking ability and capital constraints for growers. Management indicated participation-based leasing may persist for at least another season, driven by working capital limitations.

Sentiment: MIXED

Note: This summary was synthesized by AI from the LAND Q1 2026 earnings transcript. Financial data is complex; please verify all metrics against official SEC filings before making investment decisions.

πŸ“‹ Official Regulatory 10-K / 10-Q SEC Filings

Direct authenticated documentation links to audited SEC database reports for LAND.

SEC EDGAR Live Feed
Loading financial data and tables...
πŸ“

SEC Filings (LAND)

Β© 2026 Stock Market Info β€” Gladstone Land Corporation (LAND) Financial Profile