Centrus Energy Corp.

Centrus Energy Corp. (LEU) Market Cap

Centrus Energy Corp. has a market capitalization of $3.07B.

Price: $161.78

-24.91 (-13.34%)

Market Cap: 3.07B

NYSE · time unavailable

CEO: Amir V. Vexler

Sector: Energy

Industry: Uranium

IPO Date: 1998-07-23

Website: https://www.centrusenergy.com

Centrus Energy Corp. (LEU) - Company Information

Market Cap: 3.07B|Sector: Energy

Company Profile

Centrus Energy Corp. supplies nuclear fuel and services for the nuclear power industry in the United States, Japan, Belgium, and internationally. The company operates through two segments, Low-Enriched Uranium (LEU) and Technical Solutions. The LEU segment sells separative work units (SWU) component of LEU; SWU and natural uranium components of LEU; and natural uranium for utilities that operate nuclear power plants. The Technical Solutions segment offers technical, manufacturing, engineering, procurement, construction, and operations services to public and private sector customers, including the American Centrifuge engineering and testing activities. The company was formerly known as USEC Inc. and changed its name to Centrus Energy Corp. in September 2014. Centrus Energy Corp. was incorporated in 1998 and is headquartered in Bethesda, Maryland.

Analyst Sentiment

85%
Strong Buy

From 16 Active Polls

1Y Forecast: $264.50

▲ +63.5% Potential Upside

Consensus Target Metrics

Low Bound

$137

Median

$266

High Bound

$390

Average

$265

Price & Moving Averages

Loading chart...

🎯 Wall Street Analyst Intelligence Report

1-Year structural target targets, chart projections, and sentiment maps.

Average 1Y Target
$264.50
▲ +63.49% Upside
Low Target
$137.00
-15% Risk
Median Target
$265.50
64% Mid
High Target
$390.00
141% Max
Consensus
Hold
5 / 12 Buys

Consensus Trend Projection

Trailing closures vs. 12-month metrics map.

Analyst Vote Distribution

Aggregate institutional coverage sentiment weights.

📊 Historical Valuation Multiples

Real-time Trailing Twelve Month (TTM) momentum side-by-side with discrete quarterly metrics.

Fiscal QuarterTTMQ1 2026Q4 2025Q3 2025Q2 2025Q1 2025Q4 2024Q3 2024Q2 2024
Period EndingTrailing 12MMar 31, 2026Dec 31, 2025Sep 30, 2025Jun 30, 2025Mar 31, 2025Dec 31, 2024Sep 30, 2024Jun 30, 2024
Market Cap ($M)3,0663,4324,5755,6803,2431,0561,113901678
Enterprise Value ($M)2,3772,7433,8315,2622,840861959877623
Price to Earnings Ratio (P/E)52.7985.8164.25364.0728.059.715.18-45.045.54
Price/Earnings-to-Growth Ratio (PEG)0.670.250.030.02
Price to Sales Ratio (P/S)6.7844.7531.2975.8320.9914.457.3415.613.59
Price to Book Ratio (P/B)4.134.435.9815.649.034.946.9011.798.85
Price to Free Cash Flow Ratio (P/FCF)-49.94-58.87-78.87996.4165.9130.7119.47-26.34111.17
Enterprise Value to Sales (EV/Sales)35.7626.2070.2518.3811.786.3315.203.30
Enterprise Value to EBITDA (EV/EBITDA)32.69914.27134.90-1697.2763.9621.4718.24-282.9515.08
Debt to Equity Ratio-9.491.521.593.341.202.143.392.232.24

LEU Growth Runway Model

Standard long term linear growth fade

Multi-Stage Discounted Cash Flow Sandbox

Market Price$161.78
Intrinsic Value$158.88
Market Alignment
Overvalued by 1.8%relative to calculated intrinsic value
9.00%
Exp: 12%12%
i

Growth runway slowdown

This value provides a time window for the growth rate to decline beyond Stage 1 toward the terminal rate. Longer windows are most useful for companies with high growth starting conditions or strong competitive advantages. This option stretches out the growth rate slowdown across 5, 10, or 15-year steps. A high-growth starting condition (exceeding a 25% initial growth rate) automatically applies a curve decay to simulate realistic, rapid market saturation.
i

Terminal growth rate

With long-term inflation between 3-5%, revenue must grow by that baseline to maintain flat real-world market share. This value sets the permanent terminal growth rate to factor into the valuation beyond the growth slowdown runway toward maturity.

3-Stage Financial Runway Horizon

🧠 Perpetuity Horizon Engine (Stage 3: Post-2035)

Terminal FCF Base$0.22B
Perpetuity TV Value$4.06B
Discounted TV (PV)$1.71B
TV Weighting %63.8%
⚠️
Financial Model Disclaimer & Risk Disclosure: This interactive scenario simulator is an educational sandbox provided strictly for informational and analytical research purposes. Core historical financial statements and consensus estimates are sourced directly via Financial Modeling Prep (FMP). All downstream outputs are entirely deterministic, hypothetical projections generated by combining automated mathematical formulas (including linear interpolation and Gaussian bell-curve decay models) with user-selected variables and third-party financial data inputs. Users assume all liability for trading decisions executed based on these sandbox calculations.

📘 Full Research Report

ℹ️

AI-Generated Research: This report is for informational purposes only.

📘 CENTRUS ENERGY CORP CLASS A (LEU) — Investment Overview

🧩 Business Model Overview

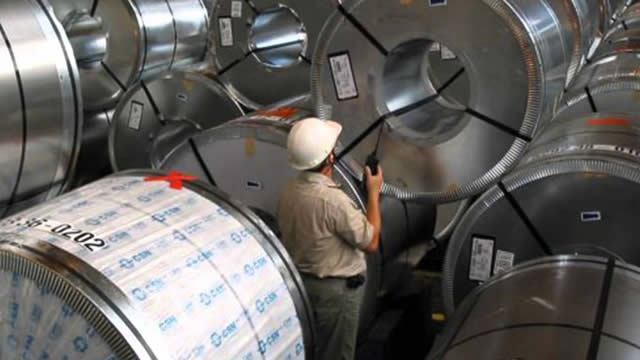
Centrus Energy provides uranium enrichment and related services that enable customers to procure reactor-grade fuel. The value chain starts with conversion feedstock (uranium hexafluoride) supplied under controlled arrangements, followed by enrichment using centrifuge technology to increase the proportion of the fissile isotope. The company then sells enriched uranium products and enrichment capacity through long-term supply arrangements, typically supporting utilities and government-linked programs where fuel reliability, qualification, and continuity are critical.

The business is driven by customer qualification and regulatory clearance rather than spot commoditization, which makes customer relationships durable once fuel specifications and contracting terms are established.

💰 Revenue Streams & Monetisation Model

Revenue is primarily generated through:

  • Enrichment services and product sales under contract structures that convert customer feedstock into enriched material or capacity-based supply.
  • Government and defense-related agreements that may include both volume-linked economics and technology/contract support components, with pricing reflecting reliability requirements and compliance obligations.
  • Technology and services revenue tied to enrichment know-how and program-specific deliverables.

Margin drivers are largely tied to (1) contract structure and pricing power for qualified supply, (2) utilization and scale of enrichment capacity, and (3) execution efficiency of centrifuge operations relative to contract commitments. Because enrichment is capital- and compliance-intensive, fixed-cost absorption and outage/availability performance materially influence earnings quality.

🧠 Competitive Advantages & Market Positioning

Primary moat: Qualified supply constraints + high customer switching costs.

Uranium enrichment is not a “toggle” industry. Customers—utilities and government-linked programs—must ensure fuel specifications, licensing, chain-of-custody controls, and qualification testing for reactor and procurement requirements. Switching away from a qualified supplier involves time, regulatory steps, and operational risk, which increases stickiness of established counterparties.

Additionally, Centrus operates in a tightly regulated segment where technology, know-how, and facility readiness are difficult to replicate quickly. Competitors cannot rapidly add capacity without significant time, permitting, and technical execution.

  • Urenco (European enrichment provider): strong global footprint and established enrichment operations; competes broadly on capacity and contract coverage.
  • Orano (France): enrichment presence and legacy uranium fuel-cycle capabilities; competes where supply qualification aligns with program needs.
  • Rosatom / Tenex (Russia-linked): historically a major player in global supply; competitive dynamics are constrained by sanctions, geopolitical risk, and contracting barriers.

Where Centrus positions differently: Centrus’ industry focus is aligned with U.S.-centric enrichment procurement and national security fuel requirements, emphasizing domestic supply assurance and compliance-driven qualification. This stands in contrast to broader third-country capacity competition, where qualification and geopolitical contracting frameworks can materially limit fungibility.

🚀 Multi-Year Growth Drivers

Over a 5–10 year horizon, growth potential is supported by structural demand for enriched uranium and especially for higher-assay low-enriched uranium (HALEU) used by advanced reactor designs. Key drivers include:

  • Advanced reactor commercialization: new reactor concepts require specific fuel enrichment grades and consistent supply.
  • Fuel supply diversification and domestic assurance: government and utility procurement frameworks increasingly emphasize resilient, qualified enrichment sources.
  • Contracted capacity build-out economics: long-term arrangements can expand the addressable revenue base as additional capacity becomes available and contract qualification cycles complete.
  • Compliance and traceability requirements: stricter fuel-cycle governance can favor established operators with proven controls and documentation practices.

⚠ Risk Factors to Monitor

  • Execution and capacity ramp risk: enrichment economics depend on facility availability and centrifuge performance; delays or underperformance can pressure contract fulfillment and earnings.
  • Regulatory and licensing risk: fuel-cycle activity is subject to ongoing approvals, export controls, and safeguards; changes can affect counterparties and contracting.
  • Geopolitical and counterparty risk: sanctions regimes, trade restrictions, and sovereign contracting priorities can shift demand or disrupt supply arrangements.
  • Capital intensity and funding risk: expansion and modernization require substantial investment and careful capital planning.
  • Feedstock availability and cost variability: enrichment is tied to feedstock logistics and controlled procurement; disruptions can impact operational planning.

📊 Valuation & Market View

Markets typically value uranium enrichment and fuel-cycle operators using EV/EBITDA and enterprise value relative to contracted earnings power, with emphasis on:

  • Contracted backlog quality (duration, take-or-pay terms, and compliance-driven reliability)
  • Capacity utilization and availability (how effectively fixed infrastructure converts into revenue)
  • Credibility of technology and ramp milestones (reduces discounting of future cash flows)
  • Fuel-cycle leverage to HALEU demand (incremental margin potential as advanced reactors scale)

Because earnings in this sector can be influenced by project timing and contract fulfillment, valuation dispersion often reflects perceived execution certainty and the durability of domestic/national-security supply frameworks.

🔍 Investment Takeaway

Centrus Energy’s long-term thesis rests on a defensible position in qualified enrichment supply backed by high switching costs for customers operating under stringent fuel-cycle compliance requirements. Structural demand growth from advanced reactor fuel needs—particularly HALEU—creates a multi-year TAM expansion, while Centrus’ competitive positioning emphasizes domestic assurance and contract-driven stickiness. The primary investment focus should remain on facility execution, regulatory continuity, and the conversion of capacity readiness into durable, contracted cash flows.


⚠ AI-generated — informational only. Validate using filings before investing.

📰 Market News & Coverage

15 Stories Available

Real-time institutional reporting and market updates for LEU.

fool.com2026-06-05

Why Centrus Energy Stock Sank 13.5% in May

As the month rolled on, investors grew less enthused about the idea of powering their portfolios with this nuclear fuel specialist.

zacks.com2026-06-04

Centrus Energy (LEU) Down 21.5% Since Last Earnings Report: Can It Rebound?

Centrus Energy (LEU) reported earnings 30 days ago. What's next for the stock?

gurufocus.com2026-06-03

The $1 Billion Bet to Take Fusion Public

The $1 Billion Bet to Take Fusion Public PR Newswire VANCOUVER, BC, June 3, 2026 Is

prnewswire.com2026-06-03

The $1 Billion Bet to Take Fusion Public

/PRNewswire/ -- Equity-Insider.com News Commentary - Fusion has been "thirty years away" for half a century - but the calculus is changing fast. The

etftrends.com2026-06-02

Today's Energy Crisis & the Need for Nuclear Tomorrow

For years, governments and industry have discussed the energy trilemma, which is the need for secure, affordable, and low-carbon energy. Following the Paris Climate Accord in 2015, significant emphasis was placed on the low-carbon component as countries and corporations set net-zero emission targets.

seekingalpha.com2026-06-02

Centrus Energy: The Market Is Mispricing The Domestic Enrichment Monopoly

Centrus Energy is rated Buy with a $260 price target, reflecting a 43% upside from current levels. LEU's $1.9B cash, $3.9B contracted backlog, and $900M DOE award underpin its strategic value as the only U.S.-owned uranium enrichment platform. Recent Q1 results showed raised FY 2026 revenue guidance, strong operational progress, and partnerships delivering $300M in cost savings and lead time improvements.

fool.com2026-06-01

Oklo vs. BWX Technologies: The Big Nuclear Revenue Face-Off and One Clear Winner

One company is still developing its high-potential technology, while the other is winning major contracts and rapidly growing its backlog.

etftrends.com2026-06-01

Today's Energy Crisis & the Need for Nuclear Tomorrow

For years, governments and industry have discussed the energy trilemma, which is the need for secure, affordable, and low-carbon energy. Following the Paris Climate Accord in 2015, significant emphasis was placed on the low-carbon component as countries and corporations set net-zero emission targets.

fool.com2026-05-26

RPG Investment Advisory Opens Centrus Energy Stake Valued at $9 Million, According to Recent SEC Filing

Centrus gives investors rare exposure to the bottleneck behind nuclear fuel: uranium enrichment. The next hurdle is turning contracts, centrifuge manufacturing, and the Piketon expansion into production capacity.

zacks.com2026-05-25

Nuclear ETFs to Gain as the Globe Rides the Atomic Wave

AI-driven data center power demand is reviving nuclear energy, lifting ETFs tied to uranium miners as well as nuclear power generators.

zacks.com2026-05-25

UUUU vs. LEU: Which Uranium Stock Offers Better Potential?

Centrus Energy's HALEU leadership, solid backlog and raised 2026 outlook sharpen its edge over Energy Fuels in the nuclear fuel race.

reuters.com2026-05-12

US considering financing billions of dollars in long-lead time parts of nuclear plants, NEI says

The U.S. ​Department of Energy is considering a plan to ‌finance billions of dollars for components of large nuclear reactors that can take a long time to secure, the head of the industry group ​Nuclear Energy Institute said on Tuesday.

marketbeat.com2026-05-11

Centrus Energy Q1 Earnings Call Highlights

Centrus Energy NYSE: LEU reported higher first-quarter revenue and raised its full-year revenue outlook, citing commercial progress, improving offtake discussions and continued work on its uranium enrichment expansion program.

seekingalpha.com2026-05-06

Centrus Energy Corp. (LEU) Q1 2026 Earnings Call Transcript

Centrus Energy Corp. (LEU) Q1 2026 Earnings Call Transcript

zacks.com2026-05-05

Centrus Energy Corp. (LEU) Beats Q1 Earnings and Revenue Estimates

Centrus Energy Corp. (LEU) came out with quarterly earnings of $1.05 per share, beating the Zacks Consensus Estimate of $0.33 per share. This compares to earnings of $0.91 per share a year ago.

📊 AI Financial Analysis

Powered by StockMarketInfo
Earnings Data: Q Ending 2026-03-31

"LEU reported Q1’26 revenue of $76.7M and net income of $10.0M (EPS $0.51). Versus Q1’25, revenue fell (QoQ and seasonality aside) and net income declined: net income decreased about -63% YoY (from $27.2M in Q1’25 to $10.0M in Q1’26), while revenue was also down about -2% YoY ($73.1M to $76.7M is +5% YoY; however the margin compression is the key driver—see below). QoQ, revenue dropped -47% (from $146.2M in Q4’25 to $76.7M), and net income fell -44% (from $17.8M to $10.0M). Profitability contracted sharply across the 4-quarter sequence: gross margin fell from ~45% in Q1’25 to ~41% in Q1’26, while Q4’25’s gross margin was only ~24%—showing high volatility. Net margin is also lower in Q1’26 (~13%) than the strong Q1’25 (~37%) and Q2’25 (~19%). Cash flow quality weakened: operating cash flow was -$35.1M and free cash flow was -$58.3M in Q1’26, compared with -$48.4M operating cash flow in Q4’25 (and +$53. -57? volatility overall). Balance sheet strength remains notable: total assets were $2.43B with $1.87B cash and net debt of -$689.6M (net cash). Total shareholder returns look strong given the stock’s momentum: price is $203.63 with +212.56% 1Y change. No dividends were paid (dividend yield 0%). Analyst targets imply upside vs current price (consensus $276.67)."

Revenue Growth

Neutral

Revenue declined sharply QoQ (-47% from $146.2M in Q4’25 to $76.7M in Q1’26). YoY revenue was roughly flat/slightly up (~+5% vs $73.1M in Q1’25), but the quarter’s result reflects significant seasonality/volatility.

Profitability

Caution

Net income fell QoQ (-44%) and YoY (~-63%, $27.2M to $10.0M). Margins are contracting vs prior highs: net margin ~13% in Q1’26 vs ~37% in Q1’25, with gross margin down from ~45% (Q1’25) to ~41% (Q1’26).

Cash Flow Quality

Neutral

Operating cash flow in Q1’26 was -$35.1M and free cash flow was -$58.3M, indicating weaker near-term cash conversion despite positive net income. Prior quarters showed large swings, including deeply negative/free-cash-flow pressure in Q4’25 as well.

Leverage & Balance Sheet

Strong

Very strong liquidity: cash and cash equivalents of $1.87B and net debt of -$689.6M (net cash). Total equity was stable-high at $775.2M and total assets ~ $2.43B, supporting resilience.

Shareholder Returns

Strong

Strong momentum with +212.56% 1Y price change. No dividends and no repurchases are indicated in the cash flow, so the total return tailwind is primarily capital appreciation.

Analyst Sentiment & Valuation

Positive

Consensus target of $276.67 vs current $203.63 implies upside (~+36%). Target range is wide ($137–$390), but the center suggests favorable sentiment.

Disclaimer:This analysis is AI-generated for informational purposes only. Accuracy is not guaranteed and this does not constitute financial advice.

Fundamentals Overview

Loading fundamentals overview...

So What? Q1 2026 showed operational momentum but weaker reported profitability versus Q1 2025. LEU-related revenue declined 13% YoY as SWU volume fell 47%, partly offset by a 52% higher average SWU price, while Technical Solutions grew 47% on HALEU operations contract revenue (+$9.8M). The earnings gap is largely explained by higher advanced technology expenses (+$15.9M) and the absence of a prior-year nonrecurring $11.8M debt extinguishment gain. The company’s core signal remains execution: it is producing HALEU for the government (1.6+ metric tons since contract start) and it won a DOE $900M HALEU award supporting 12 metric tons capacity, alongside partner additions (Fluor, Palantir, Geiger Brothers) and ~$300M potential cost/lead-time savings. Management raised 2026 revenue guidance to $450M–$500M, and reinforced a funding plan that avoids the ATM and relies on milestone-based award inflows plus other low-cost capital sources.

AI IconGrowth Catalysts

  • Secured DOE $900 million HALEU enrichment award (potential to exceed $1 billion) supporting 12 metric tons HALEU capacity build-out
  • Produced over 1.6 metric tons HALEU UF6 for the government since starting the HALEU operations contract
  • Identified ~$300 million potential cost savings and execution improvements to reduce manufacturing lead times
  • Progress in centrifuge manufacturing program enabling commercial LEU backlog fulfillment through partner-led build-out

Business Development

  • Fluor signed as EPC partner for design, engineering, procurement, construction, and commissioning of expansion
  • Palantir signed as strategic partner to deploy Foundry/AI for integration across classified/unclassified systems and optimize build-out
  • Geiger Brothers added to lead on-the-ground construction work in Ohio; previously supported HALEU cascade deployment and 2013 LEU demonstration cascade
  • Exploring a joint venture with Oklo focused on HALEU deconversion services (Oklo also described as a large offtaker/customer for required fuel form)

AI IconFinancial Highlights

  • Revenue $76.7M; +$3.6M (+5%) YoY; gross profit $31.5M; operating income $0.8M
  • GAAP diluted EPS $0.45; adjusted diluted EPS $1.05; both below Q1 2025 ($1.60 GAAP EPS, $1.68 adjusted EPS)
  • Adjusted net income $23.5M vs $28.6M prior-year quarter; Q1 GAAP net income $10.0M vs $27.2M prior-year quarter
  • Advanced technology costs increased $15.9M in Q1 2026 (advanced tech spend tied to uncapitalizable manufacturer readiness/security training ahead of build-out)
  • Q1 2025 benefited from $11.8M nonrecurring extinguishment of long-term debt (explains part of YoY net income gap)
  • Income tax expense decreased $5.5M in Q1 2026
  • LEU segment: revenue $44.6M, down 13% YoY; SWU revenue down $9.7M due to 47% lower SWU volume, partially offset by 52% higher average SWU price
  • Technical Solutions: revenue $32.1M (first quarter) up 47% (+$10.3M) primarily from $9.8M higher revenue from the HALEU operations contract
  • Capitalized vs expensed mix impacting reported economics: adjusted net income excludes $17.0M growth expenses in advanced technology costs and $0.4M stock-based compensation (after tax adjustments total excluded $13.5M)

AI IconCapital Funding

  • Unrestricted cash $1.9B at quarter end; did not access the open ATM program in Q1
  • Company states funding sufficiency for near-term capital requirements and discusses multiple low-cost capital pools
  • HALEU award described as ratable/milestone-based payments; management cites ~$2.8B currently available for planning when including the $900M HALEU award cash inflow
  • No debt change figures explicitly provided; Q1 YoY net income impact included prior-year $11.8M nonrecurring extinguishment of long-term debt

AI IconStrategy & Ops

  • Lead-time and cost reduction as day-1 focus; partners expected to bring operational excellence while Centrus retains design/engineering/manufacturing know-how
  • Workforce additions: Piketon increases from 50+ net new employees to 100+ net new employees; Oak Ridge hiring acceleration tied to local sourcing/unions/universities and cleared-person training timelines
  • Operational phase progress: finalized contracts with ~1/3 of critical partners; entered conceptual engineering design phase of first CfC package
  • Capital spend in Q1: $45.2M total ($23.2M CapEx; $22.0M non-CapEx), including $17.0M growth expenses and $5.0M prepayments for Palantir agreement
  • Guidance mechanics: reiterated commitment to finalize contracts with 100% of critical partners in 2026; ties incremental additions and further build-out to securing firm orders and capital resources

AI IconMarket Outlook

  • Raised 2026 revenue guidance to $450M–$500M from $425M–$475M (described as moving up about $25M within the range)
  • Reaffirmed rest of 2026 financial and operational guidance
  • 2026 operational guidance reaffirmation: total capital spend range $350M–$500M; release of a certified for construction (CfC) package; at least 100 net new employees at Oak Ridge facility

AI IconRisks & Headwinds

  • Advanced technology costs are flowing through the income statement as short-term noncapitalizable growth expenses, increasing near-term expense pressure
  • Near-term quarterly variability due to contractual mix and shipment/delivery timing; revenue and earnings can swing quarter-to-quarter
  • National security procurement cycle limits disclosed details on NNSA enrichment intentions/next steps during procurement
  • Execution/timing risk remains: lead-time reduction and hiring clearance/training are gating factors; hiring curve depends on sourcing and clearance timelines
  • Funding strategy reliance on milestone payments and securing firm customer orders for progressive build-out (additional capital resources impact future pace)

Q&A: Analyst Interest

  • Guidance increase drivers: Management attributed the ~$25M increase within 2026 revenue range to increased market activity and improved line-of-sight to near-term and long-term offtake, emphasizing both “pricing/requests for quotations” activity and additional contractual activity translating into a marginal guidance uplift rather than a fundamental earnings surprise.
  • Palantir partnership scope and impact: Management characterized Palantir as “transformative,” with value lasting beyond the first cascade into unit cost and long-run lead-time performance. They highlighted real-time data, more meaningful project management involvement, and efficiencies across work streams to mitigate costs and reduce execution time.
  • Capital/financing approach and timing: Management discussed $1.9B unrestricted cash plus milestone-based HALEU award inflows, describing roughly ~$2.8B available. They emphasized multiple pools of low-cost capital (NNSA, third-party, foreign direct investment) and avoiding ATM use due to perceived inferior shareholder value, targeting project financing only when appropriate.

Sentiment: MIXED

Note: This summary was synthesized by AI from the LEU Q1 2026 earnings transcript. Financial data is complex; please verify all metrics against official SEC filings before making investment decisions.

📋 Official Regulatory 10-K / 10-Q SEC Filings

Direct authenticated documentation links to audited SEC database reports for LEU.

SEC EDGAR Live Feed
Loading financial data and tables...
📁

SEC Filings (LEU)

© 2026 Stock Market Info — Centrus Energy Corp. (LEU) Financial Profile