Southern Copper Corporation

Southern Copper Corporation (SCCO) Market Cap

Southern Copper Corporation has a market capitalization of $144.31B.

Price: $172.97

-21.12 (-10.88%)

Market Cap: 144.31B

NYSE · time unavailable

CEO: Raul Jacob Ruisanchez

Sector: Basic Materials

Industry: Copper

IPO Date: 1996-01-05

Website: https://southerncoppercorp.com

Southern Copper Corporation (SCCO) - Company Information

Market Cap: 144.31B|Sector: Basic Materials

Company Profile

Southern Copper Corporation engages in mining, exploring, smelting, and refining copper and other minerals in Peru, Mexico, Argentina, Ecuador, and Chile. The company is involved in the mining, milling, and flotation of copper ore to produce copper and molybdenum concentrates; smelting of copper concentrates to produce blister and anode copper; refining of anode copper to produce copper cathodes; production of molybdenum concentrate and sulfuric acid; production of refined silver, gold, and other materials; and mining and processing of zinc and lead. It operates the Toquepala and Cuajone open-pit mines, and a smelter and refinery in Peru; and La Caridad, an open-pit copper mine, as well as a copper ore concentrator, a SX-EW plant, a smelter, refinery, and a rod plant in Mexico. The company also operates Buenavista, an open-pit copper mine, as well as two copper concentrators and two operating SX-EW plants in Mexico. In addition, it operates five underground mines that produce zinc, lead, copper, silver, and gold; a coal mine that produces coal and coke; and a zinc refinery. The company has interests in 82,134 hectares of exploration concessions in Peru; 493,533 hectares of exploration concessions in Mexico; 246,346 hectares of exploration concessions in Argentina; 29,888 hectares of exploration concessions in Chile; and 7,299 hectares of exploration concessions in Ecuador. Southern Copper Corporation was incorporated in 1952 and is based in Phoenix, Arizona. Southern Copper Corporation operates as a subsidiary of Americas Mining Corporation.

Analyst Sentiment

13%
Underperform

From 17 Active Polls

1Y Forecast: $156.17

▼ -9.7% Potential Upside

Consensus Target Metrics

Low Bound

$135

Median

$154

High Bound

$178

Average

$156

Price & Moving Averages

Loading chart...

🎯 Wall Street Analyst Intelligence Report

1-Year structural target targets, chart projections, and sentiment maps.

Average 1Y Target
$156.17
▼ -9.71% Upside
Low Target
$135.00
-22% Risk
Median Target
$154.00
-11% Mid
High Target
$178.00
3% Max
Consensus
Hold
3 / 30 Buys

Consensus Trend Projection

Trailing closures vs. 12-month metrics map.

Analyst Vote Distribution

Aggregate institutional coverage sentiment weights.

📊 Historical Valuation Multiples

Real-time Trailing Twelve Month (TTM) momentum side-by-side with discrete quarterly metrics.

Fiscal QuarterTTMQ1 2026Q4 2025Q3 2025Q2 2025Q1 2025Q4 2024Q3 2024Q2 2024
Period EndingTrailing 12MMar 31, 2026Dec 31, 2025Sep 30, 2025Jun 30, 2025Mar 31, 2025Dec 31, 2024Sep 30, 2024Jun 30, 2024
Market Cap ($M)144,313141,382120,25799,83180,90972,60969,86187,04381,738
Enterprise Value ($M)146,800143,868123,365103,31485,02376,46073,60191,37086,865
Price to Earnings Ratio (P/E)28.5922.3522.9922.5320.7819.1922.0024.2721.51
Price/Earnings-to-Growth Ratio (PEG)2.271.582.111.581.08
Price to Sales Ratio (P/S)9.9233.2631.0829.5626.5223.2625.0929.7026.21
Price to Book Ratio (P/B)12.0611.9910.899.558.107.597.629.769.62
Price to Free Cash Flow Ratio (P/FCF)33.75112.87112.2182.48109.17179.9062.0972.96129.68
Enterprise Value to Sales (EV/Sales)33.8431.8830.5927.8724.4926.4331.1727.86
Enterprise Value to EBITDA (EV/EBITDA)16.4553.1752.5351.0646.1142.6147.6153.0347.64
Debt to Equity Ratio0.280.630.670.710.750.830.760.780.82

SCCO Growth Runway Model

Standard long term linear growth fade

Multi-Stage Discounted Cash Flow Sandbox

Market Price$172.97
Intrinsic Value$97.26
Market Alignment
Overvalued by 43.8%relative to calculated intrinsic value
9.00%
Exp: 6%6%
i

Growth runway slowdown

This value provides a time window for the growth rate to decline beyond Stage 1 toward the terminal rate. Longer windows are most useful for companies with high growth starting conditions or strong competitive advantages. This option stretches out the growth rate slowdown across 5, 10, or 15-year steps. A high-growth starting condition (exceeding a 25% initial growth rate) automatically applies a curve decay to simulate realistic, rapid market saturation.
i

Terminal growth rate

With long-term inflation between 3-5%, revenue must grow by that baseline to maintain flat real-world market share. This value sets the permanent terminal growth rate to factor into the valuation beyond the growth slowdown runway toward maturity.

3-Stage Financial Runway Horizon

🧠 Perpetuity Horizon Engine (Stage 3: Post-2035)

Terminal FCF Base$6.18B
Perpetuity TV Value$116.32B
Discounted TV (PV)$49.13B
TV Weighting %60.9%
⚠️
Financial Model Disclaimer & Risk Disclosure: This interactive scenario simulator is an educational sandbox provided strictly for informational and analytical research purposes. Core historical financial statements and consensus estimates are sourced directly via Financial Modeling Prep (FMP). All downstream outputs are entirely deterministic, hypothetical projections generated by combining automated mathematical formulas (including linear interpolation and Gaussian bell-curve decay models) with user-selected variables and third-party financial data inputs. Users assume all liability for trading decisions executed based on these sandbox calculations.

📘 Full Research Report

ℹ️

AI-Generated Research: This report is for informational purposes only.

📘 SOUTHERN COPPER CORP (SCCO) — Investment Overview

🧩 Business Model Overview

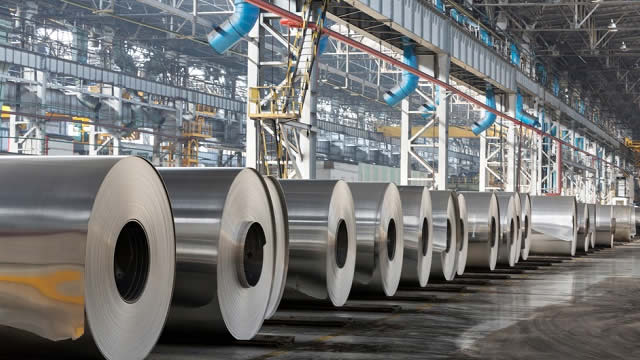
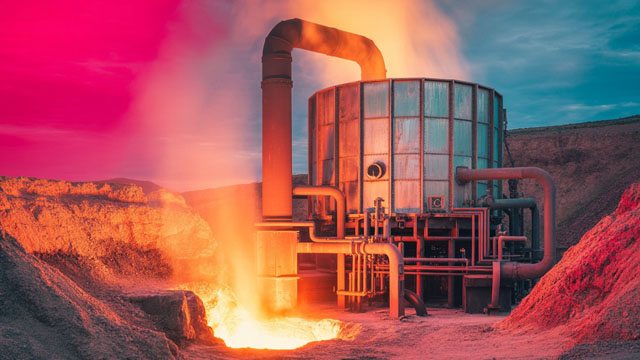
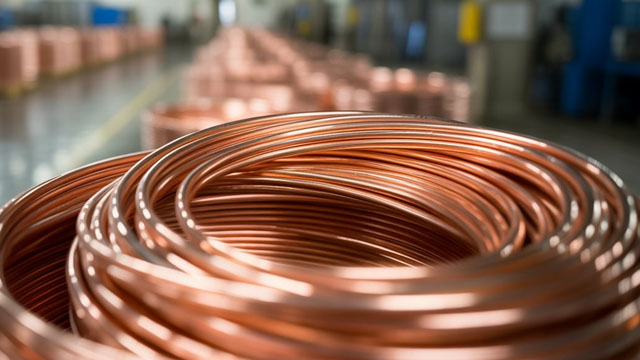
SOUTHERN COPPER CORP is a base-metals producer whose economics are driven by the full value chain from ore extraction to product sale. The company mines copper-bearing ore, processes it into concentrates and/or refined products, and monetizes copper alongside precious/valuable byproducts such as silver (and other metals depending on operations).

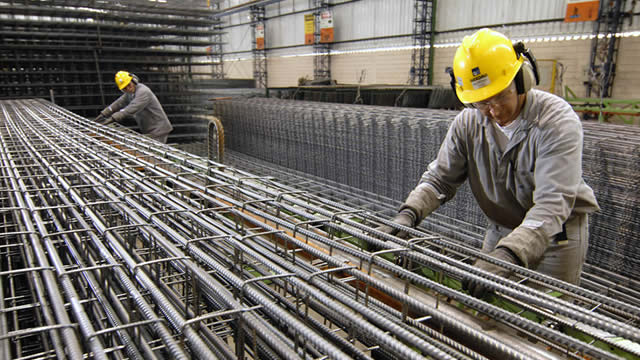
Operationally, SCCO’s “how it works” is shaped by (1) the quality and depth of its ore bodies, (2) the effectiveness of its processing and recovery in producing saleable copper, and (3) the ability to move and treat concentrates/refined output through established smelting and related logistical infrastructure. The more integrated and efficient the route from mine to sale, the more stable margins tend to be versus pure-play, more fragmented producers.

💰 Revenue Streams & Monetisation Model

Revenue is primarily generated from selling copper (often with a portion linked to refined product pricing mechanics and quality differentials). Realization is influenced by the prevailing copper market price and by product attributes (e.g., treatment/raffination terms, concentrate grade, and penalties/discounts).

Margin drivers are more company-specific than revenue drivers. Key monetisation levers include:

  • Cost curve positioning: mining, processing, power, consumables, and labor intensity determine cash cost competitiveness.
  • Byproduct credits: silver and other metal credits can materially reduce net cost per pound of copper.
  • Processing and logistics efficiency: the operational continuity of ore processing and the ability to supply feedstock to smelting/refining routes reduces downtime and loss of output.

This structure tends to create a business where revenue is more cyclical (copper price-linked), while profitability depends heavily on operational execution and net cost discipline.

🧠 Competitive Advantages & Market Positioning

SCCO’s principal moat is a geographic and logistical cost advantage paired with operational integration. Copper mining is capital-intensive and subject to persistent cost and execution risk; therefore, competitors with comparable grade and jurisdictional access but weaker logistics and higher unit costs generally underperform through cycles.

  • Low-cost feedstock and ore quality discipline: SCCO benefits from mine planning and ore access within its operating footprint, supporting strong recovery and net cost performance relative to higher-cost peers.
  • Logistical infrastructure and process integration: The company’s ability to convert mined material into saleable products through established processing routes reduces reliance on external bottlenecks and can improve output stability.
  • Scale effects in procurement and operations: Operating within established supply chains and maintenance regimes supports cost control and continuity of throughput.

Competitive benchmarking (industry peers):

  • Freeport-McMoRan (FCX): broad copper exposure across different jurisdictions and asset types; SCCO’s advantage is more tied to its specific operating geography and integrated processing routes.
  • BHP (BHP): diversified metals exposure with varying cost structures and scale across a global portfolio; SCCO competes primarily on copper concentration and unit cost discipline within its operating base.
  • Antofagasta (ANTO): focused copper producer with Chile-based exposure; SCCO’s positioning emphasizes geographic/logistical execution within Mexico/Peru footprints rather than a single-country coastal network.

Against these rivals, SCCO’s differentiation is less about marketing or brand and more about sustaining a favorable cost curve through operational integration and geography-relevant infrastructure.

🚀 Multi-Year Growth Drivers

Over a 5–10 year horizon, SCCO’s growth outlook is anchored less in “demand creation” and more in the gap between copper supply availability and incremental demand from electrification. The investment case typically rests on three durable drivers:

  • Supply constraint and depleting grades: Industry-wide ore quality declines and the long lead times required for new capacity support the notion that incremental supply is difficult to bring online quickly at low cost.
  • Project execution and life-of-mine value: Growth is supported by sustained capital allocation toward expansions, debottlenecking, and resource life extension—when executed with disciplined cost and schedule outcomes.
  • Byproduct and recovery optimization: Continued process improvements can support net cost reduction through higher recoveries and byproduct credits.

The total addressable market for SCCO is “global copper usage,” but the company competes by earning returns on incremental pounds produced at competitive net costs within its footprint and processing capability.

⚠ Risk Factors to Monitor

  • Commodity price volatility: Copper pricing drives revenue; cost discipline and hedging policy influence how much of price moves flow through to operating cash flow.
  • Regulatory and permitting risk: Mining jurisdictions involve evolving environmental and social requirements that can affect operating licenses, water use, tailings management, and project timelines.
  • Energy and input cost inflation: Power costs, fuel, chemicals, and consumables can pressure unit costs, especially during periods of tight supply.
  • Operational and logistical disruptions: Any disruption to processing continuity, concentrate handling, or transportation links can reduce sellable output and raise costs.
  • FX and sovereign-related considerations: With cross-border operations, currency movements and local political risk can influence cash costs and capital deployment.

📊 Valuation & Market View

The market typically values copper miners using a blend of metrics that emphasize cash-generation under the commodity cycle, commonly EV/EBITDA and enterprise value versus expected free cash flow. For SCCO, valuation sensitivity is concentrated in:

  • Net cost position: sustained competitive cost curves typically justify higher multiples because they protect margins through downturns.
  • Reserve quality and mine-life visibility: clearer life-of-mine economics can reduce perceived risk and support longer-duration cash flow expectations.
  • Jurisdictional and execution risk: investors apply a discount when regulatory or operational risk increases expected volatility of output or cash costs.
  • Capital intensity and project discipline: the market rewards projects with credible returns and penalizes schedule/cost overruns.

In copper equities, valuation often moves as much with expectations for sustainable unit costs and project execution as with broad commodity sentiment.

🔍 Investment Takeaway

SCCO’s long-term investment appeal rests on an operational and geographic advantage: competitive net cost generation supported by integrated mine-to-processing capability and established logistical routes. In a market where supply growth is constrained and incremental copper often comes with higher marginal cost, SCCO is positioned to defend margins through cycles—provided regulatory stability, cost control, and capital discipline remain intact.


⚠ AI-generated — informational only. Validate using filings before investing.

📰 Market News & Coverage

15 Stories Available

Real-time institutional reporting and market updates for SCCO.

zacks.com2026-06-05

Why Southern Copper (SCCO) is a Top Growth Stock for the Long-Term

The Zacks Style Scores offers investors a way to easily find top-rated stocks based on their investing style. Here's why you should take advantage.

zacks.com2026-06-04

Why Southern Copper (SCCO) is a Top Momentum Stock for the Long-Term

Whether you're a value, growth, or momentum investor, finding strong stocks becomes easier with the Zacks Style Scores, a top feature of the Zacks Premium research service.

gurufocus.com2026-06-02

SCCO Fairly Valued by DCF at $185

On June 02, 2026, we delve into the DCF analysis for Southern Copper Corp (SCCO), a company that has shown impressive price performance recently. Over the past

247wallst.com2026-06-01

“Demand for Data Center Power Continues to Outpace Expectations” — Josh Brown's Case for Heavy Assets Over AI Hype

Josh Brown, CEO of Ritholtz Wealth Management and a fixture on CNBC's Halftime Report, has built a new ETF around a simple idea: own the businesses that artificial intelligence cannot replace.

gurufocus.com2026-05-28

Is Southern Copper Corp (SCCO) Overvalued After 3.8% Rally? GF Value Says Overvalued

On May 28, 2026, Southern Copper Corp (SCCO) shares rose 3.8% to a current price of $194.88. The stock has experienced significant price movements, trading with

zacks.com2026-05-21

FCX vs. SCCO: Which Copper Mining Giant is a Better Pick Now?

Freeport and Southern Copper push ahead with major projects leveraging strong cash flows and favorable copper prices.

zacks.com2026-05-21

Southern Copper Corporation (SCCO) is Attracting Investor Attention: Here is What You Should Know

Recently, Zacks.com users have been paying close attention to Southern Copper (SCCO). This makes it worthwhile to examine what the stock has in store.

zacks.com2026-05-19

Here's Why Southern Copper (SCCO) is a Strong Growth Stock

Whether you're a value, growth, or momentum investor, finding strong stocks becomes easier with the Zacks Style Scores, a top feature of the Zacks Premium research service.

zacks.com2026-05-14

3 Non-Ferrous Metal Mining Stocks to Watch in a Challenging Industry

Despite the Zacks Mining - Non Ferrous industry's weak near-term outlook, stocks like SCCO, FCX and LUNMF are worth keeping an eye on given their growth potential.

zacks.com2026-05-14

Here's Why Southern Copper (SCCO) is a Strong Momentum Stock

The Zacks Style Scores offers investors a way to easily find top-rated stocks based on their investing style. Here's why you should take advantage.

marketwatch.com2026-05-12

Copper prices are now at their highest level on record. AI is only part of the story.

Copper refining now has a Strait of Hormuz problem.

zacks.com2026-05-08

Southern Copper Corporation (SCCO) Is a Trending Stock: Facts to Know Before Betting on It

Southern Copper (SCCO) has received quite a bit of attention from Zacks.com users lately. Therefore, it is wise to be aware of the facts that can impact the stock's prospects.

zacks.com2026-05-01

Why Southern Copper (SCCO) is a Top Growth Stock for the Long-Term

Wondering how to pick strong, market-beating stocks for your investment portfolio? Look no further than the Zacks Style Scores.

zacks.com2026-04-29

Southern Copper (SCCO) Q1 Earnings Beat Estimates

Southern Copper (SCCO) came out with quarterly earnings of $1.92 per share, beating the Zacks Consensus Estimate of $1.77 per share. This compares to earnings of $1.19 per share a year ago.

zacks.com2026-04-28

Analysts Estimate Centrus Energy Corp. (LEU) to Report a Decline in Earnings: What to Look Out for

Centrus Energy (LEU) doesn't possess the right combination of the two key ingredients for a likely earnings beat in its upcoming report. Get prepared with the key expectations.

📊 AI Financial Analysis

Powered by StockMarketInfo
Earnings Data: Q Ending 2026-03-31

"Revenue and EPS (Q1’26): Revenue $4.25B, EPS $1.92, Net Income $1.58B. YoY (Q1’26 vs Q1’25): Revenue +36.1%, Net Income +67.1%. QoQ (Q1’26 vs Q4’25): Revenue +9.8%, Net Income +21.0%. Profitability improved: Q1’26 gross margin expanded to 64.7% (from 62.0% in Q4’25 and 50.2% in Q1’25) and net margin rose to 37.2% (from 33.8% in Q4’25 and 30.3% in Q1’25). Operating income increased to $2.48B, with operating margin up to 58.3%. Cash generation remained strong. Operating cash flow was $1.69B and free cash flow was $1.25B in Q1’26, supporting substantial shareholder payouts. Dividends paid were $819M in the quarter. Balance-sheet resilience is solid for a capital-intensive industrial: total assets rose to $21.9B and equity increased to $11.79B, while net debt improved to $2.49B (down from $3.11B in Q4’25). Shareholder returns were highly positive: the stock is up 129.99% over 1 year, well above the >20% momentum threshold, which materially lifts the total-return view versus the modest dividend yield (~0.58%). Analyst consensus targets are below current price (current ~$194 vs consensus ~$159), implying valuation risk despite strong operating trends."

Revenue Growth

Strong

Q1’26 revenue $4.25B: +9.8% QoQ and +36.1% YoY, with a clear step-up from the prior-year quarters.

Profitability

Strong

Margins expanded: gross margin 64.7% in Q1’26 vs 62.0% (Q4’25) and 50.2% (Q1’25); net margin 37.2% vs 33.8% and 30.3%. EPS $1.92 vs $1.19 a year ago.

Cash Flow Quality

Good

Operating cash flow $1.69B and free cash flow $1.25B in Q1’26. Large dividend payments ($819M) appear supported by earnings/cash generation; no buybacks shown in provided cash flow.

Leverage & Balance Sheet

Good

Balance sheet strengthened: total assets $21.9B and equity $11.79B. Net debt improved to $2.49B from $3.11B in Q4’25, indicating improving leverage resilience.

Shareholder Returns

Excellent

Total shareholder return is strongly positive given 1Y price momentum of +129.99% (well >20% threshold). Dividend yield is low (~0.58%) but the price appreciation dominates.

Analyst Sentiment & Valuation

Neutral

Consensus target (~$159) is below current (~$194), suggesting expectations may be optimistic relative to valuation, despite strong quarter results.

Disclaimer:This analysis is AI-generated for informational purposes only. Accuracy is not guaranteed and this does not constitute financial advice.

Fundamentals Overview

Loading fundamentals overview...

SCCO delivered record FY25 sales, EBITDA, and earnings on stronger copper and by-product prices and higher by-product volumes, with margins expanding and cash generation solid. Management guides to a 2026 copper production decline due to lower grades in Peru but expects relatively flat unit operating costs aided by robust by-product credits. The project pipeline is progressing, notably Tia Maria at 24% completion, while the copper market backdrop is supportive with an expected 2026 deficit. Cost pressures from currency appreciation and social/security issues at Los Chancas temper the otherwise positive results and outlook.

Growth

  • Record FY25 net sales $13.4B (+17% YoY), adjusted EBITDA $7.8B (+22% YoY; 58% margin), and net income $4.3B (+28% YoY; 32% margin)
  • Q4 sales $3.9B (+$1.1B YoY); adjusted EBITDA $2.3B (+53% YoY; 60% margin); net income $1.04B (+65% YoY; 34% margin)
  • By-product volumes up in 2025: zinc +36%, silver +15%, molybdenum +7.4%
  • Copper prices up: LME +21% YoY and COMEX +22% in Q4; silver price +74% YoY in Q4; moly +5%; zinc +4.3%

Business Development

  • Tia Maria (Peru): $1.8B budget; 24% complete by YE25; ~$800M committed; major earthworks, equipment orders, substation and transmission line works underway; operations expected to start in 2027; significant projected fiscal and export contributions; strong local hiring
  • Michiquillay (Peru): Resource review audited per SEC S-K 1300; next to estimate reserves and mine plan; planned 225 kt/y copper; ~$2.5B investment
  • Los Chancas (Peru): Advancing ESG and community programs; progress hindered by illegal miners; engaging authorities to regain control
  • Buenavista zinc concentrator (Mexico): Focused on zinc due to high-grade pocket, boosting zinc and silver output

Financials

  • Q4 copper sales value +39% YoY on 3% higher volume; moly sales +6%, zinc +23%, silver +106% (volume increases across by-products)
  • Q4 operating costs/expenses +$282M (+19% YoY), driven by workers’ participation, purchased copper, inventory consumption, contractors/services; includes $60M ARO one-time adjustment in Mexico; partially offset by lower Peru labor costs
  • Q4 operating cash cost before credits $2.29/lb (Q3: $2.23); after credits $0.52/lb (Q3: $0.42); by-product credits $920M or $1.77/lb
  • FY25 operating cash cost before credits $2.17/lb (FY24: $2.13); after credits $0.58/lb (FY24: $0.89), mainly on higher by-product credits
  • FY25 operating cash flow $4.8B (+8% YoY), partially offset by higher receivables

Capital & Funding

  • Decade-long capex program >$20.5B across Peru and Mexico
  • FY25 capex $1.3B (+29% YoY), ~30% of FY25 net income
  • Dividend declared Jan 22, 2026: $1.00/share cash plus 0.0085 share/share stock dividend; payable Feb 27, 2026 to holders of record Feb 10, 2026

Operations & Strategy

  • Long-term goal: 1.6Mt copper at lowest competitive cost per pound
  • FY25 copper production 956,270 t (-1.8% YoY), ~1% below 2025 plan
  • Q4 copper production 242,172 t (+1.4% q/q) on better grades/recoveries at La Caridad, Toquepala, Cuajone, IMMSA; partially offset by Buenavista
  • 2026 guidance: copper 911,400 t (-4.7% YoY) due to lower grades in Peru; molybdenum 26,000 t; silver 24 Moz (~-2% YoY)
  • Management targeting relatively flat operating cost per pound; strong by-product output to support credits

Market & Outlook

  • Company estimates a 2026 global copper market deficit of ~320,000 t
  • Exchange and bonded copper inventories ~14 days of global demand (Jan 2026)
  • Currency appreciation (MXN, PEN) currently a larger cost driver than local inflation
  • If silver prices remain elevated, silver could become the primary by-product

Risks Or Headwinds

  • Lower ore grades in Peru driving expected 2026 copper output decline
  • Currency appreciation in Mexico and Peru pressuring costs
  • Illegal miners obstructing progress at Los Chancas
  • Q4 cost inflation in workers’ participation, purchased copper, inventory consumption, and contractor services; one-time $60M ARO adjustment

Sentiment: MIXED

Note: This summary was synthesized by AI from the SCCO Q4 2025 earnings transcript. Financial data is complex; please verify all metrics against official SEC filings before making investment decisions.

📋 Official Regulatory 10-K / 10-Q SEC Filings

Direct authenticated documentation links to audited SEC database reports for SCCO.

SEC EDGAR Live Feed
Loading financial data and tables...
📁

SEC Filings (SCCO)

© 2026 Stock Market Info — Southern Copper Corporation (SCCO) Financial Profile