Freeport-McMoRan Inc.

Freeport-McMoRan Inc. (FCX) Market Cap

Freeport-McMoRan Inc. has a market capitalization of $91.10B.

Price: $63.37

-6.32 (-9.07%)

Market Cap: 91.10B

NYSE · time unavailable

CEO: Kathleen Lynne Quirk

Sector: Basic Materials

Industry: Copper

IPO Date: 1995-07-10

Website: https://fcx.com

Freeport-McMoRan Inc. (FCX) - Company Information

Market Cap: 91.10B|Sector: Basic Materials

Company Profile

Freeport-McMoRan Inc. engages in the mining of mineral properties in North America, South America, and Indonesia. The company primarily explores for copper, gold, molybdenum, silver, and other metals, as well as oil and gas. Its assets include the Grasberg minerals district in Indonesia; Morenci, Bagdad, Safford, Sierrita, and Miami in Arizona; Tyrone and Chino in New Mexico; and Henderson and Climax in Colorado, North America, as well as Cerro Verde in Peru and El Abra in Chile. The company also operates a portfolio of oil and gas properties primarily located in offshore California and the Gulf of Mexico. As of December 31, 2021, it operated approximately 135 wells. The company was formerly known as Freeport-McMoRan Copper & Gold Inc. and changed its name to Freeport-McMoRan Inc. in July 2014. Freeport-McMoRan Inc. was incorporated in 1987 and is headquartered in Phoenix, Arizona.

Analyst Sentiment

80%
Strong Buy

From 23 Active Polls

1Y Forecast: $70.88

▲ +11.9% Potential Upside

Consensus Target Metrics

Low Bound

$54

Median

$74

High Bound

$77

Average

$71

Price & Moving Averages

Loading chart...

🎯 Wall Street Analyst Intelligence Report

1-Year structural target targets, chart projections, and sentiment maps.

Average 1Y Target
$70.88
▲ +11.85% Upside
Low Target
$54.00
-15% Risk
Median Target
$73.50
16% Mid
High Target
$77.00
22% Max
Consensus
Buy
25 / 41 Buys

Consensus Trend Projection

Trailing closures vs. 12-month metrics map.

Analyst Vote Distribution

Aggregate institutional coverage sentiment weights.

📊 Historical Valuation Multiples

Real-time Trailing Twelve Month (TTM) momentum side-by-side with discrete quarterly metrics.

Fiscal QuarterTTMQ1 2026Q4 2025Q3 2025Q2 2025Q1 2025Q4 2024Q3 2024Q2 2024
Period EndingTrailing 12MMar 31, 2026Dec 31, 2025Sep 30, 2025Jun 30, 2025Mar 31, 2025Dec 31, 2024Sep 30, 2024Jun 30, 2024
Market Cap ($M)91,09884,87873,29056,59462,59754,67054,72172,08469,517
Enterprise Value ($M)97,48291,26281,43862,04467,82859,52960,53675,74672,740
Price to Earnings Ratio (P/E)33.4824.0945.1320.9920.2739.5049.9334.6628.49
Price/Earnings-to-Growth Ratio (PEG)2.260.567.1211.06
Price to Sales Ratio (P/S)3.4513.6213.018.128.269.849.3110.7910.91
Price to Book Ratio (P/B)4.694.353.883.033.443.093.114.113.99
Price to Free Cash Flow Ratio (P/FCF)14.59162.6041.9093.0818.59-479.56277.77107.1182.76
Enterprise Value to Sales (EV/Sales)14.6414.468.908.9510.7210.3011.3411.42
Enterprise Value to EBITDA (EV/EBITDA)10.1634.2871.3723.4321.5932.5832.7828.7527.69
Debt to Equity Ratio0.670.530.610.500.510.530.550.550.54

FCX Growth Runway Model

Standard long term linear growth fade

Multi-Stage Discounted Cash Flow Sandbox

Market Price$63.37
Intrinsic Value$7.60
Market Alignment
Overvalued by 88.0%relative to calculated intrinsic value
9.00%
Exp: 1%1%
i

Growth runway slowdown

This value provides a time window for the growth rate to decline beyond Stage 1 toward the terminal rate. Longer windows are most useful for companies with high growth starting conditions or strong competitive advantages. This option stretches out the growth rate slowdown across 5, 10, or 15-year steps. A high-growth starting condition (exceeding a 25% initial growth rate) automatically applies a curve decay to simulate realistic, rapid market saturation.
i

Terminal growth rate

With long-term inflation between 3-5%, revenue must grow by that baseline to maintain flat real-world market share. This value sets the permanent terminal growth rate to factor into the valuation beyond the growth slowdown runway toward maturity.

3-Stage Financial Runway Horizon

🧠 Perpetuity Horizon Engine (Stage 3: Post-2035)

Terminal FCF Base$0.81B
Perpetuity TV Value$15.19B
Discounted TV (PV)$6.42B
TV Weighting %57.9%
⚠️
Financial Model Disclaimer & Risk Disclosure: This interactive scenario simulator is an educational sandbox provided strictly for informational and analytical research purposes. Core historical financial statements and consensus estimates are sourced directly via Financial Modeling Prep (FMP). All downstream outputs are entirely deterministic, hypothetical projections generated by combining automated mathematical formulas (including linear interpolation and Gaussian bell-curve decay models) with user-selected variables and third-party financial data inputs. Users assume all liability for trading decisions executed based on these sandbox calculations.

📘 Full Research Report

ℹ️

AI-Generated Research: This report is for informational purposes only.

📘 FREEPORT MCMORAN INC (FCX) — Investment Overview

🧩 Business Model Overview

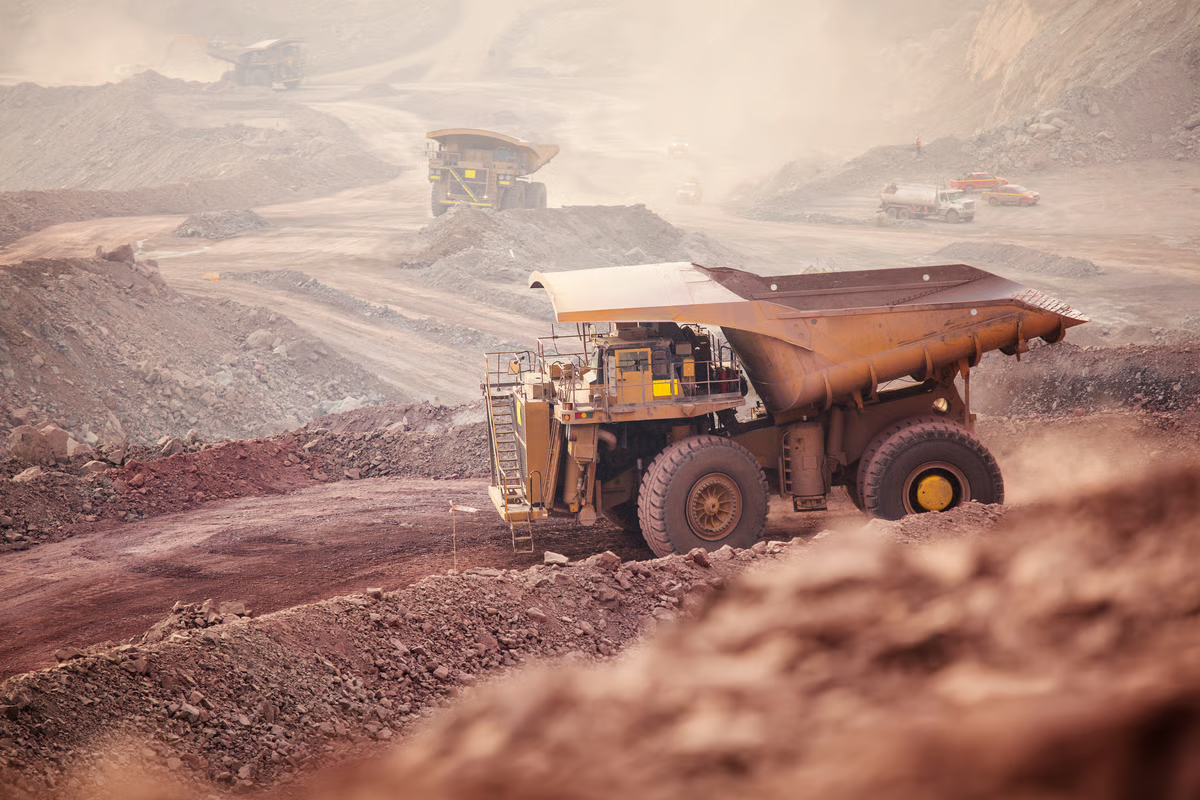
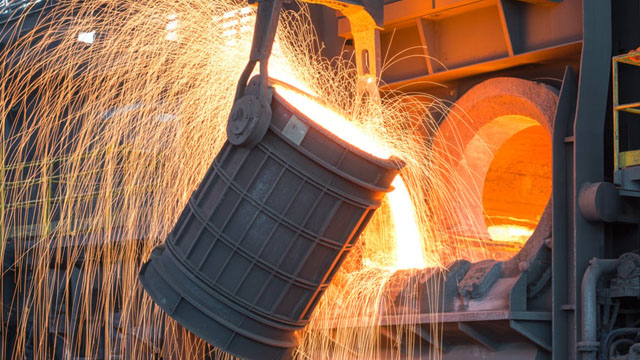
Freeport-McMoRan is a large-scale natural resources producer with a focus on copper (and significant by-product economics) and meaningful exposure to gold. The value chain is fundamentally upstream: securing and developing ore reserves, mining and processing ore into payable metals, and monetizing production through sales to industrial and refining customers.

The operating model is characterized by (1) long-lived mine portfolios, (2) heavy reliance on in-house logistics and processing infrastructure, and (3) cost management around energy, labor, consumables, and capital deployment required to sustain output. Because mining assets are both geographically fixed and capital intensive, capacity and output are anchored by existing resource positions and supporting infrastructure rather than flexible, customer-driven volume decisions.

💰 Revenue Streams & Monetisation Model

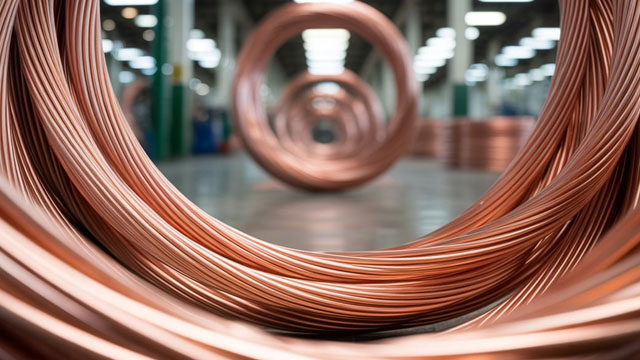
Revenue is primarily generated from the sale of payable copper and gold, with additional contributions from by-products depending on mine mix and ore characteristics. Monetisation is largely transactional—metal sales occur at market prices—so margins are driven less by customer contracts and more by the gap between realized metal prices and all-in production costs.

Primary margin drivers include:

  • Ore quality and mine plan: grades, strip ratios, recovery rates, and by-product credits affect unit cash costs.
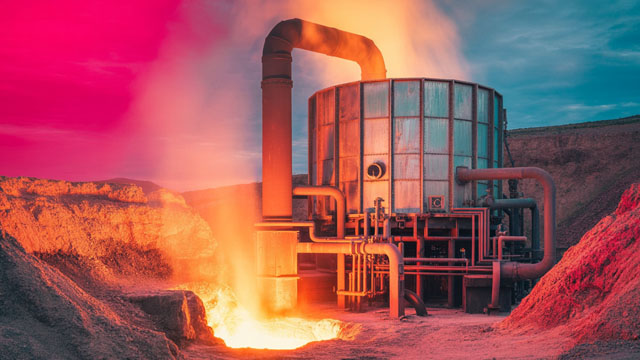
  • Energy and consumables intensity: sustained performance depends on energy procurement and efficient processing.
  • Processing and logistics efficiency: throughput at large plants and the reliability of transport/handling systems impact recoveries and unit costs.
  • Sustaining capital discipline: maintaining production at mature assets requires ongoing investment; over- or under-spending can shift cost curves.

Given the commodity-linked nature of pricing, Freeport’s economic leverage typically comes from cost position and resilience of cash flows through the cycle rather than from recurring revenue characteristics.

🧠 Competitive Advantages & Market Positioning

Freeport’s competitive positioning is best framed as a cost-and-infrastructure moat rather than a switching-cost or network-effect moat.

Moat elements:

  • Low-cost feedstock and resource quality: Large, established ore bodies and mine plans support favorable unit economics versus higher-cost competitors, particularly when grades and processing recoveries remain competitive.
  • Geographic and logistical infrastructure: Existing haulage, processing capacity, and export/transport links reduce marginal operational friction and lower effective delivered-cost compared with projects requiring full build-outs.
  • Scale and operational learning curves: Operating at high throughput enables fixed-cost absorption and more efficient maintenance, procurement, and plant utilization.
  • Capital allocation and development capability: Replacing or expanding production requires substantial capex and execution capacity; this raises practical barriers to entry for new entrants.

Competitive benchmarking: Copper/gold peers include BHP and Rio Tinto (diversified base-metals miners with large copper assets) and Teck Resources (notably focused on copper and related commodities, with a different asset mix and cost structure). In contrast to some peers with heavier emphasis on different commodity mixes, Freeport’s portfolio concentrates on large mining and processing operations with established logistical footprints, emphasizing the ability to produce at scale from long-life resources.

For gold-focused peers such as Newmont and Barrick Gold, the moat profile differs: those companies often compete more on gold-centric reserve depth and project economics, whereas Freeport’s investment case centers on copper-driven cash generation with gold contributing diversification and by-product value.

🚀 Multi-Year Growth Drivers

Over a 5–10 year horizon, the demand-supply balance for key commodities underpins the investment narrative. The most durable drivers are structural:

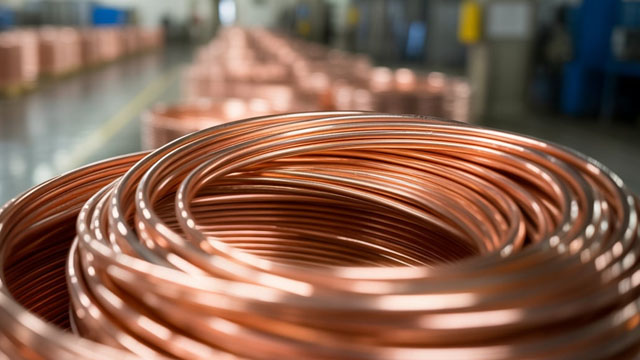
  • Electrification and grid buildout: Copper intensity per unit of infrastructure supports long-run demand from power transmission, renewable integration, and electrified transport.
  • Energy transition supply constraints: Copper supply growth faces hurdles from declining ore grades in many regions, permitting complexity, and the long lead times required to bring new capacity online.
  • Portfolio durability: Long-life mines and sustaining capital programs can help protect output and keep cost curves competitive as the industry cycles through periods of tight supply.
  • Gold as a portfolio hedge: Gold often benefits from periods of financial uncertainty and acts as a diversifier when copper demand swings.

In TAM terms, copper remains central to both industrial electrification and large-scale infrastructure expansion; Freeport’s opportunity is tied to maintaining a strong cost position while navigating project execution and regulatory timelines needed to preserve supply contribution.

⚠ Risk Factors to Monitor

  • Commodity price cyclicality: Realized revenues track metal prices, causing operating margin volatility. The investment outcome depends on sustaining a favorable cost position across cycles.
  • Geopolitical and regulatory exposure: Operations in jurisdictions with evolving tax, royalty, permitting, and labor frameworks can affect unit economics and development schedules.
  • Operational and ESG risks: Tailings, water management, and community/regulatory compliance represent structural execution risks common to large-scale mining.
  • Grade decline and resource depletion dynamics: Sustaining production requires continued capital investment and effective mine planning; negative changes in ore quality can raise costs.
  • Input cost and logistics disruptions: Energy prices, shipping/transport reliability, and supply chain constraints can shift cash costs materially.

📊 Valuation & Market View

Mining equities in this space are typically valued on asset-backed cash flow capacity and cycle-adjusted profitability, commonly through metrics such as EV/EBITDA and EV/operating cash flow, alongside discounted cash flow frameworks that assume commodity price decks and long-term cost curves.

Key valuation drivers include:

  • Cost curve positioning: Markets reward producers with lower all-in costs and resilient margins.
  • Production durability and reserve life: Long-lived assets reduce perceived redevelopment risk and support confidence in future cash flows.
  • Capex efficiency: Execution quality in sustaining and expansion capital influences the shape of free cash flow across the cycle.
  • Country/regulatory risk premium: Higher uncertainty tends to compress multiples until risk is clarified or mitigated.

Given the commodity-linked revenue model, valuation sensitivity typically centers on assumptions about long-run copper and gold prices and the durability of Freeport’s cost advantages through sustaining capital and operational discipline.

🔍 Investment Takeaway

Freeport-McMoRan’s long-term investment appeal rests on a cost-and-infrastructure moat anchored in large-scale mining operations and logistical footprints that support unit economics. The core thesis is that structural demand for copper in electrification can persist over a multi-year horizon, while Freeport’s ability to sustain competitive production costs—and manage high capital-intensity execution—can translate industry supply tightness into attractive cash flow outcomes across the commodity cycle.


⚠ AI-generated — informational only. Validate using filings before investing.

📰 Market News & Coverage

15 Stories Available

Real-time institutional reporting and market updates for FCX.

zacks.com2026-06-04

Can FCX Protect Margins Amid Higher Copper Production Costs in Q2?

FCX faces rising Q2 copper production costs from energy and volume pressures, even as sales volumes show modest sequential recovery.

zacks.com2026-06-02

Here's Why Freeport-McMoRan (FCX) is a Strong Growth Stock

The Zacks Style Scores offers investors a way to easily find top-rated stocks based on their investing style. Here's why you should take advantage.

zacks.com2026-06-02

Watch These 5 Non-Tech Stocks Thriving in 2026 on AI Data Center Boom

ETN, CAT, FCX, GEV and AA are five non-tech stocks benefiting from rising power, infrastructure and metal demand for AI data centers.

zacks.com2026-06-01

Freeport-McMoRan (FCX) Rises Higher Than Market: Key Facts

Freeport-McMoRan (FCX) reached $67.04 at the closing of the latest trading day, reflecting a +2.02% change compared to its last close.

gurufocus.com2026-05-28

Freeport-McMoRan Inc (FCX) Stock Up 3.5% but GF Value Says Overvalued -- GF Score: 89/100

On May 28, 2026, Freeport-McMoRan Inc (FCX) shares rose 3.5% to $65.87, continuing a strong performance over the past year with a staggering 71.3% increase. The

zacks.com2026-05-28

Is Freeport-McMoRan (FCX) a Buy as Wall Street Analysts Look Optimistic?

When deciding whether to buy, sell, or hold a stock, investors often rely on analyst recommendations. Media reports about rating changes by these brokerage-firm-employed (or sell-side) analysts often influence a stock's price, but are they really important?

zacks.com2026-05-28

Freeport-McMoRan Inc. (FCX) is Attracting Investor Attention: Here is What You Should Know

Recently, Zacks.com users have been paying close attention to Freeport-McMoRan (FCX). This makes it worthwhile to examine what the stock has in store.

seekingalpha.com2026-05-28

Freeport-McMoRan: Robust Pipeline And Significant Long-Term Potential Make It A Buy

Freeport-McMoRan is rated Buy, supported by resilient U.S. operations, a robust expansion pipeline, and discounted valuation at 7.6x EV/EBITDA FWD. Despite a 9% copper and 7% gold production cut at Grasberg, U.S. mines sustain results, with unit net cash costs at $1.91/lb and strong operating margins. FCX's growth pipeline—Bagdad, El Abra, Lone Star, and innovative leach—offers low execution risk and profitability even at conservative copper prices.

investors.com2026-05-27

Dig For A Shiny Return From Metals Miner Freeport-McMoRan With This Strategy

Freeport-McMoRan stock is near a buy point. This trade can generate an annualized return of nearly 25% or offer the stock at a discount.

gurufocus.com2026-05-26

A Look at Freeport-McMoRan Inc (FCX) After 3.8% Gain -- GF Value $47.32 vs Price $64.36

On May 26, 2026, Freeport-McMoRan Inc (FCX) shares rose 3.8% today, bringing the current price to $64.36. Over the past year, the stock has seen an impressive 6

seekingalpha.com2026-05-26

Freeport-McMoRan: Copper Exposure Without Southern Copper's Premium

Freeport-McMoRan: Copper Exposure Without Southern Copper's Premium

zacks.com2026-05-21

FCX vs. SCCO: Which Copper Mining Giant is a Better Pick Now?

Freeport and Southern Copper push ahead with major projects leveraging strong cash flows and favorable copper prices.

seekingalpha.com2026-05-15

Freeport-McMoRan Inc. (FCX) Presents at Bank of America Global Metals, Mining & Steel Conference 2026 Transcript

Freeport-McMoRan Inc. (FCX) Presents at Bank of America Global Metals, Mining & Steel Conference 2026 Transcript

zacks.com2026-05-14

3 Non-Ferrous Metal Mining Stocks to Watch in a Challenging Industry

Despite the Zacks Mining - Non Ferrous industry's weak near-term outlook, stocks like SCCO, FCX and LUNMF are worth keeping an eye on given their growth potential.

zacks.com2026-05-14

Grasberg Disruptions Weigh on FCX's Q1 Volumes: What Lies Ahead?

FCX cuts 2026 copper sales outlook after Grasberg disruptions hit volumes, despite stronger copper and gold prices boosting Q1 results.

📊 AI Financial Analysis

Powered by StockMarketInfo
Earnings Data: Q Ending 2026-03-31

"FCX reported Q1 2026 revenue of $6.234B and net income of $881M (EPS: $0.61). QoQ, revenue fell from $5.633B (Q4’25) to $6.234B (+10.7% QoQ), but profitability remained volatile: gross margin expanded to 26.5% from 18.1% (Q4), and net margin rose to 14.1% from 7.2%. YoY, revenue declined from $5.554B (Q1’25) to $6.234B, a +12.2% YoY increase, while net income surged from $346M to $881M (+154.5% YoY) and EPS rose from $0.24 to $0.61. Over the last four quarters, profitability has generally improved off the weaker Q1’25/Q4’25 prints, with operating income and margins showing strong sequential recovery in Q1’26. Cash flow quality is solid: operating cash flow was $1.495B and free cash flow was $522M, supporting capital returns despite continued heavy reinvestment (CapEx $973M). Balance-sheet resilience looks good: total assets were $58.8B with equity of $31.5B, and net debt improved to ~$6.38B from ~$8.15B in Q4’25. Shareholder returns are strongly positive. The stock is up 110.7% over the last year (market momentum >20%), with a modest dividend yield (~0.5%). Overall, Q1’26 reflects improved earnings power and cash generation alongside favorable investor sentiment."

Revenue Growth

Positive

Revenue: +10.7% QoQ ($5.633B -> $6.234B) and +12.2% YoY ($5.554B -> $6.234B). Trajectory improved into Q1’26 versus the weaker Q4’25 level.

Profitability

Strong

Net income: +161.1% QoQ ($406M -> $881M) and +154.5% YoY ($346M -> $881M). Margins expanded sharply (net margin 7.2% in Q4’25 -> 14.1% in Q1’26; gross margin 18.1% -> 26.5%). EPS rose from $0.28 to $0.61 QoQ and from $0.24 YoY.

Cash Flow Quality

Positive

Operating cash flow was $1.495B and free cash flow was $522M in Q1’26. Dividend paid was substantial (-$443M) but appears supported by earnings/cash generation; buybacks were modest (-$93M).

Leverage & Balance Sheet

Good

Assets were stable-to-up at $58.8B. Equity increased to $31.5B. Net debt improved to ~$6.38B from ~$8.15B in Q4’25, indicating improved balance-sheet leverage.

Shareholder Returns

Strong

Total shareholder tailwind is strong: price is up 110.7% over 1 year (well above the >20% momentum threshold). Dividend yield is low (~0.5%), but capital appreciation dominates; buybacks continue at a smaller scale.

Analyst Sentiment & Valuation

Neutral

Street targets imply upside/near-term support (consensus target $67 vs. current price $70.21 suggests limited upside). However, valuation multiples based on this quarter’s earnings look elevated (P/E ~24.1), so execution/in-the-ground commodity assumptions matter.

Disclaimer:This analysis is AI-generated for informational purposes only. Accuracy is not guaranteed and this does not constitute financial advice.

Fundamentals Overview

Loading fundamentals overview...

So What? FCX’s Q1 2026 narrative is a mix of strong momentum outside Grasberg and a clear operational timing setback inside it. U.S. and leach innovation are progressing (heated stockpile pilot at Morenci; targets for 300M–400M lbpa in 2026–2027 and 800M lbpa as soon as 2030), while El Abra expansion is moving forward with an EIS filed in March and stakeholder receptiveness highlighted. The financial framing is also supportive: Q1 sales/unit costs beat forecast and management raised/updated cost outlook assumptions due to diesel and sulfuric acid volatility. However, Grasberg remains the overhang. PB2/PB3 are constrained to ~60,000 tpd in 2H 2026 (from a prior 100,000 tpd target), improving toward ~90,000 tpd by mid-2027 once chute/shot regulators (“silminators”) are installed. Management’s confidence hinges on vendor delivery and phased construction execution, with potential upside if ore conditions become drier over time.

AI IconGrowth Catalysts

  • Grasberg Block Cave restart progressing via phased ramp-up in production blocks 2 and 3; recovery constrained by ore-loading downstream bottlenecks expected to be addressable by mid-2027
  • U.S. leach/heated stockpile initiative at Morenci: pilot test underway with heated leaching solution; management line of sight to 300M–400M lbpa by 2026–2027 and to 800M lbpa as soon as 2030
  • El Abra Chile expansion: environmental impact statement filed in March to transform El Abra into a large-scale contributor; planned heated stockpile injections testing in late 2026
  • Bagdad (Arizona) brownfield expansion optionality: leach opportunity scaling and potential investment decision later in 2026 with planned 3–4 year execution timeline

Business Development

  • Memorandum of Understanding (MOU) with the Government of Indonesia (signed February) extending Grasberg operating rights beyond 2041
  • CODELCO partnership for El Abra expansion and medium-term growth; stakeholder reception characterized as positive
  • Insurance providers: agreement reached for a $700 million maximum-limit insurance recovery; expected cash collection in Q2

AI IconFinancial Highlights

  • Q1 results described as beating forecast on copper/gold sales and unit costs; favorable metal price backdrop supported growth in revenues, EBITDA, and cash flow year-over-year despite reduced-capacity Indonesia operations
  • Net unit cost outlook increased to $1.95/lb copper for 2026 from prior $1.75/lb, driven primarily by lower Grasberg volume contribution and renewed cost pressures
  • Diesel price shock post–late-February Iran conflict: March diesel rise equates to ~$500 million annualized cost increase (impact most significant in Indonesia)
  • Modeled annual EBITDA sensitivity: each $0.10/lb copper change ≈ $400 million annual EBITDA (2027–2028); each $100/oz gold change ≈ $110 million annual EBITDA
  • Capital guidance unchanged: capex expected ≈ $4.3B in 2026 and $4.5B in 2027

AI IconCapital Funding

  • Returned approximately $300M to shareholders in Q1 2026 (common stock dividends and repurchase of 1.7 million shares)
  • Capex outlook: ~$4.3B (2026) and ~$4.5B (2027); discretionary ~$1.6B–$1.7B per year (including Kucing Liar development and LNG project at Grasberg)
  • Balance sheet described as solid with investment-grade ratings and no significant debt maturities through 2026; substantial flexibility for 2027 maturities

AI IconStrategy & Ops

  • Morenci/U.S. innovation: additive deployment progressing; additive additions described as internally developed (including a new additive with “significant promise” in lab tests)
  • Morenci pilot: heated leaching solution applied to stockpiles to increase temperature and improve recoveries; ongoing search for most effective engineering/cost solution
  • Automation/innovation positioning: emphasis on AI and other tools to enhance mining performance and reduce unplanned downtime
  • Indonesia smelter operations: one smelter operating with available concentrate; second smelter on standby with expected restart later in 2026

AI IconMarket Outlook

  • Copper price: averaged over $5.80/lb year-to-date and exceeded $6/lb in Q1
  • Demand drivers reiterated: U.S. AI data centers/energy infrastructure outweigh weakness in private construction and auto; China grid spending resurgence and exchange inventory draws noted
  • 2H volume phasing: second-half volumes expected ~30% higher for copper and ~50% higher for gold vs first half (as ramp-up progresses)
  • Leach scale target timeline: 300M–400M lbpa in 2026–2027; path to ~800M lbpa “as soon as 2030”

AI IconRisks & Headwinds

  • Grasberg ramp constraint is timing-related: wet ore proportion increased (wet draw points rose from 30% of 635 in Sep 2025 to 45% currently), increasing reliance on more robust chute-flow regulators; throughput constrained until shot/chute modifications are installed
  • Production guidance cut due to ramp-up timing: PB2/PB3 limited to ~60,000 tonnes/day in 2H 2026 (vs prior plan to ramp to 100,000 tonnes/day in 2H 2026); expected to increase to ~90,000 tonnes/day by mid-2027
  • Upward risk exists if material becomes drier over time, improving blending compatibility; however regulators/installation execution risk remains
  • Commodity-linked cost pressure: diesel and sulfuric acid volatility since late-February Iran conflict; sulfuric acid spot prices more than doubled (diesel described as the larger annualized impact)
  • Execution risk: vendor delivery and construction schedule/timing for installing “silminators” (reengineered Version 1.5) into shot/chute design

Q&A: Analyst Interest

  • Topic: What specifically drives the confidence in Grasberg’s revised ramp-up, given the production reservation reduction? Management response: Kathleen said the core fix is installing new regulators into the chute/shot system—capacity to mine exists, but train loading needs consistency. Risks center on vendor delivery and construction schedule; management expects installation to proceed in phased basis.
  • Topic: What are the key execution risks around the regulator equipment (timing, installation phasing, and vendor readiness)? Management response: Mark Johnson described a reengineered “Version 1.5” prototype approach: first unit installed last week, testing starting this weekend, and additional units on site. Fabrication occurs in Indonesia, with the team seeking to shorten the construction cycle via chute installation optimization.
  • Topic: Does the regulators plan cover upside if ore becomes drier during ramp-up, and what would change operationally? Management response: Management said the forecast assumes robust regulation, not improvement in blending conditions. Sampling is dynamic; upside could occur if mined material becomes drier, and traditional blending resumes. Regulators can shut off flow if material conditions worsen.

Sentiment: MIXED

Note: This summary was synthesized by AI from the FCX Q1 2026 earnings transcript. Financial data is complex; please verify all metrics against official SEC filings before making investment decisions.

📋 Official Regulatory 10-K / 10-Q SEC Filings

Direct authenticated documentation links to audited SEC database reports for FCX.

SEC EDGAR Live Feed
Loading financial data and tables...
📁

SEC Filings (FCX)

© 2026 Stock Market Info — Freeport-McMoRan Inc. (FCX) Financial Profile