Serve Robotics Inc.

Serve Robotics Inc. (SERV) Market Cap

Serve Robotics Inc. has a market capitalization of $516.2M.

Price: $7.75

-0.67 (-7.90%)

Market Cap: 516.17M

NASDAQ · time unavailable

CEO: Ali Kashani

Sector: Industrials

Industry: Industrial - Machinery

IPO Date: 2024-03-08

Website: https://www.serverobotics.com

Serve Robotics Inc. (SERV) - Company Information

Market Cap: 516.17M|Sector: Industrials

Company Profile

Serve Robotics Inc. designs, develops, and operates low-emission robots that serve people in public spaces with food delivery in the United States. It builds self-driving delivery robots. The company was formerly known as Patricia Acquisition Corp. and changed its name to Serve Robotics Inc. in July 2023. Serve Robotics Inc. was founded in 2017 and is based in Redwood City, California.

Analyst Sentiment

89%
Strong Buy

From 8 Active Polls

1Y Forecast: $16.33

▲ +110.7% Potential Upside

Consensus Target Metrics

Low Bound

$13

Median

$16

High Bound

$20

Average

$16

Price & Moving Averages

Loading chart...

🎯 Wall Street Analyst Intelligence Report

1-Year structural target targets, chart projections, and sentiment maps.

Average 1Y Target
$16.33
▲ +110.71% Upside
Low Target
$13.00
68% Risk
Median Target
$16.00
106% Mid
High Target
$20.00
158% Max
Consensus
Buy
14 / 22 Buys

Consensus Trend Projection

Trailing closures vs. 12-month metrics map.

Analyst Vote Distribution

Aggregate institutional coverage sentiment weights.

📊 Historical Valuation Multiples

Real-time Trailing Twelve Month (TTM) momentum side-by-side with discrete quarterly metrics.

Fiscal QuarterTTMQ1 2026Q4 2025Q3 2025Q2 2025Q1 2025Q4 2024Q3 2024Q2 2024
Period EndingTrailing 12MMar 31, 2026Dec 31, 2025Sep 30, 2025Jun 30, 2025Mar 31, 2025Dec 31, 2024Sep 30, 2024Jun 30, 2024
Market Cap ($M)51664276668065821149532366
Enterprise Value ($M)4745996655675441537427340
Price to Earnings Ratio (P/E)-4.30-3.27-5.59-5.15-7.89-3.99-9.43-10.09-1.81
Price/Earnings-to-Growth Ratio (PEG)-0.01-0.20-0.74-0.17-0.03
Price to Sales Ratio (P/S)99.37215.00868.88990.541024.87478.562814.431456.36139.98
Price to Book Ratio (P/B)1.852.022.182.403.181.003.765.742.30
Price to Free Cash Flow Ratio (P/FCF)-3.49-14.97-16.61-18.42-29.91-16.31-44.50-32.09-10.03
Enterprise Value to Sales (EV/Sales)200.83754.38826.39847.1133.862126.751233.8584.54
Enterprise Value to EBITDA (EV/EBITDA)-3.59-13.16-18.78-18.35-27.15-1.17-28.11-32.40-4.52
Debt to Equity Ratio0.320.020.010.010.010.010.020.030.10
⚠️

Valuation Model Suspended

API Payload Error: Inverted or negative baseline Free Cash Flow margin detected (-43.0%).

Troubleshooting Notice: The upstream financial data supplier has uploaded corrupted or inverted baseline metrics for SERV. The server sandbox cannot calculate an intrinsic value path from negative cash generation baselines.

📘 Full Research Report

ℹ️

AI-Generated Research: This report is for informational purposes only.

📘 SERVE ROBOTICS INC (SERV) — Investment Overview

🧩 Business Model Overview

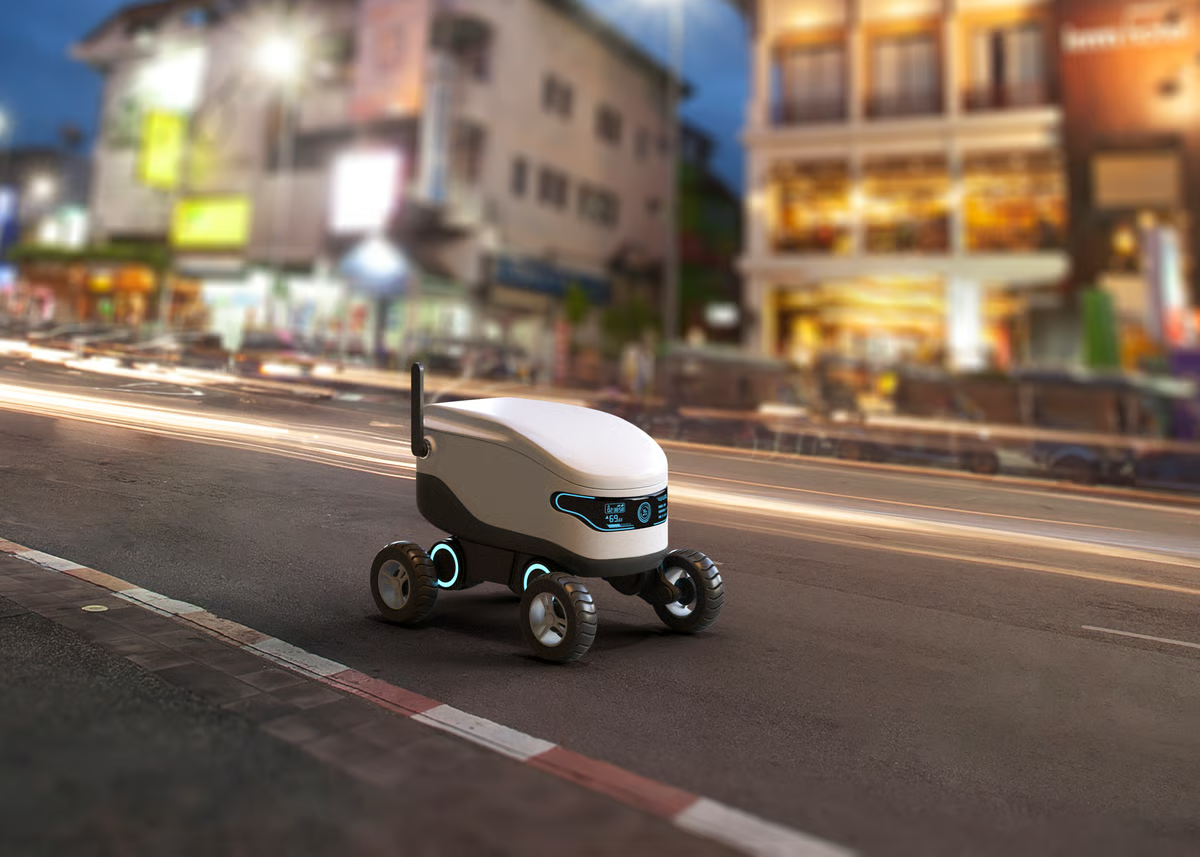
SERVE ROBOTICS develops and operates autonomous delivery robots used for last-mile logistics in urban and campus settings. The value chain is centered on (1) autonomous navigation and delivery execution software, (2) deployed robot fleet hardware, and (3) operational integration with partners that place orders and manage fulfillment workflows. In practice, Serve’s offering is used to move goods from a designated pick-up point to a delivery destination with minimal human intervention, supported by remote monitoring and fleet operations.

Customer stickiness tends to increase as operations mature: delivery partners must integrate routing, geofencing/service areas, pickup workflows, and customer access/receiving procedures with Serve’s system. That operational embedding makes renewals and expansions more likely than one-off pilots.

💰 Revenue Streams & Monetisation Model

SERV typically monetizes through a mix of usage-based delivery activity and service/operations arrangements with partners (e.g., fulfillment operators, food delivery networks, and enterprise sites). Monetisation is usually structured to tie revenue to active deployments and service levels rather than purely one-time robot sales.

  • Transactional/usage component: revenue linked to deliveries performed and/or active robot utilization.
  • Operational & software-service component: ongoing support, remote monitoring, maintenance coordination, and software enablement that supports continuity and safety requirements.
  • Potential enterprise expansion component: scaling within a site/campus or expanding coverage zones after performance targets are met.

Key margin drivers are fleet utilization, delivery success rate (directly tied to autonomy performance), and total cost per delivery (robot depreciation, charging/battery logistics, field servicing, and support). Sustained improvements in autonomy efficiency and maintenance effectiveness typically improve gross margin potential as volume scales.

🧠 Competitive Advantages & Market Positioning

The competitive landscape for sidewalk delivery robots is crowded, but structural advantages can emerge when autonomy performance, deployment density, and operational integration reinforce one another.

Primary moat: Switching costs via operational integration + data gravity

  • Operational switching costs: partners embed with Serve’s routing/service-area configuration, pickup/delivery workflows, receiving procedures, and operational escalation processes. Changing vendors requires re-integration and re-validation of safety and service-level performance.
  • Data gravity for autonomy: repeated deployments generate operational data (routes attempted, failure modes, obstacle handling, geofencing edge cases). Over time, improved models can reduce delivery failures and improve unit economics, raising the cost of switching for customers that already optimized operations on Serve’s stack.

Competitive benchmarking (industry peers)

  • Starship Technologies: similar end-market (autonomous sidewalk delivery) with a focus on fleet deployments and partner integrations. Serve’s differentiation tends to come from specific partnership execution and deployment workflow fit rather than a fundamentally different business model.
  • Marble (Marble Technologies): also targets autonomous ground delivery with a fleet-oriented approach. Marble competes for “time-to-scale” and partnerships in dense last-mile environments, pressuring pricing and deployment economics.
  • Nuro: autonomous delivery with a different platform emphasis (vehicle-based deliveries) and different regulatory/safety footprint implications. While not a direct apples-to-apples competitor for sidewalk robots, Nuro competes for investor and partner attention in autonomy-enabled logistics.

Across these peers, the competitive battleground is commercialization velocity and unit economics—how quickly deployments translate into repeatable, low-cost delivery operations. Serve’s industry focus is on operating autonomous robots within partner ecosystems where integration and utilization drive value, rather than selling standalone robot units without a service footprint.

🚀 Multi-Year Growth Drivers

  • Labor cost pressure & reliability requirements: expanding utilization of automation to reduce labor dependency and improve delivery consistency.
  • Urban density and constrained logistics capacity: in dense areas, point-to-point delivery can be inefficient for human-driven models, increasing the appeal of autonomous “last-mile legs.”
  • Operational learning loops: iterative improvements to autonomy and remote operations can compound as deployments scale, supporting better success rates and lower cost per delivery.
  • Expansion from pilots to rollouts: once safety, service-level, and workflow integration pass thresholds, sites/cities can add coverage zones and additional robots.
  • TAM expansion through adjacent use cases: beyond food delivery, robots can support broader enterprise and campus delivery needs (packets, small parcels, replenishment), broadening addressable routes and partner categories.

Over a 5–10 year horizon, value creation likely depends on translating early deployments into scalable economics: higher delivery density per geographic footprint, improved autonomy success, and repeatable partner onboarding.

⚠ Risk Factors to Monitor

  • Regulatory and permitting risk: autonomous delivery operations require municipal permissions, safety frameworks, and local compliance. Restrictions can limit where robots can operate or increase operating constraints.
  • Safety, incident, and liability risk: collision events or navigation failures can lead to operational suspensions, partner churn, or increased insurance/compliance costs.
  • Technology performance risk: autonomy robustness in edge cases (weather, construction, dense pedestrian traffic, complex curb/obstacle environments) determines delivery success and unit economics.
  • Capital intensity and cash burn: maintaining and scaling a robot fleet, spares, servicing, and charging logistics can be cash intensive before unit economics fully stabilize.
  • Partner concentration risk: reliance on a limited number of delivery or enterprise partners can increase revenue volatility if contracts are paused or reprioritized.
  • Competitive pressure on pricing and deployment terms: peers can bid aggressively for pilots or scale partnerships, compressing near-term margins.

📊 Valuation & Market View

Robotics and autonomy companies are typically valued through a blend of growth expectations and margin trajectory rather than mature earnings power. In this sector, valuation frameworks often emphasize:

  • Revenue scale vs. cost-to-serve: progression toward favorable gross margin as delivery success rates rise and maintenance/servicing costs stabilize.
  • Utilization and retention: higher deployments per geographic footprint and partner renewals signal operating leverage.
  • Capital efficiency: how quickly incremental deployments generate cash flow or reduce incremental cost per delivery.
  • Optionality: market assesses whether autonomy capabilities can expand across use cases and geographies.

Given the hardware-and-software hybrid nature of autonomy delivery, investors often look for a path from pilot revenue to repeatable deployments, and from experimental economics to sustainable unit economics. Metrics that move the needle tend to include delivery success rates, coverage expansion, service-level performance, and trends in cost per delivery rather than accounting profits alone.

🔍 Investment Takeaway

SERVE ROBOTICS offers exposure to autonomous last-mile logistics where long-term value hinges on operational integration and autonomy-driven cost reductions. The core investment thesis rests on the emergence of switching costs through partner workflow embedding and the compounding effect of fleet data on autonomy performance. Upside depends on scaling deployments into repeatable, capital-efficient delivery operations, while key downside risks center on regulatory constraints, safety outcomes, and the time required to achieve sustainable unit economics in a competitive robotics field.


⚠ AI-generated — informational only. Validate using filings before investing.

📰 Market News & Coverage

15 Stories Available

Real-time institutional reporting and market updates for SERV.

investors.com2026-06-02

Serve Robotics Expands Into Laundry Delivery

Serve Robotics, operator of a fleet of urban delivery robots, is expanding beyond food delivery to laundry delivery.

globenewswire.com2026-06-02

Serve Robotics Continues Expansion Beyond Food Delivery, Launches Autonomous Laundry Vertical with NoScrubs

LOS ANGELES, June 02, 2026 (GLOBE NEWSWIRE) -- Serve Robotics Inc. (Nasdaq: SERV), a leading autonomous robotics company, today announced a new partnership with NoScrubs , a fast-growing on-demand laundry service, marking Serve's first commercial urban delivery partnership outside of prepared food. The pilot, launching this week in select Los Angeles neighborhoods, will use Serve's existing fleet of autonomous sidewalk robots to deliver NoScrubs laundry orders directly to customers' doors.

zacks.com2026-06-01

SERV's Operating Footprint Broadens: Can New Markets Add Momentum?

Serve Robotics expands into 44 cities and is eyeing new U.S. markets - and possibly Canada - as it seeks scale beyond early robot delivery pilots.

zacks.com2026-05-28

SERV's DoorDash Momentum Builds: Can It Lift Robot Productivity?

Serve Robotics sees DoorDash demand surge, with merchant count up roughly 6x in 2026, as it pauses new robots to lift utilization and per-bot productivity.

zacks.com2026-05-28

Serve Robotics vs. Symbotic: Which Robotics Stock Has More Upside?

Autonomous robotics is rapidly becoming one of the most important themes shaping the future of logistics, fulfillment and physical AI, and companies like Serve Robotics Inc. SERV and Symbotic Inc. SYM are emerging as key players driving this transformation. From navigating crowded sidewalks to orchestrating increasingly complex warehouse operations, robotics companies are racing to build scalable autonomy platforms capable of operating safely and reliably in real-world, human-centered environments.

247wallst.com2026-05-28

Jensen Huang Just Said $40 Trillion. Here Are 5 Physical AI Stocks Wall Street Is Quietly Loading Up On Before the Rest of the Market Catches On

NVIDIA CEO Jensen Huang has called humanoid robots and labor automation a $40 trillion total addressable market, and on the Animal Spirits podcast, Derek Yan argued physical AI is “potentially bigger” than EVs or smartphones, with Waymo serving as live proof the underlying autonomy stack already works in the wild.

fool.com2026-05-25

Meet the Tiny Artificial Intelligence (AI) Company That Just Grew Its Sales by a Whopping 578%

This company is trying to capture a $450 billion opportunity in the physical artificial intelligence space.

zacks.com2026-05-20

SERV's Moxi Bet Broadens: Can Healthcare Add Recurring Revenues?

Serve Robotics moves beyond sidewalk delivery by integrating Diligent's Moxi robots, targeting recurring healthcare automation revenues and more autonomy data.

zacks.com2026-05-15

Serve Robotics Slips 16% YTD: Should Investors Buy the Stock or Fold?

Serve Robotics Inc. SERV has plummeted 15.8% year to date, outperforming the Zacks Computers - IT Services industry, but underperforming the broader Zacks Computer and Technology sector and the S&P 500 Index, as evidenced by the chart below. Since the launch of its first IPO, the company has been reporting losses, which have widened over the quarters, especially from the third quarter of 2025.

youtube.com2026-05-14

Serve Robotics (SERV) CEO on Y/Y Revenue Surge & Future of AI Robots

Serve Robotics (SERV) CEO Ali Kashani discusses the company's 578% year-over-year revenue growth and why the focus is shifting from expansion to improving monetization per robot. He says AI robot capabilities will continue to improve over time, with hospitals and healthcare emerging as major long-term opportunities.

zacks.com2026-05-14

SERV's Revenue-per-Robot Push Deepens: Can Monetization Improve?

Serve Robotics is prioritizing higher revenue per robot in 2026, shifting from fleet growth to utilization, integrations and recurring platform revenues.

marketbeat.com2026-05-08

Serve Robotics Q1 Earnings Call Highlights

Serve Robotics NASDAQ: SERV reported sharply higher first-quarter 2026 revenue and reiterated its full-year outlook, as management said the company is shifting from building out its robot fleet toward improving utilization, revenue per robot and operating leverage across food delivery and healthcare automation.

seekingalpha.com2026-05-08

Serve Robotics Inc. (SERV) Q1 2026 Earnings Call Transcript

Serve Robotics Inc. (SERV) Q1 2026 Earnings Call Transcript

zacks.com2026-05-07

Compared to Estimates, Serve Robotics Inc. (SERV) Q1 Earnings: A Look at Key Metrics

Although the revenue and EPS for Serve Robotics Inc. (SERV) give a sense of how its business performed in the quarter ended March 2026, it might be worth considering how some key metrics compare with Wall Street estimates and the year-ago numbers.

zacks.com2026-05-07

Serve Robotics Inc. (SERV) Reports Q1 Loss, Beats Revenue Estimates

Serve Robotics Inc. (SERV) came out with a quarterly loss of $0.65 per share in line with the Zacks Consensus Estimate. This compares to a loss of $0.16 per share a year ago.

📊 AI Financial Analysis

Powered by StockMarketInfo
Earnings Data: Q Ending 2026-03-31

"SERV reported Q1 2026 revenue of $2.98M and net income of -$49.0M (EPS -$0.65). Versus the same quarter last year (Q1 2025), revenue rose sharply (about +578% YoY, from $0.44M to $2.98M) while net income worsened (net loss -$49.0M vs -$13.2M, or ~+271% deterioration YoY). QoQ comparisons show revenue jumped from $0.88M in Q4 2025 to $2.98M in Q1 2026 (about +238% QoQ), but profitability deteriorated: net loss expanded from -$34.3M in Q4 2025 to -$49.0M in Q1 2026 (~-43% QoQ). Margins remain deeply negative. Gross margin was -301.6% in Q1 2026, and operating/net margins were -17.4% and -16.4%, respectively—still improved versus Q4’s -38.9% net margin but far from sustainable. Operating cash flow was -$41.4M and free cash flow -$42.9M in Q1 2026, reflecting ongoing cash burn. Balance-sheet liquidity is strong with $187.5M cash + short-term investments and $34.1M total assets, and leverage is low (net debt -$42.3M), but cash decreased by ~$59.1M during the quarter. Shareholder returns appear positive on momentum: the stock is up ~+76.9% over 1 year (plus no dividends reported). Revenue and Earnings-based metrics were not applicable for this analysis due to the company's pre-revenue status. The evaluation focused on cash runway, burn rate, and market sentiment instead."

Revenue Growth

Fair

Revenue surged +578% YoY (Q1 2026: $2.98M vs Q1 2025: $0.44M) and +238% QoQ (vs $0.88M in Q4 2025), but results are volatile and profitability remains distressed.

Profitability

Neutral

Margins are still heavily negative. Net margin was -16.4% in Q1 2026, better than Q4 2025 (-38.9%) but far from profitability; EPS declined from -$0.46 (Q4) to -$0.65 (Q1).

Cash Flow Quality

Neutral

Operating cash flow was -$41.4M and free cash flow -$42.9M in Q1 2026, indicating continued burn. No dividends; buybacks are not shown.

Leverage & Balance Sheet

Positive

Liquidity is solid with $187.5M cash/short-term investments and low leverage (net debt -$42.3M). Total current ratio is very high (~10.2x), supporting resilience despite losses.

Shareholder Returns

Positive

Strong 1-year price momentum (+76.9%). With no dividend, total shareholder return is primarily capital appreciation.

Analyst Sentiment & Valuation

Caution

Price target consensus is $16.33 vs current $9.57, implying upside, but valuation is difficult to underwrite given persistent losses and volatile margins.

Disclaimer:This analysis is AI-generated for informational purposes only. Accuracy is not guaranteed and this does not constitute financial advice.

Fundamentals Overview

Loading fundamentals overview...

So what: SERV is demonstrating early, accelerating commercialization of its autonomy stack. Q1 revenue was about $3M (+238% sequential, +578% YoY) with nearly half of revenue described as recurring and $1.4M of recurring revenue. Fleet growth is explosive (fleet ~$2M; daily active robots +48% sequential to 812; daily supply hours averaging 10,000+ up 54% sequential), but profitability remains heavily investment-stage: GAAP gross margin -302% and fleet gross margin still negative, though software gross margin turned positive. The company’s 2026 plan is to convert robot scale into revenue per robot and per supply hour, supported by autonomy improvements and reduced human touch points, while layering software, data, branding, and Diligent’s healthcare automation for a more durable recurring mix. Outlook is constructive but uneven: Q2 growth is expected to slow as it expands coverage and partnerships with no incremental sidewalk robot deployments beyond 2,000. Named market wins and DoorDash/Diligent integration provide catalysts, while regulation, societal acceptance, and sustained margin pressure are key headwinds.

AI IconGrowth Catalysts

  • Fleet revenue grew from ~$200k in Q1 2025 to nearly $2M in Q1 2026 (order-of-magnitude YoY).
  • Daily active robots increased 10x YoY; daily supply hours up 13x YoY; combined Moxie/Serve provide 10,000+ robot supply hours daily with 800+ robots active every day.
  • Recurring revenue mix improved: just under half of total revenue recurring; Q1 recurring revenue was ~$1.4M.

Business Development

  • New autonomous delivery markets live: Buckhead, Fort Lauderdale, Alexandria.
  • Regulatory/pilot progress: City of Vancouver (Canada) approved a motion to enable robot deployments (pilot; pending provincial work).
  • Hospital networks acquired via Diligent Robotics acquisition/integration (hospital pipeline described as healthy).
  • Partner momentum: DoorDash delivery volume growing faster than other partners; ~6x merchant count since beginning of 2026; additional mention of Uber and DoorDash as platforms (plus future additional platforms).

AI IconFinancial Highlights

  • Revenue ~$3M: up ~238% sequentially and ~578% YoY; also described as nearly 3.5x sequential and ~7x YoY in earlier framing.
  • Pro forma including Diligent: revenue +28% sequentially and +30% YoY.
  • Fleet revenue ~$2M; software revenue ~$1M; software gross margin positive while fleet gross margin remained negative; gross margin -302% (as-reported).
  • Recurring revenue ~$1.4M in Q1.
  • GAAP gross loss ~$9M; GAAP net loss $49M (-$0.65 EPS); non-GAAP net loss $38M (-$0.50 EPS).
  • Non-GAAP operating expense guidance reiterated for 2026: $160M-$170M.
  • Capital structure/holdings: ended with $197.4M cash & marketable securities; net cash used in operating activities $41.4M.

AI IconCapital Funding

  • No buyback disclosed in transcript.
  • Cash & marketable securities: $197.4M at quarter end.
  • Investing cash outflows $19.6M driven primarily by acquisition activity.
  • Capex ~$1.4M in the quarter.

AI IconStrategy & Ops

  • Q2 expected growth to be slower as the company focuses on expanding geographic coverage/partnerships and operational efficiency rather than adding new sidewalk robots beyond the existing 2,000 fleet.
  • Shift levers: improve utilization/activate more merchants, integrate more delivery platforms, expand into new cities/neighborhoods; convert each active robot/supply hour into more revenue via density, merchant coverage, speed, productivity, and autonomy improvements reducing human touch points.
  • Automation/technology emphasis: connectivity layer commercialization (robot internet connectivity for data sharing/support) already in progress with customers; additional monetization expected to be shared in next few months.
  • Integration of Diligent Robotics into the same autonomy platform to extend indoor capability and expand into recurring hospital workflows.

AI IconMarket Outlook

  • Reiterated 2026 revenue guidance: $26M.
  • Management expects Q2 growth to be slower; growth re-accelerates in 2H as geographic coverage and partnerships/capabilities expand.
  • Back half of 2026 expected to see more growth on the fleet side as revenue per robot per supply hour becomes the dominant scaling focus (no fleet/software split guidance).

AI IconRisks & Headwinds

  • Growth cadence risk: Q1 growth included significant investment; management explicitly expects slower growth in Q2 while expanding coverage and capabilities.
  • Operational scaling constraints: improvements require solutions to policy/societal acceptance and integration into services people use daily, which take effort and time.
  • Margin pressure remains: gross margin -302% with fleet gross margin still negative even as software gross margin is positive.

Q&A: Analyst Interest

  • Autonomy/cadence improvements: Management described that autonomy speed improvements scale “hand in hand,” because robots move faster when they perceive the world better via increased capability. They did not provide a numeric schedule, but emphasized ongoing investment and that autonomy remains a key lever for delivery-time cadence.
  • Demand and optimization learnings: Management said demand shows “no constraint” (infinite TAM framing) while the limiting factors are policy acceptance and integration complexity. For optimization, they cited market-dependent variables—where robots are sent, job acceptance distance/time tradeoffs, and neighborhood-level customization—enabled by the platform.
  • Regulatory expansion and partner mix: Management stated regulation determines where to pursue expansion based on permission to operate plus receptive demand/partner/platform ecosystem and operational setup competence. They confirmed Vancouver approval for a pilot (pending provincial steps) and that DoorDash momentum is strong, with ~6x merchant count since early 2026.

Sentiment: MIXED

Note: This summary was synthesized by AI from the SERV Q1 2026 earnings transcript. Financial data is complex; please verify all metrics against official SEC filings before making investment decisions.

📋 Official Regulatory 10-K / 10-Q SEC Filings

Direct authenticated documentation links to audited SEC database reports for SERV.

SEC EDGAR Live Feed
Loading financial data and tables...
📁

SEC Filings (SERV)

© 2026 Stock Market Info — Serve Robotics Inc. (SERV) Financial Profile