Tronox Holdings plc

Tronox Holdings plc (TROX) Market Cap

Tronox Holdings plc has a market capitalization of $1.17B.

Price: $7.34

-0.47 (-6.02%)

Market Cap: 1.17B

NYSE · time unavailable

CEO: John D. Romano

Sector: Basic Materials

Industry: Chemicals

IPO Date: 2010-12-01

Website: https://www.tronox.com

Tronox Holdings plc (TROX) - Company Information

Market Cap: 1.17B|Sector: Basic Materials

Company Profile

Tronox Holdings plc operates as a vertically integrated manufacturer of TiO2 pigment in North America, South and Central America, Europe, the Middle East, Africa, and the Asia Pacific. The company operates titanium-bearing mineral sand mines; and engages in beneficiation and smelting operations. It offers TiO2 pigment; ultrafine specialty TiO2; zircon; feedstock; pig iron; titanium tetrachloride; and other products. The company's products are used for the manufacture of paints, coatings, plastics, and paper, as well as various other applications. Tronox Holdings plc is based in Stamford, Connecticut.

Analyst Sentiment

42%
Underperform

From 8 Active Polls

1Y Forecast: $8.00

▲ +9.0% Potential Upside

Consensus Target Metrics

Low Bound

$4

Median

$9

High Bound

$10

Average

$8

Price & Moving Averages

Loading chart...

🎯 Wall Street Analyst Intelligence Report

1-Year structural target targets, chart projections, and sentiment maps.

Average 1Y Target
$8.00
▲ +8.99% Upside
Low Target
$4.00
-46% Risk
Median Target
$9.00
23% Mid
High Target
$10.00
36% Max
Consensus
Hold
6 / 17 Buys

Consensus Trend Projection

Trailing closures vs. 12-month metrics map.

Analyst Vote Distribution

Aggregate institutional coverage sentiment weights.

📊 Historical Valuation Multiples

Real-time Trailing Twelve Month (TTM) momentum side-by-side with discrete quarterly metrics.

Fiscal QuarterTTMQ1 2026Q4 2025Q3 2025Q2 2025Q1 2025Q4 2024Q3 2024Q2 2024
Period EndingTrailing 12MMar 31, 2026Dec 31, 2025Sep 30, 2025Jun 30, 2025Mar 31, 2025Dec 31, 2024Sep 30, 2024Jun 30, 2024
Market Cap ($M)1,1711,5526616388031,1131,5912,3132,508
Enterprise Value ($M)1,3851,7664,0403,8603,8634,0784,4305,0865,237
Price to Earnings Ratio (P/E)-2.52-3.77-0.94-1.61-2.39-2.51-13.26-23.1339.18
Price/Earnings-to-Growth Ratio (PEG)-0.78-0.25-0.276.59
Price to Sales Ratio (P/S)0.402.040.910.911.101.512.352.883.06
Price to Book Ratio (P/B)0.901.200.470.410.490.670.901.211.32
Price to Free Cash Flow Ratio (P/FCF)-4.26-11.3312.48-4.69-14.60-7.84-45.47-165.2129.85
Enterprise Value to Sales (EV/Sales)2.325.575.525.285.536.556.336.39
Enterprise Value to EBITDA (EV/EBITDA)5.7537.5884.1863.2745.45271.8934.8942.7430.10
Debt to Equity Ratio0.890.262.532.181.941.851.701.541.54

TROX Growth Runway Model

Standard long term linear growth fade

Multi-Stage Discounted Cash Flow Sandbox

Market Price$7.34
Intrinsic Value$17.08
Market Alignment
Undervalued by 132.7%relative to calculated intrinsic value
9.00%
Exp: -5%-5%
i

Growth runway slowdown

This value provides a time window for the growth rate to decline beyond Stage 1 toward the terminal rate. Longer windows are most useful for companies with high growth starting conditions or strong competitive advantages. This option stretches out the growth rate slowdown across 5, 10, or 15-year steps. A high-growth starting condition (exceeding a 25% initial growth rate) automatically applies a curve decay to simulate realistic, rapid market saturation.
i

Terminal growth rate

With long-term inflation between 3-5%, revenue must grow by that baseline to maintain flat real-world market share. This value sets the permanent terminal growth rate to factor into the valuation beyond the growth slowdown runway toward maturity.

3-Stage Financial Runway Horizon

🧠 Perpetuity Horizon Engine (Stage 3: Post-2035)

Terminal FCF Base$0.22B
Perpetuity TV Value$4.21B
Discounted TV (PV)$1.78B
TV Weighting %53.6%
⚠️
Financial Model Disclaimer & Risk Disclosure: This interactive scenario simulator is an educational sandbox provided strictly for informational and analytical research purposes. Core historical financial statements and consensus estimates are sourced directly via Financial Modeling Prep (FMP). All downstream outputs are entirely deterministic, hypothetical projections generated by combining automated mathematical formulas (including linear interpolation and Gaussian bell-curve decay models) with user-selected variables and third-party financial data inputs. Users assume all liability for trading decisions executed based on these sandbox calculations.

📘 Full Research Report

ℹ️

AI-Generated Research: This report is for informational purposes only.

📘 TRONOX HOLDINGS PLC (TROX) — Investment Overview

🧩 Business Model Overview

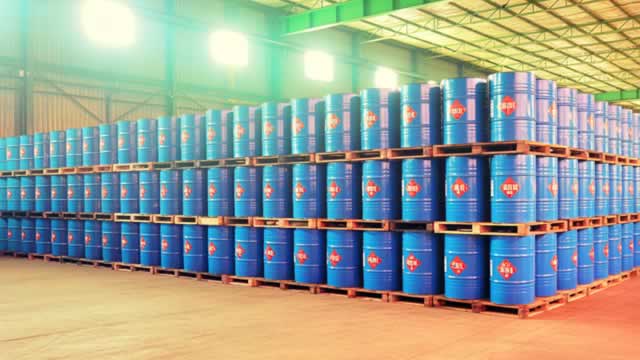
Tronox is a global producer of titanium dioxide (“TiO₂”) pigments and related titanium-based products. The business converts naturally occurring titanium feedstocks (primarily ilmenite and related concentrates) into finished pigment through energy- and capital-intensive processing routes. Finished TiO₂ pigment is then sold to manufacturers of paints, coatings, plastics, and paper—industries where performance and consistency matter.

The economic logic is centered on (1) securing cost-competitive feedstock supply, (2) running large, chemically complex plants efficiently (utilization and yield), (3) managing logistics from mine-to-plant and plant-to-customer (ports, transshipment, and regional distribution), and (4) meeting strict product specifications that support customer qualification and procurement continuity.

💰 Revenue Streams & Monetisation Model

Revenue is primarily driven by the sale of TiO₂ pigment (a largely commodity-like product with performance grades) and by titanium-related chemical products. Monetisation is tied to:

  • Pricing vs. utilization: Pigment demand is tied to end-market activity (construction/coatings and plastics), while plant utilization affects unit costs and margins.
  • Product mix: Higher-grade and specialty specifications typically support better realized pricing, partially offsetting input cost cycles.
  • Processing cost discipline: Operating efficiency, energy consumption per unit, and yield/throughput materially influence gross margin.

While revenue can be cyclical, the margin structure is supported by cost positioning—especially feedstock economics and operational reliability—rather than recurring software-like revenue streams.

🧠 Competitive Advantages & Market Positioning

Tronox competes in global pigment and titanium product markets against several large, established producers. The core moat is best characterized as a geographic + cost advantage coupled with operational scale, reinforced by qualification-driven switching costs in pigment applications.

  • Low-cost feedstock access and conversion know-how (Cost Advantage): Pigment economics hinge on the landed cost of titanium feedstock and the ability to convert it efficiently into saleable pigment. Tronox’s competitiveness depends on sourcing flexibility, process discipline, and reliable plant performance.
  • Logistical infrastructure and regional footprint (Geographic Cost Advantage): Transport and handling costs can swing competitiveness. A scaled footprint with access to shipment routes and customer regions helps reduce delivered costs relative to less integrated peers.
  • Qualification/technical specification requirements (Switching Costs): TiO₂ pigment performance affects hiding power, brightness/whiteness, dispersion, and end-use stability. Customers typically qualify suppliers and maintain stable procurement to minimize formulation risk and requalification costs, creating practical stickiness once approved.

Competitive benchmarking:

  • Chemours (TiO₂): Emphasizes differentiated pigment offerings and a global manufacturing base. Tronox’s positioning is more directly tied to cost/feedstock economics and plant execution.
  • Cristal (TiO₂): Competes through its manufacturing footprint and product portfolio across regions. Tronox competes with a focus on feedstock/processing economics and logistical reach.
  • Venator (TiO₂): Participates across pigment grades and coatings-related markets. Tronox’s relative competitiveness is driven by lower delivered production costs and operational reliability rather than premium-only product strategy.

🚀 Multi-Year Growth Drivers

Over a 5–10 year horizon, growth is expected to be driven less by “new technology adoption” and more by the expansion and mix of end-use markets and the ability to maintain an advantaged cost structure through industry cycles.

  • Construction and coatings demand (housing, infrastructure modernization, and maintenance painting) supports steady long-run pigment consumption.
  • Plastics penetration in packaging, consumer goods, and durable applications sustains demand for brightening agents like TiO₂.
  • Product performance requirements (better brightness, durability, and processing characteristics) encourage qualified supplier relationships, supporting share stability for cost-competitive producers.
  • Industry consolidation / discipline in capital allocation: High capital intensity and environmental compliance requirements tend to favor balance-sheet strength and operational excellence, which can support long-run profitability through cycles.

Given the commodity exposure, the central multi-year question is not whether demand grows, but whether Tronox can protect margins through cost leadership and maintain capacity/asset integrity through cycle downturns.

⚠ Risk Factors to Monitor

  • Feedstock and energy input volatility: Landed feedstock economics and energy costs can compress margins rapidly, especially during utilization swings.
  • Capacity additions and pricing cycles: TiO₂ markets can experience pricing pressure from industry capacity expansions or temporary oversupply.
  • Environmental and regulatory liabilities: Titanium pigment production is sensitive to permitting, emissions controls, and waste handling requirements; compliance costs can rise and liabilities can be material.
  • Execution risk in complex, capital-intensive plants: Operational upsets, maintenance outages, and yield variability can affect cost position and customer supply continuity.
  • Working capital and credit conditions: Cyclical commodity businesses can experience swings in inventory and receivables; refinancing risk and covenant headroom matter in downturns.

📊 Valuation & Market View

Markets typically value TiO₂ and other heavy chemical producers on EV/EBITDA and related cash-flow metrics because earnings are heavily utilization- and pricing-driven. The principal variables that move valuation multiples are:

  • Cost position and margin durability (feedstock advantage, energy efficiency, and operating reliability).
  • Through-cycle cash generation under commodity price cycles.
  • Balance sheet resilience (net debt, liquidity, and refinancing terms), especially after downturns.
  • Market capacity discipline (supply-demand balance and the likelihood of sustained pricing support).

Given cyclicality, investors often underwrite on expected mid-cycle margins and a normalization framework rather than on peak-cycle fundamentals.

🔍 Investment Takeaway

Tronox’s long-term investment case rests on defending a cost-and-logistics-driven position in TiO₂ through commodity cycles, supported by practical customer qualification switching costs and the ability to execute within complex, capital-intensive operations. The risk profile remains tied to input volatility, environmental compliance, and industry pricing cycles; therefore, sustained value creation depends on maintaining cost leadership and balance-sheet flexibility through downturns.


⚠ AI-generated — informational only. Validate using filings before investing.

📰 Market News & Coverage

15 Stories Available

Real-time institutional reporting and market updates for TROX.

zacks.com2026-06-05

Tronox (TROX) Down 7.2% Since Last Earnings Report: Can It Rebound?

Tronox (TROX) reported earnings 30 days ago. What's next for the stock?

zacks.com2026-05-13

Tronox Q1 Earnings Miss Estimates, Sales Rise Y/Y On Higher Volumes

TROX beats Q1 revenue estimates as higher TiO2 and zircon volumes offset pricing pressure, while the company sees stronger Q2 demand and cash flow.

seekingalpha.com2026-05-07

Tronox Holdings plc (TROX) Q1 2026 Earnings Call Transcript

Tronox Holdings plc (TROX) Q1 2026 Earnings Call Transcript

zacks.com2026-05-06

Tronox (TROX) Q1 Earnings: Taking a Look at Key Metrics Versus Estimates

Although the revenue and EPS for Tronox (TROX) give a sense of how its business performed in the quarter ended March 2026, it might be worth considering how some key metrics compare with Wall Street estimates and the year-ago numbers.

zacks.com2026-05-06

Tronox (TROX) Reports Q1 Loss, Tops Revenue Estimates

Tronox (TROX) came out with a quarterly loss of $0.55 per share versus the Zacks Consensus Estimate of a loss of $0.49. This compares to a loss of $0.15 per share a year ago.

prnewswire.com2026-05-06

Tronox Reports First Quarter 2026 Financial Results

STAMFORD, Conn., May 6, 2026 /PRNewswire/ -- Tronox Holdings plc (NYSE:TROX) ("Tronox" or the "Company"), the world's leading integrated manufacturer of titanium dioxide ("TiO2") pigment, today reported its financial results for the quarter ending March 31, 2026, as follows: First Quarter 2026 Financial Highlights: Revenue of $760 million, a 4% increase compared to the prior quarter and a 3% increase compared to the prior year Loss from operations of $41 million; Net loss attributable to Tronox of $103 million including $15 million of restructuring and other charges, net of taxes, primarily associated with the closure of the Company's Botlek and Fuzhou pigment plants; Adjusted net loss attributable to Tronox was $88 million (non-GAAP) GAAP diluted loss per share was $0.65; Adjusted diluted loss per share was $0.55 (non-GAAP) Adjusted EBITDA of $62 million; Adjusted EBITDA margin of 8.2% (non-GAAP) Capital expenditures of $67 million in the quarter Updated Outlook: Expect free cash flow to be positive in Q2 2026, largely offsetting Q1 cash use; Expect to deliver meaningful positive free cash flow for full year 2026 Expect Q2 2026 TiO2 volumes to increase sequentially in the high single-digit percentage range Expect Q2 2026 zircon volume levels to moderate slightly compared to Q1 TiO2 and zircon Q2 2026 volumes could be higher, depending on regional inventory availability TiO2 and zircon pricing both expected to improve sequentially in the mid-single-digit percentage range in Q2 2026 as a result of announced price increases and cost input-related surcharges Q2 2026 Adjusted EBITDA expected to be $65-$85 million This outlook is based on Tronox's views on current global economic activity and is subject to changes and impacts associated with the general macroeconomic, geopolitical, and industry-related conditions, global supply chain, and inflation-related challenges, among others.

zacks.com2026-04-30

Olin (OLN) Expected to Beat Earnings Estimates: Can the Stock Move Higher?

Olin (OLN) possesses the right combination of the two key ingredients for a likely earnings beat in its upcoming report. Get prepared with the key expectations.

zacks.com2026-04-29

Analysts Estimate Tronox (TROX) to Report a Decline in Earnings: What to Look Out for

Tronox (TROX) doesn't possess the right combination of the two key ingredients for a likely earnings beat in its upcoming report. Get prepared with the key expectations.

prnewswire.com2026-04-28

Tronox Declares Second Quarter 2026 Dividend

STAMFORD, Conn., April 28, 2026 /PRNewswire/ -- Tronox Holdings plc (NYSE:TROX), the world's leading integrated manufacturer of titanium dioxide pigment, announced today that its Board of Directors declared a quarterly dividend of $0.05 per share.

zacks.com2026-04-16

TROX's Rare-Earth Option and China Exit Could Reshape 2026

Tronox's China exit, pricing push and rare-earths option set the stage for 2026, but weak margins and uneven demand still cloud the recovery path.

zacks.com2026-04-16

What Drives Tronox Holdings' TiO2 Cycle and Cash Recovery

TROX navigates a TiO2 downturn as volumes rebound late 2025 and cost cuts, pricing moves set up cash flow recovery into 2026.

zacks.com2026-04-16

TROX Trades at a Discounted Valuation: Time to Buy the Stock?

TROX has surged 76.8% and trades at a discount, but weak margins, high debt and cautious EBITDA outlook keep the buy case far from clear.

prnewswire.com2026-04-09

Tronox Announces Dates for First Quarter 2026 Earnings Release & Webcast Conference Call

STAMFORD, Conn., April 9, 2026 /PRNewswire/ -- Tronox Holdings plc (NYSE: TROX) announced today the following schedule for its first quarter 2026 earnings release and webcast conference call: Earnings Release: Wednesday, May 6, 2026, after market close via PR Newswire and the Tronox Holdings plc website: tronox.com Webcast Conference Call: Thursday, May 7, 2026 at 9:00 AM ET (New York).

defenseworld.net2026-04-06

JPMorgan Chase & Co. Reduces Holdings in Tronox Holdings PLC $TROX

JPMorgan Chase and Co. reduced its stake in Tronox Holdings PLC (NYSE: TROX) by 59.2% during the third quarter, according to its most recent filing with the Securities and Exchange Commission (SEC). The firm owned 625,842 shares of the company's stock after selling 909,659 shares during the period. JPMorgan Chase and Co. owned

defenseworld.net2026-03-09

Tronox Holdings PLC $TROX Position Boosted by Citigroup Inc.

Citigroup Inc. increased its position in Tronox Holdings PLC (NYSE: TROX) by 693.0% in the third quarter, according to its most recent disclosure with the SEC. The institutional investor owned 469,051 shares of the company's stock after purchasing an additional 409,902 shares during the period. Citigroup Inc. owned 0.30% of Tronox worth $1,886,000

📊 AI Financial Analysis

Powered by StockMarketInfo
Earnings Data: Q Ending 2026-03-31

"TROX reported Q1 2026 revenue of $760.0M and net income (EPS) of -$0.103M (-$0.65). On a YoY basis (vs. Q1 2025), revenue rose from $738.0M to $760.0M (+3.0% YoY), while net income improved from -$111.0M to -$103.0M (about +7.2% YoY improvement). QoQ (vs. Q4 2025), revenue increased from $730.0M to $760.0M (+4.1% QoQ), but net losses widened from -$176.0M to -$103.0M (net loss narrowed by +41.5% QoQ). Profitability deteriorated over the trailing 4-quarter period: gross margin collapsed to ~0.006% in Q1 2026 from 13.4% in Q1 2025, and operating margin remained deeply negative (-3.6%). Net margin in Q1 2026 was essentially breakeven-to-loss at -0.014%, but this is not improving fundamentally given prior quarters’ swings and very high cost levels (interest expense also elevated at $53.0M). Cash flow quality weakened sharply: operating cash flow was -$70.0M in Q1 2026 versus +$121.0M in Q4 2025, and free cash flow was -$67k (capex was minimal). Balance sheet shows declining equity (to ~$1.29B) while net debt remains high (~$2.14B) though for this context we focus on stability signals: liquidity remains low (cash $126k) which is a key risk. Shareholder returns are strong: the stock is up ~76.1% over 1Y, indicating strong capital appreciation (dividend yield ~0.0005% is immaterial). Analyst consensus targets ($7.5) sit below the current price ($9.12), suggesting near-term upside may be limited despite momentum."

Revenue Growth

Neutral

Revenue increased to $760.0M (+4.1% QoQ; +3.0% YoY). Growth is positive but modest relative to the volatility seen across prior quarters.

Profitability

Neutral

Operating and net margins remain negative in Q1 2026 (operating margin -3.55%; net margin -0.0135%). Over the 4-quarter span, gross margin compressed dramatically (from 13.4% in Q1 2025 to ~0.006% in Q1 2026), indicating margin structure deterioration despite a modest YoY improvement in net loss.

Cash Flow Quality

Caution

Operating cash flow swung to -$70.0M in Q1 2026 from +$121.0M in Q4 2025, and was also negative vs earlier quarters. With dividends ~- $8k (negligible), there is no shareholder cash return support from current earnings.

Leverage & Balance Sheet

Caution

Equity declined to ~$1.29B in Q1 2026 (from ~$1.45B in Q4 2025). Liquidity is extremely thin (cash $126k) and net debt remains high (~$2.14B), reducing resilience versus earnings volatility.

Shareholder Returns

Good

Strong total return from capital appreciation: price is up 76.1% over 1Y, which is well above the >20% momentum threshold. Dividend contribution is negligible (~0.0005% yield) and buybacks are not evidenced in cash flow.

Analyst Sentiment & Valuation

Fair

Consensus target ($7.5) is below the current price ($9.12), implying upside/valuation support may be limited despite strong recent momentum.

Disclaimer:This analysis is AI-generated for informational purposes only. Accuracy is not guaranteed and this does not constitute financial advice.

Fundamentals Overview

Loading fundamentals overview...

Q1 2026 showed resilient demand translating into stronger volumes (TiO2 highest Q1 since 2022; zircon best since Q4 2021) and better-than-expected top line, but earnings lagged due to cost and pricing/mix pressures. Adjusted EBITDA was $62m (8.2% margin), down 45% YoY, reflecting unfavorable pricing/mix, FX and freight headwinds, and raw-material escalation tied to Middle East sulfur dynamics. Management emphasized price actions and targeted surcharges, but warned of timing lag—especially Bahia surcharge benefit beginning May 1. The company is guiding Q2 adjusted EBITDA to $65m–$85m, with TiO2 volumes high single-digit sequential growth and TiO2 pricing mid-single-digit vs Q1, while zircon pricing momentum carries into Q3. Despite a Q1 FCF use of $135m, cash conversion improved through ~$75m inventory reduction, and management expects Q2 free cash flow to be positive and to rebound most of Q1 usage. Key near-term risk is sulfur availability/cost volatility versus offsetting benefits from trade defense and inventory sell-through.

AI IconGrowth Catalysts

  • TiO2 volumes reached highest Q1 level since 2022; zircon delivered strongest performance since Q4 2021
  • Structural benefits from antidumping measures in Europe, Brazil, and Saudi Arabia driving positive trade flow and volume trends
  • Industry production curtailments tightening supply dynamics supporting TiO2 price momentum through the year

Business Development

  • Australian government awarded Tronox federal major project status for rare earths; posted on Australian government site (announced earlier in week; posted 'this morning')
  • UK and Australia opened antidumping investigations against Chinese TiO2 (U.K. launched antidumping initiative; potential provisional duties discussed for 'maybe sometime in the third quarter')

AI IconFinancial Highlights

  • Revenue $760m (+3% YoY) driven by higher TiO2 and zircon volumes
  • Adjusted diluted EPS: loss of $0.55
  • Adjusted EBITDA $62m; EBITDA margin 8.2%
  • Loss from operations $41m; net loss attributable to Tronox $103m
  • Adjusted EBITDA down 45% YoY to $62m due to unfavorable pricing/mix, exchange-rate headwinds, higher production and freight costs (partially offset by higher volumes and SG&A savings); sequential adjusted EBITDA +9%
  • Restructuring and other charges: $15m net of taxes, mainly closures of Botlek and Fuzhou
  • Free cash flow: use of $135m; working capital use ~$59m (excluding $19m restructuring cash payments)
  • Inventory reduction: approximately $75m in Q1
  • Debt/liquidity: total debt $3.3b; net debt $3.2b; liquidity $406m (incl. $126m cash); next major debt maturity in 2029; ~74% of interest rates fixed through 2028
  • Q2 cost headwind vs Q1 from planned outages/maintenance: $10m to $15m
  • Q2 adjusted EBITDA guidance: $65m to $85m
  • Q2 TiO2 pricing expected to increase mid-single-digit vs Q1; TiO2 volumes high single-digit sequential increase

AI IconCapital Funding

  • Upsized AR securitization facility by $25m in Q1; added additional $20m earlier in the week
  • Returned $8m to shareholders via dividends during Q1
  • Repayed $40m Saudi EXIM facility in Q1; renewal discussions ongoing (renewal not yet reflected in liquidity)
  • Capital expenditures: $67m in Q1
  • Planned 2026 capex assumption: approximately $260m
  • Cash flow assumptions embedded in 2026 positive cash flow outlook: net cash interest ~$190m; net cash taxes < $10m; working capital source of cash well in excess of $100m

AI IconStrategy & Ops

  • Cost improvement program on track for $125m to $175m of run-rate savings by end of 2026
  • Deliberate cash/inventory actions late last year continued into Q1: lowering operating rates and idling 2 mines in one of the furnaces in South Africa
  • Q1 ramped up operating rates at pigment plants to meet increased demand
  • Q2 planned operational downtime: west mine and 1 furnace in Namakwa idled; Wonnerup idled; two meaningful planned outages in Q2 (one pigment side, one feedstock side); reline of SR kiln underway (planned ~4-year cycle referenced); pigment plant outage impacts costs near-term
  • Working capital efficiency actions: inventory reductions driven by targeted initiatives; better-than-expected sales line performance and inventory conversion

AI IconMarket Outlook

  • Q2 2026 guidance: TiO2 volumes high single-digit sequential increase; TiO2 pricing mid-single-digit increase vs Q1; zircon volumes to moderate slightly; zircon pricing momentum into Q3 expected
  • Q2 adjusted EBITDA expected $65m to $85m
  • Q2 free cash flow expected positive, clawing back a large majority of Q1 cash used
  • Full-year 2026: confidence in meaningful positive free cash flow; guided cash assumptions include: net cash interest ~$190m, net cash taxes < $10m, capex ~$260m, and working capital cash inflow > $100m

AI IconRisks & Headwinds

  • Middle East conflict driving higher raw material costs (notably sulfur/sulfuric acid) and logistics impacts; sulfur price in China referenced as increasing ~160% since end of 2024 (Q4 call) and 'almost 300%' at time of Q1 call
  • Sulfur availability constraints impacting sulfate TiO2 producers (sulfate technology ~80% of China capacity); potential knock-on effects on TiO2 production/shipments
  • Q2 EBITDA headwind from planned outages/maintenance totaling $10m to $15m vs Q1
  • Exchange-rate headwinds and higher freight costs contributing to YoY EBITDA decline
  • India: temporary stay on duties impacted Asia Pacific volumes (management noted more resilient than expected)
  • Potential delay/lag between surcharges taking effect and operating cost impact (surcharge benefit lag into Q2; largest Bahia facility sulfur surcharge went into effect May 1, leaving April without benefit)

Q&A: Analyst Interest

  • Topic: What conditions determine where TROX lands within the Q2 adjusted EBITDA $65m–$85m range. Management linked the low end to volume shortfalls from order-book fill limits, cited planned outages/outage timing for upside, and highlighted surcharge timing lag from sulfur-driven costs (Bahia May 1).
  • Topic: How costs flow through the P&L and when they normalize on a run-rate basis across Q2–Q4. Management explained Q1 cost impacts from selling higher-cost inventory and production slowdowns; quantified Q2 operating impacts ($10m–$15m net) and estimated $20m–$25m isolated operating effects, expecting uplift in Q3/Q4 absent unplanned outages.
  • Topic: Working-capital bridge from Q1 free cash flow use of $135m to expected Q2 positivity. Management attributed most Q2 improvement to inventory conversion (built via Q1 inventory reduction of ~$75m) and working-capital structural timing, while noting interest timing differences: Q2 and Q4 include ~$50m interest payments impacting cash patterns.

Sentiment: MIXED

Note: This summary was synthesized by AI from the TROX Q1 2026 earnings transcript. Financial data is complex; please verify all metrics against official SEC filings before making investment decisions.

📋 Official Regulatory 10-K / 10-Q SEC Filings

Direct authenticated documentation links to audited SEC database reports for TROX.

SEC EDGAR Live Feed
Loading financial data and tables...
📁

SEC Filings (TROX)

© 2026 Stock Market Info — Tronox Holdings plc (TROX) Financial Profile