Exxon Mobil Corporation

Exxon Mobil Corporation (XOM) Market Cap

Exxon Mobil Corporation has a market capitalization of .

No quote data available.

CEO: Darren W. Woods

Sector: Energy

Industry: Oil & Gas Integrated

IPO Date: 1978-01-13

Website: https://corporate.exxonmobil.com

Exxon Mobil Corporation (XOM) - Company Information

Market Cap: -|Sector: Energy

Company Profile

Exxon Mobil Corporation explores for and produces crude oil and natural gas in the United States and internationally. It operates through Upstream, Downstream, and Chemical segments. The company is also involved in the manufacture, trade, transport, and sale of crude oil, natural gas, petroleum products, petrochemicals, and other specialty products; manufactures and sells petrochemicals, including olefins, polyolefins, aromatics, and various other petrochemicals; and captures and stores carbon, hydrogen, and biofuels. As of December 31, 2021, it had approximately 20,528 net operated wells with proved reserves. The company was founded in 1870 and is headquartered in Irving, Texas.

Analyst Sentiment

66%
Buy

From 25 Active Polls

1Y Forecast: $170.08

▲ +0.0% Potential Upside

Consensus Target Metrics

Low Bound

$123

Median

$175

High Bound

$185

Average

$170

Price & Moving Averages

Loading chart...

🎯 Wall Street Analyst Intelligence Report

1-Year structural target targets, chart projections, and sentiment maps.

Average 1Y Target
$170.08
▲ +13.45% Upside
Low Target
$123.00
-18% Risk
Median Target
$175.00
17% Mid
High Target
$185.00
23% Max

Consensus Trend Projection

Trailing closures vs. 12-month metrics map.

Analyst Vote Distribution

Aggregate institutional coverage sentiment weights.

Sentiment volume allocation data unavailable.

Historical valuation matrix unavailable.

📘 Full Research Report

ℹ️

AI-Generated Research: This report is for informational purposes only.

📘 EXXON MOBIL CORP (XOM) — Investment Overview

🧩 Business Model Overview

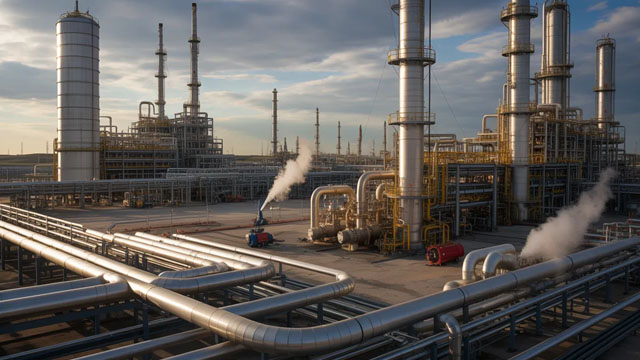
Exxon Mobil operates an integrated energy value chain spanning upstream production (finding and developing oil and gas resources), midstream/logistics (transporting and storing crude and natural gas through long-lived infrastructure), downstream refining (converting crude into fuels and feedstocks), and chemicals/lubricants (supplying higher-spec products used across industrial and consumer end markets). The integration matters: production volumes and feedstock costs influence refinery economics, while downstream demand and product yields can partially offset upstream commodity cycle pressure through cross-optimisation and internal transfer economics. The company also leverages extensive trading and operational capabilities to allocate crude and gas to the highest-value markets and configurations within its network.

💰 Revenue Streams & Monetisation Model

XOM monetises primarily through commodity-linked, volume-driven activities rather than contractual, recurring fees. Revenue sources include:

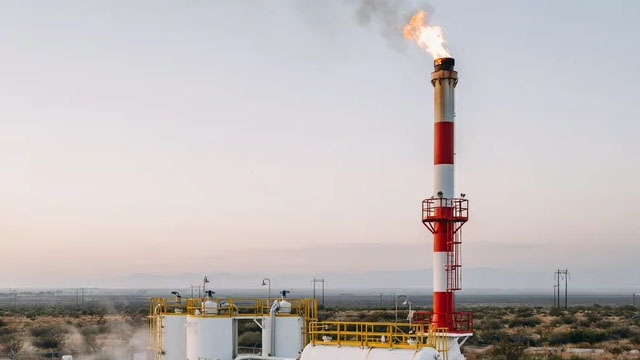
  • Upstream (oil and gas production): cash flows depend on reservoir performance, lifting costs, and realized commodity prices; margins are influenced by natural decline rates and project execution.
  • Downstream (refining and fuels/merchant products): profitability depends on refinery utilization, product demand, and the spread between refined products and crude costs (often described through refining “cracks”).
  • Chemicals and specialty products: margins reflect feedstock economics (often tied to natural gas and liquids differentials), conversion yields, and demand cycles in end markets.
  • Trading, logistics, and services within the value chain: these enhance capture of value by optimizing supply routes, contract structures, and operational reliability.

While all segments ultimately face commodity cycles, the integrated model aims to reduce earnings volatility by balancing exposure across crude, refined products, and gas-linked feedstocks, and by using logistical capabilities to route supply to advantaged markets.

🧠 Competitive Advantages & Market Positioning

Exxon’s moat is best characterized as a blend of geographic cost advantage and logistical infrastructure, reinforced by scale and operational know-how.

  • Low-Cost Feedstock / Resource Base: Leading upstream positions (with a meaningful mix of advantaged resource areas) support lower unit production costs and more resilient project economics across cycles.
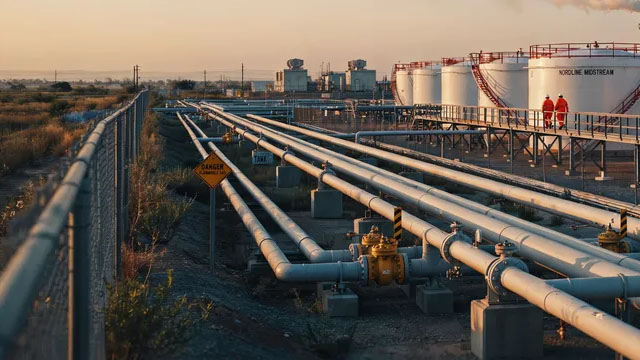
  • Logistical Infrastructure: Long-lived pipelines, terminals, shipping arrangements, and refinery distribution networks lower delivered-cost uncertainty and improve market optionality—important in gas and refined product markets where transportation constraints materially affect realized margins.
  • Scale and Integration: Integration provides practical “internal hedging” through feedstock-to-product conversion and optimization across assets, improving the company’s ability to sustain margins relative to less integrated peers.

Competitive benchmarking:

  • Chevron (CVX) and Shell (SHEL): Similar integrated model characteristics, but their asset concentration and geographic footprints differ; XOM’s relative advantage is often tied to the depth of advantaged resource areas and the breadth of downstream/logistics connectivity supporting value capture.
  • BP (BP) and TotalEnergies (TTE): Competitors with large integrated footprints; relative performance frequently hinges on portfolio mix (resource quality, LNG exposure, refining configuration) and cycle navigation rather than structural pricing power.

Unlike commodity-focused producers without comparable downstream/logistics reach, Exxon’s model emphasizes converting physical scale and infrastructure into more consistent delivered-cost advantages across the value chain.

🚀 Multi-Year Growth Drivers

Over a 5–10 year horizon, growth is expected to be driven less by “volume growth at any cost” and more by capital allocation discipline, advantaged projects, and structural demand for hydrocarbons in transportation fuels, industrial feedstocks, and petrochemicals.

  • Gas and LNG market structure: Demand growth and regional supply imbalances support continued utilization of LNG and gas-linked value chains, where logistics and contracting capabilities influence realized economics.
  • Petrochemicals and industrial feedstocks: Chemical demand tied to industrial activity sustains the need for reliable feedstock supply and efficient conversion—areas where scale and integration can matter.
  • Upstream project selection and cost discipline: Maintaining a competitive cost base and executing projects with strong engineering reliability supports longer-duration free cash flow generation through the cycle.
  • Energy transition execution (selective): Incremental investments that strengthen energy security (e.g., improved efficiency, lower-carbon operations within existing assets) can protect cash flows while preserving optionality for future demand mix shifts.

⚠ Risk Factors to Monitor

  • Commodity price and crack/spread volatility: Oil and refined product spreads can compress sharply, affecting upstream and downstream margins simultaneously.
  • Regulatory and carbon policy risk: Carbon pricing, emissions standards, and permitting constraints can increase costs and shorten the economic life of some assets.
  • Stranded-asset and capital intensity risk: Large, long-duration capital programs require disciplined selection; errors in timing, technology assumptions, or demand forecasts can impair returns.
  • Execution and operational risk: Major projects and complex logistics create exposure to schedule slippage, cost overruns, and safety/environmental incidents.
  • Demand substitution risk: Electrification and efficiency improvements can structurally reduce demand for certain refined products, shifting regional utilization patterns.

📊 Valuation & Market View

The market typically values integrated energy companies through cash-flow durability and return of capital capacity, often expressed via EV/EBITDA and EV/operating cash flow frameworks, with a premium/discount influenced by expected capital intensity and cycle sensitivity. Drivers that move the valuation include:

  • Normalized free cash flow outlook: the ability to generate cash across commodity cycles.
  • Capital allocation credibility: disciplined investment pacing, balance sheet strength, and consistent capital returns.
  • Segment resilience: relative performance of upstream lifting cost competitiveness, downstream reliability, and feedstock economics.

Because earnings are commodity-linked, investor focus tends to shift from accounting earnings to cash generation, reinvestment rates, and downside protection measures.

🔍 Investment Takeaway

Exxon Mobil’s long-term investment case rests on a structural advantage in low-cost supply and logistical infrastructure that supports more stable value capture across upstream, refining, and chemicals. The integrated model does not eliminate commodity cycles, but it can improve resilience and optimize realized economics by routing production through an extensive connected network. For investors, the core thesis is sustained cash generation through disciplined capital allocation and asset execution, supported by durable cost and logistics advantages.


⚠ AI-generated — informational only. Validate using filings before investing.

📊 AI Financial Analysis

Powered by StockMarketInfo
Earnings Data: Q Ending 2026-03-31

"XOM reported Q1 2026 revenue of $83.16B and net income of $4.18B (EPS $1.00). On a YoY basis (vs. Q1 2025), revenue rose +2.64% and net income declined -45.85% (EPS from 1.76 to 1.00). Sequentially (vs. Q4 2025), revenue increased +3.99%, but net income fell -35.68% (EPS from 1.53 to 1.00). Profitability contracted: net margin dropped to 5.03% from 8.12% in Q4 2025 and from 9.52% in Q1 2025. Gross profit margin also fell sharply versus Q4 (37.71% vs. 18.89%), but operating and net income both deteriorated, suggesting cost/other line volatility and/or lower effective profitability in the quarter. Operating cash flow declined to $8.71B from $12.68B in Q4, and free cash flow slipped to $2.24B from $5.23B. The company continued shareholder returns via buybacks (-$4.87B) and dividends (-$4.33B), supporting capital return even as profitability weakened. Balance sheet remains resilient for a major integrated oil & gas operator: total assets rose to $464.41B and total equity was stable at ~$261B, while net debt increased to ~$39.23B from ~$59.58B in Q4. Shareholder returns are strong: the stock is up +40.55% over the last year, which should materially boost total return versus dividends (current dividend yield ~0.61%)."

Revenue Growth

Positive

Revenue grew +3.99% QoQ (Q1 2026 vs. Q4 2025) and +2.64% YoY (Q1 2026 vs. Q1 2025), indicating modest top-line improvement despite industry cyclicality.

Profitability

Neutral

Net income fell -35.68% QoQ and -45.85% YoY. Net margin contracted to 5.03% from 8.12% (Q4) and 9.52% (Q1 2025), showing clear profitability deterioration.

Cash Flow Quality

Fair

Operating cash flow declined to $8.71B from $12.68B QoQ; free cash flow decreased to $2.24B from $5.23B. However, cash generation remained positive and supported buybacks and dividends.

Leverage & Balance Sheet

Good

Total assets increased to $464.41B and equity was stable at ~$261.0B. Net debt improved to ~$39.23B from ~$59.58B in Q4, supporting resilience.

Shareholder Returns

Strong

Strong total return momentum: 1Y price change +40.55%. Capital returns continued with buybacks (-$4.87B) and dividends (-$4.33B); dividend yield is ~0.61% but buybacks plus price performance drive returns.

Analyst Sentiment & Valuation

Neutral

Consensus target ($161.08) is below the current price ($146.44) is inconsistent with provided target-metric structure; using the stated target, implied upside/downside appears limited-to-moderate. Valuation indicators provided show elevated earnings multiple (price/earnings ~42.4), implying the market discounts future normalization.

Disclaimer:This analysis is AI-generated for informational purposes only. Accuracy is not guaranteed and this does not constitute financial advice.

Fundamentals Overview

Loading fundamentals overview...

XOM’s Q1 narrative is execution-led: it repeatedly quantified operational actions that offset regional energy-system disruption. In downstream, management cited record Gulf Coast utilization and a March throughput jump of ~200,000 bbl/d versus February, supporting strong Energy Products earnings of $2.8B (up $2.0B YoY). In upstream, they highlighted portfolio resilience—excluding external disruptions, upstream production rose 8% YoY—and reaffirmed Permian growth to 1.8 million oil-equivalent bbl/d in 2026, with Guyana at record production and late-2026 first oil for Uaru. LNG is positioned as both immediate and medium-term: Golden Pass Train 1 first LNG in March with ~5% export uplift vs 2025; Train 2 mechanically complete by end-2026; Train 3 into Q2’27. The primary risk theme is Strait reopening timing (1–2 month lag) and multi-year Qatar train repairs (3–5 years), with return-on-capital and partnership win-win emphasized rather than contract specifics.

AI IconGrowth Catalysts

  • Golden Pass LNG Train 1 first LNG achieved in March; Train 1 expected to increase U.S. exports ~5% vs 2025
  • Golden Pass LNG Train 3 mechanically complete targeted for the second quarter of next year
  • Guyana record production and continued reliability; Uaru expecting first oil late this year; Uaru/Whiptail/Hammerhead under construction
  • Permian full-year 2026 production growth guided to 1.8 million oil-equivalent bbl/d (growth grounded in value, not volume)
  • Low Carbon Solutions: transporting/storing captured CO2 from New Generation Gas Gathering; plan to start facilities adding ~4 million tons/year of CO2 capacity through 2025-2026

Business Development

  • Golden Pass LNG joint venture with QatarEnergy (repair participation on two damaged trains discussed)
  • Guyana long-term investment: $100 million over 10 years committed to STEM education via national STEM education support
  • LNG project pipeline development: Papua New Guinea and Mozambique (FID discussions expected later this year)

AI IconFinancial Highlights

  • Energy Products (downstream) made $2.8 billion in the quarter (excluding identified/timing items context); up $2.0 billion vs last year and a few hundred million vs Q4
  • March refining throughput increased by ~200,000 bbl/d vs February (described as equivalent to a midsized refinery), attributed to bringing back refineries from turnaround/deferred maintenance without impacting safety/reliability
  • Upstream performance ex-external impacts: excluding external disruptions (Middle East impacts, Kazakhstan drone attacks, January Permian winter storm), upstream production up 8% year-over-year
  • No explicit EPS or revenue beats vs consensus provided in the provided transcript excerpt; discussion references EPS up vs Q4 2025 on an adjusted basis (excluding identified items and estimated timing effects)

AI IconCapital Funding

  • No buyback, debt levels, or cash runway figures were provided in the transcript excerpt

AI IconStrategy & Ops

  • Supply chain execution: rapid alternate routings from U.S. Gulf Coast to Asia; real-time vessel visibility maintained deliveries globally
  • Refining optimization: deferred some maintenance/times earlier by assessing whether safely deferable units could be restarted to respond to demand pressure
  • Technology/automation: Guyana first deepwater fully autonomous well section using rig automation and automated downhole steering
  • Enterprise transformation milestone: successful launch of a new workforce enablement system simplifying processes and streamlining payroll across more than 50 countries (no business disruption)

AI IconMarket Outlook

  • Middle East / Strait reopening: management expects a 1- to 2-month time lag between Strait opening and market seeing normal flow due to ship repositioning/backlog/transit
  • QatarEnergy damaged trains repair horizon: described as ~3% of global production exposure; QatarEnergy indicated repairs may take 3 to 5 years (management targeting low end)
  • LNG timing: Train 2 expected mechanically complete by end of 2026; Train 3 mechanically complete headed into Q2 2027

AI IconRisks & Headwinds

  • Potential for continued upward pressure on oil/natural gas prices if Strait closure persists and commercial inventory reaches minimum working levels
  • Long repair timelines for the two damaged Qatar LNG trains (force majeure/contract extension mechanics not disclosed in detail); return-on-capital requirement emphasized
  • External disruptions beyond Middle East: drone attacks in Kazakhstan and January winter storm impacts in Permian highlighted as factors affecting quarterly results (management claims resilience when excluded)

Q&A: Analyst Interest

  • Topic: Middle East/Strait reopening timeline and longer-term market price/margin impacts: Management cited inventory on water, released SPR and drawdowns as reasons full impacts hadn’t hit yet, then expected a 1-to-2 month lag post-reopening, plus inventory replenishment demand and possible Iran-related risk premium. They expect supply ramp after cooling LNG trains in weeks and repair horizon for damaged Qatar trains of 3-5 years.
  • Topic: Downstream refining margins and balancing opportunities amid disruption: Management linked higher margins to never losing focus on a robust advantaged refining network, highlighting Beaumont expansion investment paid back fully, record Gulf Coast utilization in Q1, and expediting turnarounds/assessing safe deferrals. They quantified March production +200,000 bbl/d vs February and attributed execution to logistics plus an upgraded trading organization.
  • Topic: LNG concentration with QatarEnergy and implications of damaged-train repairs/contract risk: Management emphasized strong QatarEnergy partnership and commitment to win-win win repairs ensuring capital returns, but avoided specific force majeure/contract extension mechanics. They argued LNG investment is driven by low-cost advantaged returns, not panic, and reaffirmed pipeline Mozambique/Papua New Guinea plus Golden Pass Trains 2/3 timing.

Sentiment: POSITIVE

Note: This summary was synthesized by AI from the XOM Q1 2026 earnings transcript. Financial data is complex; please verify all metrics against official SEC filings before making investment decisions.

Loading financial data and tables...
© 2026 Stock Market Info — Exxon Mobil Corporation (XOM) Financial Profile