Zurn Elkay Water Solutions Corporation

Zurn Elkay Water Solutions Corporation (ZWS) Market Cap

Zurn Elkay Water Solutions Corporation has a market capitalization of $7.94B.

Price: $47.37

-0.08 (-0.17%)

Market Cap: 7.94B

NYSE · time unavailable

CEO: Todd A. Adams

Sector: Industrials

Industry: Industrial - Pollution & Treatment Controls

IPO Date: 2012-03-29

Website: https://zurnwatersolutions.com

Zurn Elkay Water Solutions Corporation (ZWS) - Company Information

Market Cap: 7.94B|Sector: Industrials

Company Profile

Zurn Elkay Water Solutions Corporation designs, procures, manufactures, and markets water system solutions that provide and enhance water quality, safety, flow control, and conservation in and around non-residential buildings. It offers finish plumbing, drainage and interceptors, water control and backflow, fire protection, PEX pipe fittings and accessories, and repair parts under the Zurn brand name; and hand and hair dryers, and baby changing stations under the World Dryer brand name. The company also offers stainless steel products under the Just Manufacturing brand name, which include stainless steel sinks for classrooms and academic institutions; ADA commercial stainless-steel sinks and plumbing fixtures for assisted living; faucets, bubblers, drains, and accessories; and stainless steel fixtures and related products for food services, government, healthcare, hospitality, institutional, and residential markets. It serves higher education, healthcare, retail, restaurant, hospitality, education, government, and fire protection markets. The company was formerly known as Zurn Water Solutions Corporation. Zurn Elkay Water Solutions Corporation was incorporated in 2006 and is headquartered in Milwaukee, Wisconsin.

Analyst Sentiment

63%
Buy

From 10 Active Polls

1Y Forecast: $54.71

▲ +15.5% Potential Upside

Consensus Target Metrics

Low Bound

$50

Median

$55

High Bound

$58

Average

$55

Price & Moving Averages

Loading chart...

🎯 Wall Street Analyst Intelligence Report

1-Year structural target targets, chart projections, and sentiment maps.

Average 1Y Target
$54.71
▲ +15.50% Upside
Low Target
$50.00
6% Risk
Median Target
$55.00
16% Mid
High Target
$58.00
22% Max
Consensus
Hold
3 / 8 Buys

Consensus Trend Projection

Trailing closures vs. 12-month metrics map.

Analyst Vote Distribution

Aggregate institutional coverage sentiment weights.

📊 Historical Valuation Multiples

Real-time Trailing Twelve Month (TTM) momentum side-by-side with discrete quarterly metrics.

Fiscal QuarterTTMQ1 2026Q4 2025Q3 2025Q2 2025Q1 2025Q4 2024Q3 2024Q2 2024
Period EndingTrailing 12MMar 31, 2026Dec 31, 2025Sep 30, 2025Jun 30, 2025Mar 31, 2025Dec 31, 2024Sep 30, 2024Jun 30, 2024
Market Cap ($M)7,9367,5197,7977,9076,1615,6186,3636,1304,965
Enterprise Value ($M)8,2007,7838,0928,2016,5166,0306,7166,4965,347
Price to Earnings Ratio (P/E)37.2431.9246.3031.9930.5032.2143.7035.2326.98
Price/Earnings-to-Growth Ratio (PEG)5.0413.042.136.602.64
Price to Sales Ratio (P/S)4.5617.3719.1517.3613.8614.4517.1614.9512.05
Price to Book Ratio (P/B)4.944.684.864.973.943.634.013.863.11
Price to Free Cash Flow Ratio (P/FCF)24.75176.1094.5184.2160.64145.54116.7570.6261.90
Enterprise Value to Sales (EV/Sales)17.9719.8718.0114.6615.5118.1215.8412.98
Enterprise Value to EBITDA (EV/EBITDA)22.1393.6698.9275.9466.6970.0492.7771.7058.12
Debt to Equity Ratio0.710.330.370.350.360.360.350.350.34

ZWS Growth Runway Model

Standard long term linear growth fade

Multi-Stage Discounted Cash Flow Sandbox

Market Price$47.37
Intrinsic Value$36.79
Market Alignment
Overvalued by 22.3%relative to calculated intrinsic value
9.00%
Exp: 1%1%
i

Growth runway slowdown

This value provides a time window for the growth rate to decline beyond Stage 1 toward the terminal rate. Longer windows are most useful for companies with high growth starting conditions or strong competitive advantages. This option stretches out the growth rate slowdown across 5, 10, or 15-year steps. A high-growth starting condition (exceeding a 25% initial growth rate) automatically applies a curve decay to simulate realistic, rapid market saturation.
i

Terminal growth rate

With long-term inflation between 3-5%, revenue must grow by that baseline to maintain flat real-world market share. This value sets the permanent terminal growth rate to factor into the valuation beyond the growth slowdown runway toward maturity.

3-Stage Financial Runway Horizon

🧠 Perpetuity Horizon Engine (Stage 3: Post-2035)

Terminal FCF Base$0.44B
Perpetuity TV Value$8.30B
Discounted TV (PV)$3.50B
TV Weighting %58.3%
⚠️
Financial Model Disclaimer & Risk Disclosure: This interactive scenario simulator is an educational sandbox provided strictly for informational and analytical research purposes. Core historical financial statements and consensus estimates are sourced directly via Financial Modeling Prep (FMP). All downstream outputs are entirely deterministic, hypothetical projections generated by combining automated mathematical formulas (including linear interpolation and Gaussian bell-curve decay models) with user-selected variables and third-party financial data inputs. Users assume all liability for trading decisions executed based on these sandbox calculations.

📘 Full Research Report

ℹ️

AI-Generated Research: This report is for informational purposes only.

📘 ZURN ELKAY WATER SOLUTIONS CORP (ZWS) — Investment Overview

🧩 Business Model Overview

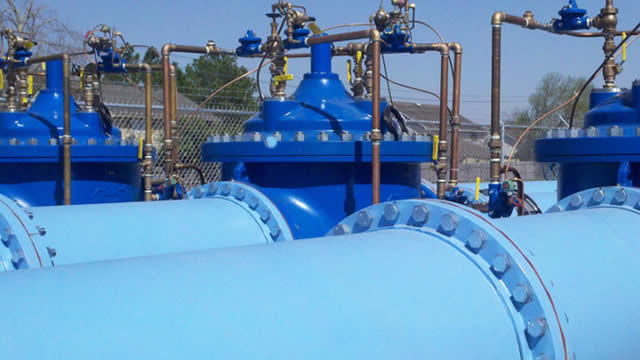
ZURN ELKAY WATER SOLUTIONS CORP supplies engineered water delivery and plumbing solutions used in commercial, institutional, and industrial construction as well as in building retrofit programs. The company’s value chain spans (1) product design and compliance engineering, (2) manufacturing of water-related components and fixtures, (3) distribution through plumbing supply channels and contractors, and (4) specification support for architects, engineers, and facilities teams.

Customer adoption is driven by code compliance, performance requirements, and specification practices in non-residential buildings. Once systems are specified—such as drinking fountains, sinks, valves, and related water-control components—substitution often becomes difficult due to permitting, functional verification, and installer familiarity.

💰 Revenue Streams & Monetisation Model

Revenue primarily comes from the sale of plumbing/water products through distribution and project-based channels. Monetisation is less reliant on software-like recurring revenue and more anchored in:

  • Project and retrofit demand (new construction and maintenance/renovation cycles).
  • Product portfolio breadth across drinking, handwashing, water control, and drainage-related categories—enabling multi-SKU purchases within customer projects.
  • Mix and pricing tied to engineered versus commodity-adjacent products; engineered components typically support better gross margin resilience.

Margin drivers tend to center on manufacturing efficiency, component/input cost pass-through ability, product mix, and working-capital discipline through the distribution channel.

🧠 Competitive Advantages & Market Positioning

Moat thesis: specification-driven switching costs plus regulatory/compliance barriers.

ZWS benefits from an ecosystem where distributors, contractors, and specifiers rely on consistent product performance and code alignment. Competitors can sell individual SKUs, but taking share across project cycles often requires:

  • Engineering and compliance readiness for specific building standards and health/safety codes.
  • Specification inertia once architects/engineers list products for water systems.
  • Qualification by installers and purchasing managers based on prior reliability and lead times.

These factors create practical switching costs for customers and reduce the likelihood of rapid, “pure-price” displacement.

Competitive benchmarking:

  • Watts Water Technologies — more focused on water control and treatment-related components, often competing on valves and flow/pressure solutions rather than the full commercial fixture breadth.
  • Sloan (commercial faucets/flush and related water products) — strong in commercial washroom systems, where differentiation often comes from product performance and spec relationships.
  • Kohler / American Standard–type fixture suppliers — broader fixture ecosystems, competing for specification opportunities in commercial bathrooms and hospitality/healthcare settings.

Compared with these rivals, ZWS’s positioning emphasizes integrated coverage across water delivery and commercial plumbing categories, supporting cross-category specification and procurement within projects—an advantage when customers seek fewer suppliers and validated system compatibility.

🚀 Multi-Year Growth Drivers

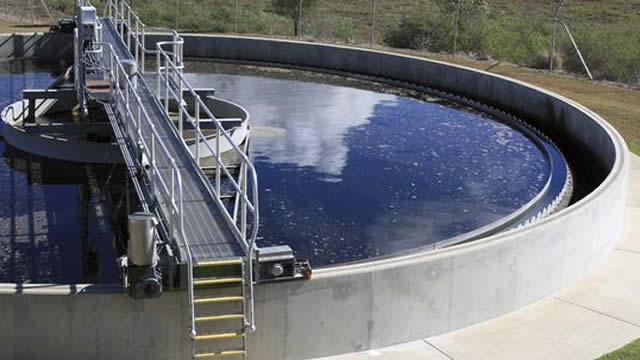
  • Water efficiency and conservation mandates that raise demand for compliant, efficient plumbing fixtures and water-control components.
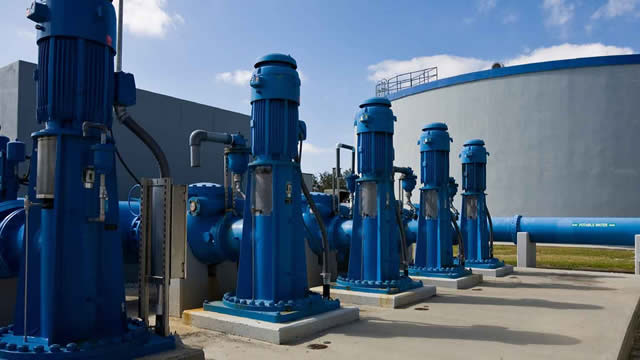
  • Retrofit and replacement of aging infrastructure in commercial buildings, schools, healthcare facilities, and industrial campuses—often driven by compliance updates and lifecycle replacement.
  • Non-residential construction and occupancy-driven capex (office, education, healthcare, manufacturing expansion), which sustains fixture and component replacement needs.
  • Health and safety standards that shape product selection for public-facing water use (drinking, handwashing, and washroom systems).
  • End-market complexity favoring engineered products: projects with strict performance requirements tend to reward suppliers with design support, documentation, and code-aligned manufacturing.

⚠ Risk Factors to Monitor

  • Construction cycle sensitivity: new construction volumes can influence ordering patterns, especially in commercial projects.
  • Input cost volatility and pass-through limits: metals and other components can pressure margins if pricing power is constrained.
  • Channel inventory swings: plumbing distribution channels can normalize or deplete inventory, affecting near-term demand visibility.
  • Regulatory changes: revisions to plumbing codes or performance requirements may require manufacturing changes and documentation upgrades.
  • Competition and customer consolidation: large buyers may leverage scale to pressure pricing, and competitors can win projects by matching compliance specs at lower cost.
  • Execution risk in product launches or portfolio actions: maintaining quality, lead times, and supply continuity is essential for project-based specification adoption.

📊 Valuation & Market View

Markets typically value ZWS and similar industrial/distribution-linked manufacturers on earnings power and cash-generation rather than on high-multiple growth narratives. The sector’s valuation often reflects:

  • EV/EBITDA and P/E frameworks driven by expected margin stability and durability of end-market demand.
  • Gross margin and operating leverage (mix shift toward engineered products, cost control, and pricing discipline).
  • Working-capital efficiency given the influence of distribution inventory cycles.
  • Quality of end-market mix (public/institutional retrofit exposure can be less volatile than purely new-build-heavy profiles).

Key valuation “movers” generally include sustainable margin improvement, evidence of share stability in specification-driven categories, and consistency in cash conversion through inventory and receivables management.

🔍 Investment Takeaway

ZWS presents an evergreen investment profile anchored by practical switching costs in specification-based commercial plumbing and by compliance-driven adoption barriers. Over a multi-year horizon, demand should be supported by water-efficiency policy, ongoing non-residential retrofit needs, and the structural requirement for code-aligned, engineered water solutions—factors that can help stabilize earnings power through construction cycles while providing room for margin resilience via mix and execution.


⚠ AI-generated — informational only. Validate using filings before investing.

📰 Market News & Coverage

15 Stories Available

Real-time institutional reporting and market updates for ZWS.

gurufocus.com2026-05-28

A Look at Zurn Elkay Water Solutions Corp (ZWS) After 3.7% Decline -- GF Value $40.08 vs Price $47.01

On May 28, 2026, Zurn Elkay Water Solutions Corp (ZWS) shares fell 3.7% to $47.01, continuing a downward trend over the past month with a total decline of 9.6%.

businesswire.com2026-05-27

Zurn Elkay Water Solutions Announces Executive Promotions

MILWAUKEE--(BUSINESS WIRE)-- #sustainablyinspired--Zurn Elkay Water Solutions Corporation (NYSE: ZWS) announced today the promotion of Dave Pauli, 44, to the position of Chief Operating Officer (COO), reporting to Todd A. Adams, Chairman and CEO. Pauli will oversee all of the company's operations, supply chain management and information technology, focusing on operational excellence and executing the company's strategic plan initiatives. Dan Klun, 51, is being promoted to the role of Chief Financial Officer (CFO), al.

businesswire.com2026-05-26

Uvalde CISD and Zurn Elkay Announce Donation for Cleaner, Healthier, Safer Drinking Water

UVALDE, Texas--(BUSINESS WIRE)-- #sustainablyinspired--Zurn Elkay Water Solutions Corporation (NYSE: ZWS) and Uvalde Consolidated Independent School District (UCISD) today announced the donation of 36 Elkay Pro FiltrationTM filtered bottle filling stations, 19 Elkay® ezH2O® filtered bottle filling stations, 73 Elkay filtration conversion kits and five years of Elkay filters for each of the donated units, ensuring consistent delivery of cleaner, healthier, safer drinking water to students, faculty, staff and community.

zacks.com2026-05-15

3 Stocks to Buy From the Growing Waste Removal Services Market

The Zacks Waste Removal Services industry is anticipated to gain from the rising need for ESG Goals, technological developments and innovation in WTE technology. CLH, VEOEY and ZWS are well-poised to gain from growing demands.

businesswire.com2026-04-30

Zurn Elkay Water Solutions Declares Quarterly Cash Dividend

MILWAUKEE--(BUSINESS WIRE)--Zurn Elkay Water Solutions Declares Quarterly Cash Dividend.

zacks.com2026-04-27

Are You Looking for a Top Momentum Pick? Why Zurn Water (ZWS) is a Great Choice

Does Zurn Water (ZWS) have what it takes to be a top stock pick for momentum investors? Let's find out.

businesswire.com2026-04-27

USA TODAY Again Names Zurn Elkay Water Solutions One of America's Climate Leaders 2026

MILWAUKEE--(BUSINESS WIRE)-- #sustainablyinspired--Zurn Elkay Water Solutions Corporation (NYSE: ZWS) has been named one of America's Climate Leaders 2026 for the second consecutive year by USA Today and Statista. The recognition highlights the U.S.-based companies that have reduced their greenhouse gas (GHG) emissions intensity the most between 2022 and 2024, as measured by GHG emissions relative to revenue. According to Statista's analysis, Zurn Elkay achieved a 21.3% reduction in greenhouse gas intensity over the.

businesswire.com2026-04-23

Zurn Elkay Associates Again Rate Company a Top Workplace in USA Today/Energage Survey

MILWAUKEE--(BUSINESS WIRE)-- #EmployeeEngagement--Zurn Elkay Water Solutions (NYSE: ZWS) earned recognition as one of the Top Workplaces USA 2026 and Top Workplaces Southeast Wisconsin 2026. The lists are issued by HR research and technology company Energage and partners USA Today and Milwaukee Journal Sentinel and honor organizations that have created exceptional, people-first cultures. “Recognition like this is meaningful because it comes directly from our associates,” said Todd A. Adams, Chairman and CEO. “It ref.

seekingalpha.com2026-04-22

Zurn Elkay Water Solutions Corporation (ZWS) Q1 2026 Earnings Call Transcript

Zurn Elkay Water Solutions Corporation (ZWS) Q1 2026 Earnings Call Transcript

zacks.com2026-04-21

Zurn Water (ZWS) Tops Q1 Earnings and Revenue Estimates

Zurn Water (ZWS) came out with quarterly earnings of $0.41 per share, beating the Zacks Consensus Estimate of $0.37 per share. This compares to earnings of $0.31 per share a year ago.

businesswire.com2026-04-21

Zurn Elkay Water Solutions Reports First Quarter 2026 Financial Results

MILWAUKEE--(BUSINESS WIRE)--Zurn Elkay Water Solutions Reports First Quarter 2026 Financial Results.

gurufocus.com2026-04-15

Zurn Elkay Water Solutions Corp (ZWS) Shares Fall 4.0% -- GF Value Says Still Overvalued

On April 15, 2026, Zurn Elkay Water Solutions Corp (ZWS) shares fell 4.0% to a current price of $47.39. The stock has experienced a 52-week range between $29.27

zacks.com2026-04-10

Zurn Water (ZWS) Upgraded to Buy: Here's What You Should Know

Zurn Water (ZWS) has been upgraded to a Zacks Rank #2 (Buy), reflecting growing optimism about the company's earnings prospects. This might drive the stock higher in the near term.

businesswire.com2026-04-08

Zurn Elkay Water Solutions Schedules First Quarter 2026 Earnings Release and Investor Conference Call

MILWAUKEE--(BUSINESS WIRE)--Zurn Elkay Water Solutions Schedules First Quarter 2026 Earnings Release and Investor Conference Call.

defenseworld.net2026-04-08

SG Americas Securities LLC Sells 29,279 Shares of Zurn Elkay Water Solutions Cor $ZWS

SG Americas Securities LLC trimmed its stake in Zurn Elkay Water Solutions Cor (NYSE: ZWS) by 49.9% during the undefined quarter, according to the company in its most recent disclosure with the Securities and Exchange Commission. The fund owned 29,390 shares of the company's stock after selling 29,279 shares during the period. SG

📊 AI Financial Analysis

Powered by StockMarketInfo
Earnings Data: Q Ending 2026-03-31

"Revenue rose to $433.0M in 2026-03-31, up +6.3% QoQ from $407.2M and +11.3% YoY from $388.8M. Net income increased to $58.9M (+39.9% QoQ; +35.1% YoY), with EPS of $0.35 improving +40.0% QoQ and +34.6% YoY. Profitability strengthened materially: net margin expanded to ~13.6% (58.9/433.0) from ~10.3% in 2025-12-31, and from ~11.2% a year earlier—indicating improved operating leverage despite some quarter-to-quarter revenue volatility (notably the higher 2025-09-30 revenue). From a balance sheet perspective, ZWS is showing resilience and deleveraging. Total assets were roughly flat to slightly up QoQ ($2.68B), while total equity improved to $1.61B. Net debt fell to $263.6M, down ~10.6% QoQ and ~36.0% YoY, which supports financial flexibility. Shareholder returns have been strong: the stock gained +61.3% over the last 1 year (well above the 20% momentum threshold). Dividend yield is low (~0.24%), so total return is driven primarily by capital appreciation. With consensus upside suggested by the $55 median target versus a $47.75 price, analyst sentiment appears constructive."

Revenue Growth

Good

Latest revenue of $433.0M grew +6.3% QoQ and +11.3% YoY. Over the 4 quarters, revenue trended higher overall but showed some fluctuation (e.g., 2025-09-30 strength vs 2025-03-31 softness).

Profitability

Strong

Net income jumped to $58.9M (+39.9% QoQ; +35.1% YoY). Net margin expanded to ~13.6% from ~10.3% QoQ, indicating strong margin recovery/improved leverage; EPS rose in line with earnings.

Cash Flow Quality

Positive

Net income is growing rapidly, but cash flow specifics were not provided. With a modest dividend payout ratio (latest ~31%), income generation appears supportive, though buyback/cash return details are limited in the dataset.

Leverage & Balance Sheet

Good

Total assets are stable-to-slightly higher and equity improved ($1.61B). Net debt declined to $263.6M (−10.6% QoQ; −36.0% YoY), improving balance sheet resilience.

Shareholder Returns

Strong

Total return momentum is strong: +61.3% 1-year price change (major positive). Dividend yield is low (~0.24%), so gains are primarily valuation/momentum-driven rather than income-driven.

Analyst Sentiment & Valuation

Positive

Consensus target ($54) / median ($55) implies upside of roughly 13–15% vs $47.75. However, valuation metrics (e.g., trailing P/E ~32) suggest investors already price in meaningful growth.

Disclaimer:This analysis is AI-generated for informational purposes only. Accuracy is not guaranteed and this does not constitute financial advice.

Fundamentals Overview

Loading fundamentals overview...

Zurn Elkay delivered a strong Q1 with $433M sales (+11% YoY) and adjusted EBITDA of $116M (+18%), expanding margins 160 bps to 26.8%—supported by the Zurn Elkay Business System (#CI productivity), favorable mix (higher-profit categories growing faster), and structural actions in manufacturing and supply chain. Drinking Water and filtration remain key momentum drivers, with double-digit growth in filtered bottle filler installed base and above-double-digit filtration growth; Pro Filtration adoption was singled out for high attachment rates and accelerating traction. Despite residential softness, commercial and institutional activity helped keep results ahead of expectations, and cold-weather break/fix added about 1 point of growth over the first half. The company reiterated Q2 guidance (8%–9% core sales growth; 27.0%–27.5% EBITDA margin) but paused full-year updates due to evolving tariff developments, while stating the 2026 discrete tariff impact remains price/cost positive absent refunds and future price increases. Leverage stayed low at 0.5x, alongside $50M buybacks and revolver upsizing.

AI IconGrowth Catalysts

  • Drinking Water: installed base of filtered bottle fillers growing at double digit; filtration piece growing above double digit
  • Pro Filtration adoption accelerating; high attachment rate driven by customer/end-user/facility manager feedback and technology changes
  • Water Safety and Control and Drains (in Drains business) growing at rates consistent with strong overall category momentum
  • Mix shift toward higher-profit retrofit/replace and higher-margin product growth (company cited productivity initiatives + mix as drivers)

Business Development

  • Customer-driven product development for Pro Filtration based on feedback from customers, end users, and facility managers
  • Manufacturer rep pipeline cited with hyper-local commercial activity drivers (New York examples: Core Weave data center, West Point stadium, JFK Airport, U.S. Open stadium/parking garages, Major League Soccer stadium, Brooklyn Borough jail)

AI IconFinancial Highlights

  • Sales: $433M, up 11% year-over-year (core and reported growth); Q1 end markets mostly in line with Feb guidance despite residential softness
  • Adjusted EBITDA: $116M, up 18%; adjusted EBITDA margin expanded 160 bps YoY to 26.8%
  • Free cash flow: $43M; full-year FCF outlook reiterated at approximately $335M with plan to revisit after Q2
  • Share repurchase: $50M at roughly $47/share
  • Net debt leverage: ended at 0.5x (inclusive of the $50M repurchase deployed in the quarter)
  • Q2 guidance: core sales growth 8% to 9% YoY; adjusted EBITDA margin 27.0% to 27.5% (50 to 100 bps expansion YoY)
  • Guidance/tariffs: full-year outlook explicitly assumes current tariff structure remains in place for 2026 and does not assume tariff refund benefits; management views discrete tariff impact remains price/cost positive absent refunds and future price increases

AI IconCapital Funding

  • Capital return: $50M share repurchase in Q1 at ~$47/share
  • Liquidity: upsized and extended revolver from $200M to $550M, extending 5 years
  • M&A posture: continues evaluating M&A funnel; no change to capital allocation priorities (buybacks + dividend noted as ongoing)

AI IconStrategy & Ops

  • Zurn Elkay Business System (#CI) productivity initiatives continuing to drive margin expansion
  • Continuous improvement approach: associate-led #CI ideas submitted at scale (thousands annually); no single idea material but aggregate impact credited
  • Structural changes beyond synergies: consolidating footprint to reduce overhead; deploying Zurn Business System lean tools into Elkay manufacturing facilities
  • Ongoing internal manufacturing vs sourcing review (supply chain described as competitive advantage, including navigation through tariff environment)
  • Portfolio mix statement: slight change toward retrofit/replace with mention of a 5-year shift to ~45% from earlier 45% reference context; company emphasized the business is margin-mix positive
  • Weather: unusually cold weather in portions of the U.S. drove incremental break/fix activity expected to contribute ~1 point of growth over the first half

AI IconMarket Outlook

  • Q2 2026: core sales growth 8%–9% YoY; adjusted EBITDA margin 27.0%–27.5%
  • Full-year 2026: no change to prior framing; management will revisit second half after Q2 results; outlook methodology described as deliberate/conservative
  • Full-year tariff assumption: current tariff structure as of today assumed throughout 2026; excludes potential tariff refund benefits

AI IconRisks & Headwinds

  • Tariff uncertainty: Supreme Court ruling/timing around refunds referenced; implementation changes (122 tariff changes affecting the 232 scheme) and studies on potential Section 301 tariffs create moving parts
  • Inflation pressures: commodities and freight inflation plus Middle East conflict referenced as bubbling factors requiring diligence on pricing
  • Residential softness: residential end markets described as a softness offset to nonresidential strength
  • Guidance pause mechanism risk (per Q&A context): company refrains from updating full-year until after Q2 due to remaining uncertainties, including tariff developments
  • Pricing pass-through not guaranteed for future tariffs: company stated it is not counting on future price increases and relies on product substitution/materials/supply chain mitigation

Q&A: Analyst Interest

  • Drinking Water / Pro Filtration: Management said Drinking Water was “very well” in line with expectations, with filtered bottle filler installed base growing double digit and filtration above double digit. Pro Filtration adoption is being driven by customer and facility manager feedback, producing a high attachment rate and continuing acceleration as specs are updated.
  • Tariff impact / pricing gross effect: Management emphasized uncertainty around 122 expiry and potential 301 implementations, but stated they are not counting on passing future price increases. They highlighted conservative embedded assumptions that net tariff conditions are “about the same as we started the year,” with U.S. sourcing the largest by a “decent margin.”
  • 1Q outperformance drivers & core sales bridge: Management provided a breakdown: 11% reported growth included ~5% price in the remaining components, plus ~1 point from unusually cold weather incremental break/fix. They attributed the rest to strong performance in Water Safety and Control, Drains, and Drinking Water, plus regional wins linked to intentional U.S. resourcing efforts.

Sentiment: MIXED

Note: This summary was synthesized by AI from the ZWS Q1 2026 earnings transcript. Financial data is complex; please verify all metrics against official SEC filings before making investment decisions.

📋 Official Regulatory 10-K / 10-Q SEC Filings

Direct authenticated documentation links to audited SEC database reports for ZWS.

SEC EDGAR Live Feed
Loading financial data and tables...
📁

SEC Filings (ZWS)

© 2026 Stock Market Info — Zurn Elkay Water Solutions Corporation (ZWS) Financial Profile