ConocoPhillips

ConocoPhillips (COP) Market Cap

ConocoPhillips has a market capitalization of $146.78B.

Price: $120.48

1.45 (1.22%)

Market Cap: 146.78B

NYSE · time unavailable

CEO: Ryan Lance

Sector: Energy

Industry: Oil & Gas Exploration & Production

IPO Date: 1981-12-31

Website: https://www.conocophillips.com

ConocoPhillips (COP) - Company Information

Market Cap: 146.78B|Sector: Energy

Company Profile

ConocoPhillips is an energy company that engages in the global exploration, production, transportation, and marketing of various resources, including crude petroleum, bitumen, natural gas, liquefied natural gas (LNG), and natural gas liquids (NGLs). Its primary operations are centered on both conventional and tight oil formations, shale gas, heavy crude, LNG developments, and oil sands projects. The company's extensive portfolio includes unconventional resources located in North America; established conventional assets spanning North America, Europe, Asia, and Australia; numerous LNG ventures; oil sands properties within Canada; and a significant inventory of potential conventional and unconventional exploration opportunities. ConocoPhillips was established in 1917 and its corporate headquarters are situated in Houston, Texas.

Analyst Sentiment

78%
Strong Buy

From 26 Active Polls

1Y Forecast: $140.58

▲ +16.7% Potential Upside

Consensus Target Metrics

Low Bound

$111

Median

$144

High Bound

$183

Average

$141

Price & Moving Averages

Loading chart...

🎯 Wall Street Analyst Intelligence Report

1-Year structural target targets, chart projections, and sentiment maps.

Average 1Y Target
$140.58
▲ +16.68% Upside
Low Target
$111.00
-8% Risk
Median Target
$144.00
20% Mid
High Target
$183.00
52% Max
Consensus
Buy
39 / 52 Buys

Consensus Trend Projection

Trailing closures vs. 12-month metrics map.

Analyst Vote Distribution

Aggregate institutional coverage sentiment weights.

📊 Historical Valuation Multiples

Real-time Trailing Twelve Month (TTM) momentum side-by-side with discrete quarterly metrics.

Fiscal QuarterTTMQ1 2026Q4 2025Q3 2025Q2 2025Q1 2025Q4 2024Q3 2024Q2 2024
Period EndingTrailing 12MMar 31, 2026Dec 31, 2025Sep 30, 2025Jun 30, 2025Mar 31, 2025Dec 31, 2024Sep 30, 2024Jun 30, 2024
Market Cap ($M)146,780161,573115,381117,788112,849133,727119,740122,264133,595
Enterprise Value ($M)164,230179,023132,328136,010131,477151,202139,481135,347147,653
Price to Earnings Ratio (P/E)20.4618.5420.0017.1414.3811.7713.0514.8714.37
Price/Earnings-to-Growth Ratio (PEG)0.902.420.761.36
Price to Sales Ratio (P/S)2.5210.068.677.878.078.138.419.419.83
Price to Book Ratio (P/B)2.282.501.791.811.722.051.852.452.69
Price to Free Cash Flow Ratio (P/FCF)9.54119.9589.109.39567.0848.86105.0442.9468.51
Enterprise Value to Sales (EV/Sales)11.159.949.099.419.199.8010.4210.87
Enterprise Value to EBITDA (EV/EBITDA)6.7127.6823.5922.0021.1919.9723.6122.9623.44
Debt to Equity Ratio0.710.360.360.360.360.360.390.370.37

📘 Full Research Report

ℹ️

AI-Generated Research: This report is for informational purposes only.

📘 CONOCOPHILLIPS (COP) — Investment Overview

🧩 Business Model Overview

ConocoPhillips is an upstream energy producer that creates value by discovering, developing, and producing hydrocarbons—primarily crude oil, natural gas, and NGLs—then monetizing them through contractual and spot sales. The economic engine is rooted in low unit costs and efficient field development: capital deployed into reservoirs (drilling, completion, and facilities) converts subsurface resources into measurable production volumes, which are then transported via gathering systems to processing plants, pipelines, and export-linked infrastructure.

A distinctive element of COP’s model is exposure to gas and LNG-linked dynamics through integrated positions that benefit from existing logistical pathways (processing, pipelines, and shipping/export capability where owned or contracted). This integration improves reliability of physical delivery and can reduce per-unit transportation and commercialization friction versus producers lacking such access.

💰 Revenue Streams & Monetisation Model

Revenue is largely transactional and commodity-priced, driven by volumes produced and the realized pricing of crude, natural gas, and NGLs net of differentials and quality/transport impacts. Monetization is supported by:

  • Oil sales (primarily priced relative to regional benchmarks, adjusted for quality and transportation)
  • Natural gas and NGL sales (priced to regional gas benchmarks and liquids pricing, influenced by basis differentials)
  • LNG and gas commercialization where applicable (pricing tied to regional LNG markets and contract structures)

Margin drivers are typically less about “recurring revenue” mechanics and more about unit economics: (1) lifting costs and operating leverage, (2) transportation and processing fees, (3) realization/differentials, and (4) capital efficiency (cost per barrel of proved and probable reserves added, and the decline profile management of producing assets). Effective capital allocation—deploying into the best returns across core basins and pacing spend through the commodity cycle—materially determines free cash flow generation.

🧠 Competitive Advantages & Market Positioning

COP’s durability is supported by structural advantages common to successful upstream operators: high-quality resource positions, cost discipline, and access to logistical infrastructure that lowers the “delivered” cost of hydrocarbons.

  • Geographic cost advantage (low-cost resource base): COP maintains significant exposure to advantaged U.S. resource plays and other producing regions where development economics can remain competitive across a range of commodity environments. Lower breakevens are driven by resource quality, drilling efficiencies, and an established supply chain for services and equipment in core areas.
  • Logistical infrastructure and commercialization access: gathering networks, processing capability, and pipeline or export-linked routes reduce per-unit transportation friction. This can improve realized volumes and protect economics from capacity constraints that affect producers without comparable infrastructure reach.
  • Operational and technical execution as an intangible asset: repeatable development practices, reservoir understanding, and field optimization create a compounding advantage in reserve recovery and well performance. These capabilities are difficult to replicate quickly due to learning curves and asset-specific engineering knowledge.

Competitive benchmarking:

  • Exxon Mobil (XOM): broader global scale with diversified upstream and major integrated energy exposure. COP’s competitive focus is more concentrated on development efficiency and logistics-connected monetization in specific basins.
  • Chevron (CVX): emphasizes large-scale upstream with significant LNG and global integrated reach. COP tends to compete on cycle-resilient U.S. development economics and operational responsiveness to relative cost positioning.
  • Shell (SHEL): strong LNG and global project portfolio characteristics. COP’s positioning differs by leaning more heavily on advantaged resource development and infrastructure-linked commercialization where its assets and contracting arrangements fit the value chain.

Across these peers, the key contrast is that COP’s moat is less about downstream branding and more about upstream cost and logistics economics—the combination of where it produces and how efficiently it delivers.

🚀 Multi-Year Growth Drivers

Over a 5–10 year horizon, COP’s opportunity set is shaped by both volume growth and the structural evolution of energy demand and supply. The primary growth drivers are:

  • Resource development and drilling efficiency: in core basins, incremental drilling programs and completion design improvements can sustain production profiles even as individual wells experience decline.
  • Enhanced recovery and field optimization: operational practices that improve recovery factors, reduce downtime, and manage decline rates support long-term output durability.
  • Natural gas and LNG-linked demand growth: global power and industrial energy needs create sustained demand for cleaner-burning gas and LNG supply flexibility. Producers with credible delivery access and commercialization capability can capture a portion of this demand growth through contracted and market-exposed sales.
  • Capital discipline and quality of investment: a consistent emphasis on returning capital and funding the highest-return projects can strengthen resiliency in adverse price environments while preserving optionality for favorable cycles.

While the commodity cycle influences profitability, the long-term compounding mechanism is the ability to convert capital into barrels at competitive unit costs, with logistics and technical execution that protect realizations.

⚠ Risk Factors to Monitor

  • Commodity price volatility: crude, gas, and NGL realizations can move materially and impact cash flows, reserve economics, and capital return capacity.
  • Regulatory and climate policy risk: emissions rules, methane regulations, permitting constraints, and carbon pricing can raise costs or delay projects; LNG and gas developments can also face evolving environmental and social approval thresholds.
  • Operational and execution risk: drilling outcomes, facility uptime, and reservoir performance can deviate from plan; midstream or export-linked constraints can affect deliverability.
  • Capital intensity and opportunity cost: upstream returns depend on disciplined spend. Overbuilding capacity in a weak price environment or underinvesting in maintenance can impair long-run production.
  • Geopolitical and counterparty exposure: where assets or supply chains intersect higher-risk jurisdictions or counterparties, disruptions can create delivery, payment, or insurance cost shocks.

📊 Valuation & Market View

Equity valuation for upstream energy companies typically reflects expected future free cash flow under commodity price scenarios rather than stable earnings multiples. Market pricing mechanisms often reference:

  • EV/EBITDAX or similar cash-flow proxies when the market is focused on operating earnings power
  • Net asset value (NAV)-style frameworks that discount expected production and development pipeline economics
  • Discounted cash flow sensitivities to oil and gas price decks, differentials, and unit cost assumptions

Key valuation drivers that move the needle are: (1) production growth versus decline profile management, (2) finding and development costs and reserve replacement quality, (3) sustainable unit cost trajectory, (4) the strength and flexibility of the balance sheet, and (5) credibility of capital return and reinvestment discipline through cycles.

🔍 Investment Takeaway

ConocoPhillips’ investment case rests on an upstream model where competitive advantage is primarily earned through geographic and logistical economics (low-cost resource positioning plus delivery infrastructure) and reinforced by repeatable technical execution. The long-term thesis favors investors who underwrite COP as a cost-competitive producer with the capability to translate disciplined capital into resilient volumes and cash generation, while managing commodity and regulatory risks through operational rigor and capital discipline.


⚠ AI-generated — informational only. Validate using filings before investing.

📰 Market News & Coverage

15 Stories Available

Real-time institutional reporting and market updates for COP.

zacks.com2026-07-31

ConocoPhillips (COP) Surpasses Market Returns: Some Facts Worth Knowing

In the latest trading session, ConocoPhillips (COP) closed at $120.48, marking a +1.22% move from the previous day.

zacks.com2026-07-30

ConocoPhillips (COP) Earnings Expected to Grow: What to Know Ahead of Next Week's Release

ConocoPhillips (COP) doesn't possess the right combination of the two key ingredients for a likely earnings beat in its upcoming report. Get prepared with the key expectations.

zacks.com2026-07-30

Investors Heavily Search ConocoPhillips (COP): Here is What You Need to Know

ConocoPhillips (COP) has received quite a bit of attention from Zacks.com users lately. Therefore, it is wise to be aware of the facts that can impact the stock's prospects.

fool.com2026-07-30

Vanguard Energy vs. SPDR Oil & Gas Exploration: Which ETF Suits Your Portfolio Best?

VDE's broader portfolio and lower costs deliver superior five-year returns, but XOP's equal-weight strategy may appeal to investors seeking concentrated upstream exposure.

seekingalpha.com2026-07-29

Oakmark U.S. Large Value Strategy Q2 2026 Portfolio Review

Delta Air Lines was a contributor during the quarter. Fuel prices spiked in March following the onset of the Iran War, creating a near-term headwind for airline profitability. Intercontinental Exchange stock price declined due to market concerns about AI disruption and potential competition from new exchanges launching perpetual futures. We were pleased to initiate a position in Equitable Holdings at a meaningful discount to intrinsic value.

fool.com2026-07-28

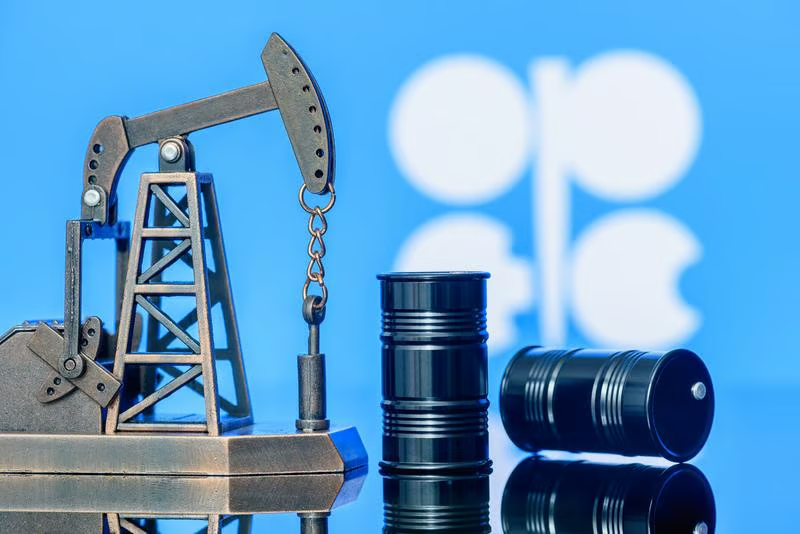
OPEC+ Is About to Pause Oil Output Hikes. Here's What It Means for Oil Stocks.

OPEC's decision to pause could have a meaningful impact on the oil market.

invezz.com2026-07-27

Top 3 stocks that could rally if oil settles above $100

Oil prices remain at the forefront of all financial debates as the US-Iran conflict and the related friction in the Strait of Hormuz continue. While rising energy prices often create widespread macroeconomic headwinds, if oil settles above $100 per barrel, it will represent a cash-generation windfall for the established upstream producers.

fool.com2026-07-27

Why ConocoPhillips Stock Got Mashed on Monday

That's hardly the first time this has happened within the conflict. And it surely won't be the last.

fool.com2026-07-25

For Energy Investors, Is a Traditional Energy ETF a Better Bet Than Clean Energy?

State Street's fossil fuel fund delivered 41% returns over one year with far lower volatility, while iShares' renewable basket posted 33% gains but carries five times higher fees.

defenseworld.net2026-07-25

Arrowstreet Capital Limited Partnership Has $304.96 Million Stock Position in ConocoPhillips $COP

Arrowstreet Capital Limited Partnership raised its position in ConocoPhillips (NYSE: COP) by 46,105.6% during the first quarter, according to the company in its most recent disclosure with the Securities and Exchange Commission. The institutional investor owned 2,310,281 shares of the energy producer's stock after buying an additional 2,305,281 shares during the period. Arrowstreet

zacks.com2026-07-23

ConocoPhillips (COP) Ascends While Market Falls: Some Facts to Note

In the most recent trading session, ConocoPhillips (COP) closed at $120.2, indicating a +1.19% shift from the previous trading day.

defenseworld.net2026-07-22

Baader Bank Aktiengesellschaft Acquires Shares of 4,422 ConocoPhillips $COP

Baader Bank Aktiengesellschaft purchased a new stake in shares of ConocoPhillips (NYSE: COP) during the undefined quarter, according to the company in its most recent filing with the Securities and Exchange Commission. The fund purchased 4,422 shares of the energy producer's stock, valued at approximately $545,000. Other hedge funds and other institutional investors

zacks.com2026-07-20

ConocoPhillips to Participate in BP's Redevelopment Project in Iraq

COP plans to buy a 42% stake in BP ECKL and join a $25 billion redevelopment project of four large oil fields in Iraq.

defenseworld.net2026-07-20

Dimensional Fund Advisors LP Increases Position in ConocoPhillips $COP

Dimensional Fund Advisors LP increased its position in shares of ConocoPhillips (NYSE: COP) by 0.7% during the first quarter, according to the company in its most recent Form 13F filing with the SEC. The fund owned 11,044,489 shares of the energy producer's stock after acquiring an additional 74,261 shares during the quarter. Dimensional

cnbc.com2026-07-19

Top Wall Street analysts suggest these 3 dividend stocks for steady income

Here are three dividend-paying stocks that are highlighted by Wall Street's top pros, as tracked by TipRanks.

📊 AI Financial Analysis

Powered by StockMarketInfo
Earnings Data: Q Ending 2026-03-31

"COP reported Q1’26 revenue of $16.05B and net income of $2.18B (EPS $1.78). On a QoQ basis, revenue rose from $13.31B in Q4’25 (+20.6%), while net income increased from $1.44B (+51.4%). YoY, revenue declined from $16.46B in Q1’25 (-2.4%), and net income fell from $2.85B (-23.4%). Margins weakened sequentially: net profit margin compressed to 13.6% from 10.8% in Q4’25? (vs ratio data: Q4 net margin 10.84%, so margin expanded QoQ), but the broader 4-quarter trend shows profitability deterioration from Q1’25 net margin of 17.3% down to ~14.0% in Q2’25/Q3’25 and 10.8% in Q4’25; Q1’26 net margin improved to 13.6% but remains below Q1’25. Operating cash flow was $4.30B and free cash flow also $4.30B (no reported PPE capex), with capital returns remaining shareholder-friendly: dividends paid were $1.03B and buybacks were $1.01B during the quarter. Balance sheet resilience is supported by large equity ($64.5B) and stable total assets ($122.7B). Total shareholder returns are strong: COP is up 34.4% over the past 1Y alongside a ~0.6% dividend yield, indicating significant capital appreciation. Revenue and Earnings-based metrics were not applicable for this analysis due to the company's pre-revenue status. The evaluation focused on cash runway, burn rate, and market sentiment instead."

Revenue Growth

Fair

QoQ revenue improved materially (+20.6% to $16.05B) but YoY slipped (-2.4% vs $16.46B). Overall direction is mixed across the 4-quarter period.

Profitability

Positive

QoQ net income rose (+51.4%) and net margin improved vs Q4’25, but YoY net income declined (-23.4%) and the 4-quarter trend shows margins lower than Q1’25 (17.3% net margin) despite a rebound in Q1’26 (13.6%).

Cash Flow Quality

Positive

Operating cash flow was $4.30B with free cash flow of $4.30B in Q1’26. Capital returns (dividends $1.03B; buybacks ~$1.01B) were supported by strong quarterly cash generation.

Leverage & Balance Sheet

Good

Total assets were stable around ~$123B and equity remained steady (~$64.5B). Debt remained elevated but largely unchanged quarter to quarter (net debt ~ $17–19B range).

Shareholder Returns

Strong

Price momentum is strong (+34.4% 1Y), and the dividend yield is ~0.6%, supporting attractive total shareholder returns via appreciation plus ongoing distributions.

Analyst Sentiment & Valuation

Neutral

Consensus target (~$126.31) is moderately above the current price ($116.04), with a wide range ($98–$183), suggesting reasonable upside but notable uncertainty.

Disclaimer:This analysis is AI-generated for informational purposes only. Accuracy is not guaranteed and this does not constitute financial advice.

Fundamentals Overview

Loading fundamentals overview...

COP delivered strong Q1 cash generation ($2.4B free cash flow; $5.4B CFO) and returned $2.0B to shareholders while holding OpEx guidance ($10.2B) unchanged and reaffirming cost-reduction run-rate capture. Near-term guidance was modestly revised for geopolitics: Qatar exclusion and Surmont royalty effects lowered production expectations (2026 midpoint 2.31 mboe/d; Q2 midpoint 2.2 mboe/d), not a broad demand/cycle reset. Operationally, Willow derisking is progressing: management tied the 50% completion to civil/critical-path milestones and connection work that should enable fueling and power activation within the coming week, with module fabrication slightly above 50% and sealift planned for next summer—supporting the 2029 free-cash-flow inflection narrative. Permian adds are efficiency-driven rather than a macro bet: a $250M capex increase concentrates on Delaware, adding a rig to prevent frac gaps and managing OBO ballots. LNG strategy strengthened via EG tolling, but the conflict is driving structural LNG tightness and introduces month-scale uncertainty for NFE/NFS timing.

AI IconGrowth Catalysts

  • Lower 48 operational efficiency gains driving peer-leading capital efficiency; increasing three-mile-plus laterals
  • Willow project: winter construction season delivered critical civil work; project at 50% complete
  • Alaska exploration: completed four-well program leveraging existing infrastructure; found hydrocarbons and gravel for future pads
  • LNG: Equatorial Guinea executed third-party tolling agreement to extend EGLNG life well into the next decade; Port Arthur LNG progressing with first LNG expected next year
  • 2026 production guidance supported by modest Qatar exclusion and Surmont royalty rate adjustment; base momentum remains from Lower 48 and International

Business Development

  • Equatorial Guinea LNG (EGLNG): third-party tolling agreement executed (tied to EGLNG equity position via upstream Alba unit and EGLNG operations)
  • LNG marketing: placed first 5 million tons of LNG (Phase 1) predominantly to Europe with some to Asia; remaining volumes conversations intensifying
  • NFE/NFS LNG projects in the Middle East: management discussed construction progress impacts and expected delays (QatarEnergy disclosed disruption outlook)

AI IconFinancial Highlights

  • Q1 2026 CFO: $5.4 billion; Free cash flow: $2.4 billion
  • Q1 adjusted EPS: $1.89 per share
  • Capital returned to shareholders: $2.0 billion total ($1.0 billion ordinary dividends; $1.0 billion share repurchases)
  • Balance sheet liquidity: cash and short-term investments $6.7 billion; liquid long-term investments $1.2 billion
  • Production guidance midpoint updated to 2.31 mboe/d for 2026; reflects ~20 thousand boe/d annual impact from Qatar excluded from 2Q guidance and ~15 thousand boe/d annual impact from Surmont royalty rate adjustment tied to higher prices
  • Q2 2026 midpoint guidance: 2.2 mboe/d; reflects full exclusion of Qatar from Q2, Surmont royalty adjustment, and planned Q2 maintenance
  • Operating cost guidance: full-year $10.2 billion unchanged; $400 million lower than 2025 due to cost reduction and margin enhancement program; confidence to realize full $1.0 billion run-rate savings by year end
  • Capex guidance updated to $12.0 billion–$12.5 billion (midpoint +2% vs prior ~$12B) due to slightly more Permian activity in 2H (add a rig to match completion efficiencies; higher non-operated spend) and inclusion of macro/Middle East timing uncertainty for NFE/NFS spending

AI IconCapital Funding

  • Shareholder returns in Q1: $2.0 billion ($1.0B dividends; $1.0B repurchases)
  • 2026 capital return framework reiterated: target 45% of CFO returned to shareholders (with dividend growth competitive with top-quartile S&P 500); repurchase described as dollar-cost averaging and managed quarter-to-quarter
  • Cash and runway: ended Q1 with $6.7 billion cash & short-term investments plus $1.2 billion liquid long-term investments
  • Balance sheet: reiterated intention to maintain and protect investment-grade balance sheet

AI IconStrategy & Ops

  • Lower 48: continued peer-leading capital efficiency; increasing three-mile-plus laterals and maintaining operational continuity into 2027
  • Operational cost control: labor and non-labor (including lease operating costs) removal progressing faster than originally premised; Q1 reinforces confidence in $1.0 billion run-rate savings by year end
  • Permian: added $250 million capex (Delaware) concentration; added another Permian rig to avoid frac gaps as completion efficiencies outpace drilling; OBO spend anticipated to rise in 2H via partner well ballots
  • Alaska construction sequencing: winter civil scope (bridges, gravel roads/pads/airstrip) completed despite weather days; East–West pipeline scope allows connections back into existing operations; fuel gas planned to be brought in and power fired up within the coming week
  • LNG: tolling agreement in Equatorial Guinea to increase utilization and extend life; ongoing concern on Europe gas inventories (below expected levels)

AI IconMarket Outlook

  • Crude oil macro (from Q&A): management cites ~10 million b/d production offline for ~two months; refinery run cuts potentially ~8 million b/d; inventory draws may accelerate after tanker impacts arrive; global oil demand downgraded to flat y/y with downside risk if conflict persists
  • WTI “mid-cycle floor” framing (from Q&A): management suggests floor likely to rise from prior mid-cycle WTI of ~$65 due to sustained supply shortfall and demand/supply equilibrium changes
  • LNG macro (from Q&A): Qatar production shut-in (Qatar offline) estimated at ~20% of global LNG not flowing; ~200 cargoes not delivered; management expects LNG shortages structurally for “quite some time” and prices likely constructive for a period
  • NFE/NFS: construction progressing with interruptions; expected delays “on the order of months”; potential extension from QatarEnergy’s second-half startup window into early next year

AI IconRisks & Headwinds

  • Middle East conflict: supply shortfall absorption by refinery run cuts and demand curtailments; risk of accelerating inventory draws and import-dependent critical shortages into June–July timeframe
  • Oil demand risk: management downgrades global oil demand to flat y/y with more downside if conflict continues; governments in 10+ countries implementing demand rationing policies
  • LNG shortages risk: Europe gas inventories below expected levels; risk of Northern Europe winter severity driving more acute shortages
  • NFE/NFS timing uncertainty: macro/geopolitical impacts and conflict dependency for Qatar-related production; management states guidance only provides framework and watches construction + own production closely
  • Operational/royalty impacts: higher royalty rates at Surmont due to higher prices; Qatar exclusion impacting production guidance

Q&A: Analyst Interest

  • Topic: Global oil market physical vs paper dynamics and operator response. Management described ~10 million b/d production offline for ~two months, with SPR and inventory/SPR releases partially backfilling. They said the “brunt” is refinery run cuts and demand curtailments (~8 million b/d global refinery cuts). They expect inventory draws to accelerate post-tanker arrivals and demand risk to the downside, with governments rationing ahead of physical shortages.
  • Topic: Willow derisking milestones and path to 2029 free cash flow inflection. Management confirmed 50% project completion after completing winter critical civil scope despite weather days: bridges installed and gravel scope delivered (roads, pads, airstrip). East–West scope enables connections back into existing operations; within a week they’ll bring fuel gas and fire up power. Lower 48 Gulf Coast modules are slightly >50% fabricated for next summer sealift; they positioned early oil in 2029 as on track.
  • Topic: LNG macro disruption and NFE/NFS project timeline sensitivity to Qatar. Management quantified Qatar shutdown as ~20% of global LNG not flowing (~200 cargoes). They stated LNG shortages are likely structural, expecting constructive prices for a period due to constrained supply, with QatarEnergy indicating damage impacts could last 3–5 years. For NFE/NFS, they said construction continues but expected delays are “on the order of months,” potentially extending startup from 2H toward early next year, and they removed Qatar from 2Q production guidance for clarity.

Sentiment: POSITIVE

Note: This summary was synthesized by AI from the COP Q1 2026 earnings transcript. Financial data is complex; please verify all metrics against official SEC filings before making investment decisions.

📋 Official Regulatory 10-K / 10-Q SEC Filings

Direct authenticated documentation links to audited SEC database reports for COP.

SEC EDGAR Live Feed
Loading financial data and tables...
📁

SEC Filings (COP)

© 2026 Stock Market Info — ConocoPhillips (COP) Financial Profile