FedEx Corporation

FedEx Corporation (FDX) Market Cap

FedEx Corporation has a market capitalization of $78.98B.

Price: $331.00

3.00 (0.91%)

Market Cap: 78.98B

NYSE · time unavailable

CEO: Rajesh Subramaniam

Sector: Industrials

Industry: Integrated Freight & Logistics

IPO Date: 1978-04-12

Website: https://www.fedex.com

FedEx Corporation (FDX) - Company Information

Market Cap: 78.98B|Sector: Industrials

Company Profile

FedEx Corporation provides transportation, e-commerce, and business services in the United States and internationally. The company's FedEx Express segment offers express transportation, small-package ground delivery, and freight transportation services; time-critical transportation services; and cross-border enablement, technology, and e-commerce transportation solutions. Its FedEx Ground segment provides day-certain delivery services to businesses and residences. The company's FedEx Freight segment offers less-than-truckload freight transportation services. As of May 31, 2022, this segment had approximately 30,000 vehicles and 400 service centers. Its FedEx Services segment provides sales, marketing, information technology, communications, customer service, technical support, billing and collection, and back-office support services. The company's Corporate, Other and Eliminations segment offers integrated supply chain management solutions, specialty transportation, customs brokerage, and global ocean and air freight forwarding services; and document and business services, as well as retail access to its customers for its package transportation businesses. FedEx Corporation was founded in 1971 and is based in Memphis, Tennessee.

Analyst Sentiment

71%
Buy

From 27 Active Polls

1Y Forecast: $345.00

▲ +4.2% Potential Upside

Consensus Target Metrics

Low Bound

$155

Median

$355

High Bound

$479

Average

$345

Price & Moving Averages

Loading chart...

🎯 Wall Street Analyst Intelligence Report

1-Year structural target targets, chart projections, and sentiment maps.

Average 1Y Target
$345.00
▲ +4.23% Upside
Low Target
$155.00
-53% Risk
Median Target
$355.00
7% Mid
High Target
$479.00
45% Max
Consensus
Buy
28 / 49 Buys

Consensus Trend Projection

Trailing closures vs. 12-month metrics map.

Analyst Vote Distribution

Aggregate institutional coverage sentiment weights.

📊 Historical Valuation Multiples

Real-time Trailing Twelve Month (TTM) momentum side-by-side with discrete quarterly metrics.

Fiscal QuarterTTMQ1 2026Q4 2025Q3 2025Q2 2025Q1 2025Q4 2024Q3 2024Q2 2024
Period EndingTrailing 12MFeb 28, 2026Nov 30, 2025Aug 31, 2025May 31, 2025Feb 28, 2025Nov 30, 2024Aug 31, 2024May 31, 2024
Market Cap ($M)78,97975,72653,48745,21541,80050,80858,98359,51050,324
Enterprise Value ($M)112,993109,74084,68376,95573,71482,70491,22891,33281,542
Price to Earnings Ratio (P/E)17.9417.9313.9913.726.3413.9719.9018.748.54
Price/Earnings-to-Growth Ratio (PEG)7.922.54127.0123.4215.9011.075.00
Price to Sales Ratio (P/S)0.863.162.282.031.882.292.692.762.28
Price to Book Ratio (P/B)2.702.541.901.631.491.902.232.191.82
Price to Free Cash Flow Ratio (P/FCF)18.0772.9544.8041.3739.9650.06117.97141.6933.64
Enterprise Value to Sales (EV/Sales)4.573.613.463.323.734.154.233.69
Enterprise Value to EBITDA (EV/EBITDA)10.6944.6135.9332.8221.6635.0042.5141.1825.26
Debt to Equity Ratio3.221.411.341.361.331.391.411.391.37

FDX Growth Runway Model

Standard long term linear growth fade

Multi-Stage Discounted Cash Flow Sandbox

Market Price$331.00
Intrinsic Value$48.07
Market Alignment
Overvalued by 85.5%relative to calculated intrinsic value
9.00%
Exp: 0%0%
i

Growth runway slowdown

This value provides a time window for the growth rate to decline beyond Stage 1 toward the terminal rate. Longer windows are most useful for companies with high growth starting conditions or strong competitive advantages. This option stretches out the growth rate slowdown across 5, 10, or 15-year steps. A high-growth starting condition (exceeding a 25% initial growth rate) automatically applies a curve decay to simulate realistic, rapid market saturation.
i

Terminal growth rate

With long-term inflation between 3-5%, revenue must grow by that baseline to maintain flat real-world market share. This value sets the permanent terminal growth rate to factor into the valuation beyond the growth slowdown runway toward maturity.

3-Stage Financial Runway Horizon

🧠 Perpetuity Horizon Engine (Stage 3: Post-2035)

Terminal FCF Base$4.38B
Perpetuity TV Value$82.37B
Discounted TV (PV)$34.79B
TV Weighting %57.5%
⚠️
Financial Model Disclaimer & Risk Disclosure: This interactive scenario simulator is an educational sandbox provided strictly for informational and analytical research purposes. Core historical financial statements and consensus estimates are sourced directly via Financial Modeling Prep (FMP). All downstream outputs are entirely deterministic, hypothetical projections generated by combining automated mathematical formulas (including linear interpolation and Gaussian bell-curve decay models) with user-selected variables and third-party financial data inputs. Users assume all liability for trading decisions executed based on these sandbox calculations.

📘 Full Research Report

ℹ️

AI-Generated Research: This report is for informational purposes only.

📘 FEDEX CORP (FDX) — Investment Overview

🧩 Business Model Overview

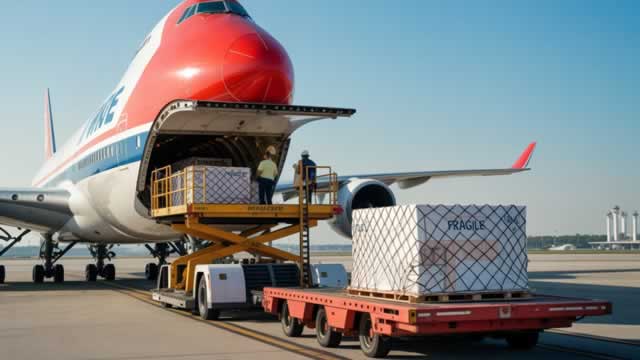
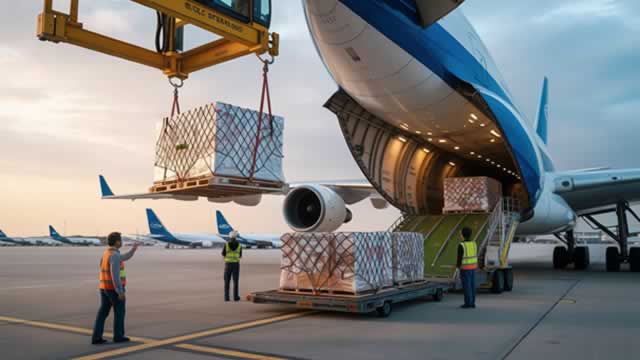
FedEx is an integrated transportation and logistics operator built around time-definite delivery and reliability. The operating model combines (1) pickup and linehaul to consolidation nodes, (2) air and ground network movement through hubs, and (3) last-mile distribution to businesses and residences. A key value proposition is predictable transit times supported by a large owned/controlled network, standardized operating processes, and extensive tracking/visibility capabilities. This integration reduces handoffs, tightens service performance, and supports contractual service-level commitments that are difficult to replicate without comparable network density and throughput.

💰 Revenue Streams & Monetisation Model

Revenue is primarily driven by transportation volumes and service tiers, monetized through a mix of transactional shipments and contract-based agreements. Major sources include:

  • Express transportation: time-definite air/ground services typically associated with higher-yield shipments (priority delivery, faster transit windows, broader service guarantees).
  • Ground transportation: domestic delivery services with pricing tied to package speed, distance, and service level, often characterized by large daily network throughput.
  • Freight/logistics and related services: additional revenue streams tied to handling, brokerage, and specialized transportation solutions depending on customer needs.

Margin drivers are dominated by yield (pricing and mix of service levels), cost per shipment (labor productivity, route efficiency, network utilization), and fuel and purchased transportation (pass-through mechanics and hedging/contracting effectiveness). Because the network is capacity- and asset-intensive, operating leverage depends on maintaining volume density and optimizing hub throughput rather than relying on marginal incremental pricing alone.

🧠 Competitive Advantages & Market Positioning

FedEx’s moat is primarily rooted in network density and operational scale (a cost advantage and service reliability barrier) plus customer switching costs created by service-level commitments, integrated shipment workflows, and historical routing/handling performance.

  • Network scale & cost advantage: A dense hub-and-spoke system enables high aircraft utilization, efficient linehaul planning, and economies in sorting/handling. Competitors without comparable network depth face higher per-package costs at similar service levels.
  • Service reliability as a contractual asset: Time-definite performance is valuable for shippers managing inventory and delivery windows. Once integrated into logistics operations, changing providers introduces service-risk, operational disruption, and often re-engineering of logistics workflows.
  • Operational learning curve & process standardization: Large-scale routing, predictive operational planning, and standardized handling reduce variability—an advantage that compounds over time in high-throughput networks.

Competitive benchmarking (industry focus and rivals):

  • UPS: Directly comparable in U.S. package delivery and time-definite logistics. Both compete on reliability, network coverage, and contracted volume. The distinction typically lies in network design and optimization strategy rather than the existence of the moat.
  • DHL: Stronger emphasis on international express and cross-border logistics. DHL’s competitive advantage often centers on global reach and international network depth, where FedEx competes by leveraging domestic strength and integrated air/ground capabilities.
  • USPS: A price- and policy-influenced competitor in domestic mail and package segments. USPS competition is more structural via postal policy and universal service obligations than via equivalent private-network density and time-definite operations.

Compared with these rivals, FedEx’s positioning emphasizes integrated express-plus-ground coverage for service-level driven customers, leveraging network density and execution discipline to defend yield and contract renewal.

🚀 Multi-Year Growth Drivers

Growth prospects over a 5–10 year horizon depend on structural logistics demand and network utilization rather than a single-cycle recovery:

  • Secular e-commerce and parcel growth: Demand for faster delivery windows supports higher mix of time-definite services and premium shipping tiers for business-to-consumer and business-to-business transactions.
  • Global trade and supply-chain complexity: Offshoring to nearshoring and reshoring shifts still increase logistics intensity—more frequent shipments, more nodes, and greater need for dependable lead times.
  • Inventory and working-capital optimization: Shippers increasingly optimize inventory by using logistics providers to meet promised delivery dates, reducing safety stock needs while maintaining service levels.
  • Automation and network optimization: Route planning, scanning/visibility systems, and facility/process automation can improve cost per package and service reliability, supporting incremental margin durability.
  • Contract logistics expansion: Longer-term customer agreements can support volume stability and improve predictability of capacity utilization.

⚠ Risk Factors to Monitor

  • Capacity and asset intensity: High fixed costs (aircraft, ground infrastructure, hubs, labor) can pressure margins during demand softening or volume mix shifts.
  • Labor and operating costs: Wage growth, labor availability, and productivity swings directly affect cost per shipment.
  • Fuel and energy price volatility: Fuel affects both margins and customer pricing power; pass-through is not always immediate or complete.
  • Competitive pricing and yield discipline: Large incumbents compete for volume; sustained yield erosion can outweigh volume growth.
  • Regulatory and environmental constraints: Aviation emissions, ground operations, and local regulations can raise compliance costs and capex requirements.
  • Operational disruption risk: Weather events, network outages, and system failures can harm service reliability and contract renewal dynamics.

📊 Valuation & Market View

Logistics and transportation equities are typically valued using enterprise value multiples tied to cash generation and operational quality (commonly EV/EBITDA or EV/operating cash flow rather than growth-centric revenue multiples). The market generally pays attention to:

  • Operating margin durability driven by yield discipline and labor productivity
  • Asset utilization (volume density across hubs and routes)
  • Capex intensity and free cash flow conversion in an asset-heavy model
  • Downcycle resilience (ability to protect cost per package while maintaining service levels)

In this sector, valuation sensitivity often reflects expectations for service reliability, pricing/yield, and whether operating leverage improves through automation and network optimization rather than purely through demand.

🔍 Investment Takeaway

FedEx’s long-term investment case rests on a hard-to-copy logistics network built for time-definite performance, supported by scale-driven cost advantages and customer switching costs tied to service-level reliability and integrated shipment workflows. While the business faces cyclical volume pressures and cost volatility typical of transportation, its structural strengths in network density, execution, and contracted customer relationships provide a durable foundation for cash generation through varied demand environments.


⚠ AI-generated — informational only. Validate using filings before investing.

📰 Market News & Coverage

15 Stories Available

Real-time institutional reporting and market updates for FDX.

barrons.com2026-06-05

FedEx Freight Stock Is a Haven in the Market Selloff. Here's Why.

Shares of newly-independent FedEx Freight turned out to be a haven for investors on Friday.

fool.com2026-06-05

Is FedEx a Buy Following Its FedEx Freight Spinoff?

The company's Network 2.0 initiative can now go into full swing.

seekingalpha.com2026-06-03

FedEx Freight: Spinoff Is Not Moving Me Yet

FedEx Freight Holding Company, Inc. trades at ~$150 post-spin, with valuation reflecting mid-twenty times pro forma earnings and uncertain near-term margins. FDXF targets mid-single-digit sales growth, margin expansion from 12% to 15%, and capital spending at 5% of sales. Near-term margin pressure is likely due to corporate cost allocation and transition service agreements, making current valuation less compelling.

businesswire.com2026-06-02

FedEx Freight to Report Fourth Quarter 2026 Earnings on June 25, 2026

MEMPHIS, Tenn.--(BUSINESS WIRE)--FedEx Freight to Report Fourth Quarter 2026 Earnings on June 25, 2026.

proactiveinvestors.com2026-06-02

FedEx Freight initiated at ‘Buy' by Bank of America on margin expansion potential

FedEx Freight (NYSE:FDXF) shares traded around $152 on Tuesday afternoon after Bank of America initiated coverage of the newly independent less-than-truckload (LTL) carrier with a ‘Buy' rating and a $185 price target. The initiation comes one day after FedEx Freight was spun off from FedEx Corp (NYSE:FDX, XETRA:FDX), with FedEx retaining a 19.9% ownership stake.

fool.com2026-06-02

Should You Buy FedEx Stock Before June 23?

The logistics company reports earnings in a few weeks.

proactiveinvestors.com2026-06-02

FedEx Freight initiated at ‘Buy’ by Bank of America on margin expansion potential

FedEx Freight (NYSE:FDXF) shares traded around $152 on Tuesday afternoon after Bank of America initiated coverage of the newly independent...

zacks.com2026-06-02

Do Options Traders Know Something About FedEx Stock We Don't?

Investors need to pay close attention to FDX stock based on the movements in the options market lately.

youtube.com2026-06-01

FedEx Freight CEO John Smith sits down with Jim Cramer

FedEx Freight CEO John Smith joins 'Mad Money' host Jim Cramer to talk what is next for the company after spinning off from FedEx.

zacks.com2026-06-01

FedEx (FDX) Stock Dips While Market Gains: Key Facts

In the latest trading session, FedEx (FDX) closed at $338.49, marking a -17.79% move from the previous day.

cnbc.com2026-06-01

FedEx Freight CEO says the spinoff will help the company 'leapfrog' competitors

FedEx Freight CEO John Smith said the company's separation from FedEx will allow it to invest more aggressively in growth initiatives tailored specifically to the less-than-truckload market. He said FedEx Freight aims to reach a 15% operating margin by 2029, which is "not the ceiling.

247wallst.com2026-06-01

Forget Expedia: This Unstoppable Monopoly Is a Far Smarter Bet

Expedia Group (NASDAQ:EXPE | EXPE Price Prediction) is back in the spotlight after a 42.34% Q1 adjusted EPS beat and a freshly minted $5 billion buyback authorization that has the travel-rebound crowd piling back in.

wsj.com2026-06-01

FedEx Freight CEO Says Self-Driving Trucks Are Ready for Prime Time

After two years of testing, “the technology is there,” says CEO John Smith. Now the ball is in the regulators' court.

zacks.com2026-06-01

Will FedEx (FDX) Beat Estimates Again in Its Next Earnings Report?

FedEx (FDX) has an impressive earnings surprise history and currently possesses the right combination of the two key ingredients for a likely beat in its next quarterly report.

fool.com2026-06-01

Why FedEx Stock Just Dropped

FedEx shares just got smaller -- but investors got FedEx Freight stock as a consolation prize.

📊 AI Financial Analysis

Powered by StockMarketInfo
Earnings Data: Q Ending 2026-02-28

"FDX reported revenue of $24.0B and net income of $1.06B in the latest quarter (EPS: 4.35). QoQ, revenue grew ~2.3% (from $23.47B) while net income rose ~10.5% (from $0.96B). YoY, revenue increased ~8.3% (from $22.16B) and net income grew ~16.1% (from $0.91B), indicating stronger bottom-line leverage. Profitability appears to be improving: net margin expanded to ~4.4% (vs ~4.1% both QoQ and YoY). On the balance sheet, Total Assets increased QoQ (~6.2%) and Equity also rose (~5.9%), supporting resilience. Net debt, however, climbed (~9.1% QoQ to ~$34.0B), suggesting some incremental leverage rather than pure deleveraging. Shareholder returns have been excellent: the stock is up ~92.8% over the past year, well above the >20% momentum threshold, which should materially lift total return performance. The dividend yield remains very low (per provided ratio ~0.36%), so capital appreciation is the primary driver of shareholder value. Analyst consensus price targets (~$360–364) sit below the current ~$392 level, implying limited upside from valuation targets despite strong execution."

Revenue Growth

Positive

Revenue rose ~2.3% QoQ (23.47B to 24.0B) and ~8.3% YoY (22.16B to 24.0B), showing steady top-line momentum without a spike.

Profitability

Good

Net income grew faster than revenue (~10.5% QoQ; ~16.1% YoY). Net margin improved to ~4.4% (vs ~4.1% QoQ and YoY), indicating expanding profitability. EPS increased to 4.35 (+10.7% QoQ, +14.8% YoY).

Cash Flow Quality

Neutral

Net income improved, but the dataset lacks detailed cash-flow measures. Dividend payout ratio is moderate (~32% latest), suggesting reasonable support, but the dividend yield is very low, so cash-return impact is limited.

Leverage & Balance Sheet

Positive

Total assets and equity increased QoQ (~6.2% and ~5.9%), improving balance-sheet scale. Net debt rose ~9.1% QoQ, which slightly reduces credit/financial flexibility versus a deleveraging trend.

Shareholder Returns

Strong

Total shareholder returns are dominated by strong price momentum: +92.8% 1Y. Dividend yield is low (~0.36% per provided ratio), so capital appreciation is the key driver of the high score.

Analyst Sentiment & Valuation

Neutral

Consensus targets (~$360–364) are below the current ~$392 price (limited upside implied). Valuation is also richer than some prior quarters (P/E ~22.3 vs ~17–17.4 earlier in 2025).

Disclaimer:This analysis is AI-generated for informational purposes only. Accuracy is not guaranteed and this does not constitute financial advice.

Fundamentals Overview

Loading fundamentals overview...

Management sounded upbeat—“exceptional peak” and “most profitable yet”—and backed it with a clear guidance raise to FY’26 adjusted EPS of $19.30–$20.10, plus a 50 bps FEC margin expansion and continued Network 2.0 scaling. However, the Q&A pressure points were about how much of the success is timing/structural versus cyclical: (1) MD-11 grounding remains a hard $120M Q3 headwind with up to $55M more in Q4; (2) Freight separation investments are not going away—Q3 had ~$60M of unadjusted separation costs and CFO/Freight leadership indicated these IT/talent build costs should continue into Q4; (3) the LTL volume environment is still weak, described as industry-wide and not unique; and (4) Middle East/Iran disruption was mitigated via network rerouting, but no quantified profit impact was provided. Net: optimistic on revenue quality and savings, cautious about near-term cost and aircraft/industry headwinds.

AI IconGrowth Catalysts

  • Higher weight and revenue per shipment supporting revenue quality (FedEx Freight) despite lower shipments
  • Network 2.0 rollout: ~35% of eligible volume flowing through ~400 optimized Network 2.0 facilities by end of month
  • B2B vertical share gains: nearly half of revenue growth driven by B2B services (incl. U.S. Priority/Deferred Express)
  • Yield improvement from pricing actions and model enhancements (dimensional pricing with ML; fuel surcharge adjustments)

Business Development

  • Participation in consortium to make an offer for all shares of InPost (O-rx out-of-home delivery in Europe); targeted close in 2H calendar 2026; expected to be accretive in year 1
  • Collaboration with Dun & Bradstreet / FedEx Dataworks to launch the Retail Momentum Index (monthly beginning this spring)
  • Robotics partnerships: Berkshire Grey (Scoop autonomous robotic package unloader) and Dexterity (trailer loading robots); pilots, further deployment later in 2026

AI IconFinancial Highlights

  • Raised FY'26 adjusted earnings outlook to $19.30–$20.10 per diluted share (from $17.80–$19.00 prior range per CFO remarks context)
  • Q3 adjusted EPS growth: +16% YoY, but includes a one-time $0.41 benefit from a favorable effective tax rate impact of $99M related to Brazil restructuring
  • Q3 consolidated revenue: +8% YoY; Q3 adjusted operating income: +7% YoY
  • FEC margin expansion: +50 bps adjusted operating margin; 6th consecutive quarter of margin expansion at FEC
  • MD-11 grounding headwind: $120M adjusted operating income headwind in Q3; additional YoY headwind in Q4 up to $55M
  • FedEx Freight profitability: adjusted operating income declined $127M YoY
  • FedEx Freight separation costs: ~$60M separation-related costs in Q3 not adjusted out; Q4 expected continued separation costs (driven by IT buildout + stand-alone readiness)
  • FY'26 outlook bridge (midpoint scenario): adjusted operating income $6.5B, +$300M vs prior outlook; FEC volume-related revenue tailwind $600M (+$100M vs Dec), FEC yield tailwind $3.2B (+$200M vs Dec), base expense increases assumed at $1.6B (+$500M vs Dec).

AI IconCapital Funding

  • FY'26 CapEx now expected to be no more than $4.1B (down at least $400M from $4.5B forecast in December)
  • Adjusted free cash flow FY'26 assumption: $3.8B previously shared; upside potential tied to improved adjusted operating income
  • No incremental share repurchases expected in Q4 (embedded in EPS outlook); Q4 outlook includes dilution headwind from ~242M common share equivalents, FY'26 avg share count ~239M
  • FedEx Freight spin financing: completed $3.7B debt offering in January (milestone ahead of June 1, 2026 spin)

AI IconStrategy & Ops

  • Network 2.0: scaling to ~65% of eligible volume through Network 2.0 facilities by next peak; expect $2B cumulative savings by end of 2027
  • Peak operations: used data-driven unload trailer prioritization tool (real-time sequencing of yard ops to prioritize time-critical packages, especially morning sorts)
  • International capacity reallocation: reduced transpacific outbound Purple-tail capacity ~15% and White-tail ~25% during the quarter; reallocating to Asia-to-Europe and intra-Asia lanes
  • Europe transformation: France ground network redesign—reduce station count by >40%, optimize hub-and-spoke with fewer hubs
  • Automation/robotics: autonomous robotic package unloader (Scoop, Berkshire Grey) plus trailer-loading robots (Dexterity) in pilot; further deployment later this calendar year

AI IconMarket Outlook

  • FY'26 consolidated revenue growth raised to 6%–6.5% (from 5%–6% prior) and implies Q4 consolidated revenue growth of 6%–7.5%
  • FY'26 FEC revenue growth midpoint ~8%; Q4 FEC revenue growth ~8% at midpoint (driven by U.S. domestic + international yields)
  • FedEx Freight: FY'26 revenue expected down low single digits YoY; Q4 revenue flat to down slightly due to continued LTL demand weakness
  • Q4 adjusted EPS: midpoint implied ~$5.80 (highest quarterly earnings of the year directionally)
  • Brie/John Q&A on FY'27: management reiterated focus on Network 2.0 ramp starting 2027; no explicit EPS number given for FY'27 in Q&A

AI IconRisks & Headwinds

  • MD-11 grounding: $120M Q3 headwind; additional YoY headwind in Q4 up to $55M (returning aircraft late in quarter)
  • Global conflict (Iran/Middle East): management said Middle East is a relatively small part of total revenue; assumed broader global demand from Q3 continues into Q4; monitored as first 2 weeks of March are in line with trend; no explicit dollar profit impact disclosed
  • LTL macro + demand softness: freight volume down mid-single digits in Q3 (management language: volume and revenue down mid-single digits; not unique to freight)
  • Separation/spin costs in FedEx Freight: separation costs increased in Q3 (about $60M in costs not adjusted out); management expects these investments to continue into Q4, primarily as IT infrastructure buildout and talent buildout for stand-alone readiness
  • Variable incentive compensation headwind (guidance): Q4 embedded headwind including variable comp; CFO cited FY'27-year-over-year context $275M headwind tied to variable comp (and $135M from LTL; $50M thereof from MD-11s) as part of the year-over-year impact explanation

Sentiment: MIXED

Note: This summary was synthesized by AI from the FDX Q3 2026 earnings transcript. Financial data is complex; please verify all metrics against official SEC filings before making investment decisions.

📋 Official Regulatory 10-K / 10-Q SEC Filings

Direct authenticated documentation links to audited SEC database reports for FDX.

SEC EDGAR Live Feed
Loading financial data and tables...
📁

SEC Filings (FDX)

© 2026 Stock Market Info — FedEx Corporation (FDX) Financial Profile