Hasbro, Inc.

Hasbro, Inc. (HAS) Market Cap

Hasbro, Inc. has a market capitalization of $11.91B.

Price: $84.18

-0.29 (-0.34%)

Market Cap: 11.91B

NASDAQ · time unavailable

CEO: Christian Cocks

Sector: Consumer Cyclical

Industry: Leisure

IPO Date: 1980-03-17

Website: http://shop.hasbro.com/en-us

Hasbro, Inc. (HAS) - Company Information

Market Cap: 11.91B|Sector: Consumer Cyclical

Company Profile

Hasbro, Inc., together with its subsidiaries, operates as a play and entertainment company. Its Consumer Products segment engages in the sourcing, marketing, and sale of toy and game products. This segment also promotes its brands through the out-licensing of trademarks, characters, and other brand and intellectual property rights to third parties through the sale of branded consumer products, such as toys and apparels. Its toys and games include action figures, arts and crafts and creative play products, fashion and other dolls, play sets, preschool toys, plush products, sports action blasters and accessories, vehicles and toy-related specialty products, games, and other consumer products; and licensed products, such as apparels, publishing products, home goods and electronics, and toy products. The company's Wizards of the Coast and Digital Gaming segment engages in the promotion of its brands through the development of trading card, role-playing, and digital game experiences based on Hasbro and Wizards of the Coast games. Its Entertainment segment engages in the development, acquisition, production, distribution, and sale of world-class entertainment content, including film, scripted and unscripted television, family programming, digital content, and live entertainment. The company sells its products to retailers, distributors, wholesalers, discount stores, drug stores, mail order houses, catalog stores, department stores, and other traditional retailers, as well as ecommerce retailers; and directly to customer through Hasbro PULSE e-commerce website. Hasbro, Inc. was founded in 1923 and is headquartered in Pawtucket, Rhode Island.

Analyst Sentiment

90%
Strong Buy

From 16 Active Polls

1Y Forecast: $109.00

▲ +29.5% Potential Upside

Consensus Target Metrics

Low Bound

$92

Median

$110

High Bound

$123

Average

$109

Price & Moving Averages

Loading chart...

🎯 Wall Street Analyst Intelligence Report

1-Year structural target targets, chart projections, and sentiment maps.

Average 1Y Target
$109.00
▲ +29.48% Upside
Low Target
$92.00
9% Risk
Median Target
$110.00
31% Mid
High Target
$123.00
46% Max
Consensus
Buy
17 / 33 Buys

Consensus Trend Projection

Trailing closures vs. 12-month metrics map.

Analyst Vote Distribution

Aggregate institutional coverage sentiment weights.

📊 Historical Valuation Multiples

Real-time Trailing Twelve Month (TTM) momentum side-by-side with discrete quarterly metrics.

Fiscal QuarterTTMQ1 2026Q4 2025Q3 2025Q2 2025Q1 2025Q4 2024Q3 2024Q2 2024
Period EndingTrailing 12MMar 29, 2026Dec 28, 2025Sep 28, 2025Jun 29, 2025Mar 31, 2025Dec 31, 2024Sep 29, 2024Jun 30, 2024
Market Cap ($M)11,91112,55911,63810,80410,3578,5967,80510,0898,024
Enterprise Value ($M)14,92715,57514,26213,52913,15911,33610,52113,38811,392
Price to Earnings Ratio (P/E)-53.4015.7414.4311.58-3.0321.80-56.8911.3014.48
Price/Earnings-to-Growth Ratio (PEG)3.430.28-0.290.390.46
Price to Sales Ratio (P/S)2.4712.568.057.7910.569.697.097.878.06
Price to Book Ratio (P/B)18.2419.3721.6126.5842.967.356.747.846.97
Price to Free Cash Flow Ratio (P/FCF)11.6639.8129.8841.41187.6369.1637.4357.9859.26
Enterprise Value to Sales (EV/Sales)15.579.869.7513.4212.789.5510.4511.45
Enterprise Value to EBITDA (EV/EBITDA)52.7157.6240.2334.32-17.8851.57215.1534.6940.71
Debt to Equity Ratio10.655.976.328.2313.892.872.953.103.47

HAS Growth Runway Model

Standard long term linear growth fade

Multi-Stage Discounted Cash Flow Sandbox

Market Price$84.18
Intrinsic Value$7.64
Market Alignment
Overvalued by 90.9%relative to calculated intrinsic value
9.00%
Exp: -7%-7%
i

Growth runway slowdown

This value provides a time window for the growth rate to decline beyond Stage 1 toward the terminal rate. Longer windows are most useful for companies with high growth starting conditions or strong competitive advantages. This option stretches out the growth rate slowdown across 5, 10, or 15-year steps. A high-growth starting condition (exceeding a 25% initial growth rate) automatically applies a curve decay to simulate realistic, rapid market saturation.
i

Terminal growth rate

With long-term inflation between 3-5%, revenue must grow by that baseline to maintain flat real-world market share. This value sets the permanent terminal growth rate to factor into the valuation beyond the growth slowdown runway toward maturity.

3-Stage Financial Runway Horizon

🧠 Perpetuity Horizon Engine (Stage 3: Post-2035)

Terminal FCF Base$0.31B
Perpetuity TV Value$5.92B
Discounted TV (PV)$2.50B
TV Weighting %52.7%
⚠️
Financial Model Disclaimer & Risk Disclosure: This interactive scenario simulator is an educational sandbox provided strictly for informational and analytical research purposes. Core historical financial statements and consensus estimates are sourced directly via Financial Modeling Prep (FMP). All downstream outputs are entirely deterministic, hypothetical projections generated by combining automated mathematical formulas (including linear interpolation and Gaussian bell-curve decay models) with user-selected variables and third-party financial data inputs. Users assume all liability for trading decisions executed based on these sandbox calculations.

📘 Full Research Report

ℹ️

AI-Generated Research: This report is for informational purposes only.

📘 HASBRO INC (HAS) — Investment Overview

🧩 Business Model Overview

Hasbro converts owned and licensed intellectual property (IP)—including classic board games, tabletop roleplaying, and entertainment franchises—into consumer products and media-adjacent experiences. The value chain runs from (1) IP development and rights management, to (2) product design and manufacturing/fulfillment (toys and games), to (3) distribution through retail channels and e-commerce, and (4) monetization via digital games, content licensing, and branded experiences. The company’s recurring “engine” is the ability to translate IP demand into multiple formats (physical, digital, and licensing) while using the same franchises across years.

💰 Revenue Streams & Monetisation Model

Hasbro monetizes primarily through:

  • Consumer product sales (physical toys and games): largely transactional, with margin influenced by product mix, promotions, and supply-chain efficiency.
  • Licensing and royalties: partially recurring as long as franchises remain in use across media and partners; tends to be less capital-intensive than manufacturing.
  • Digital gaming and media-related revenue: more variable, but typically offers better scalability when franchises achieve audience traction.

Margin drivers are dominated by (1) gross margin management through mix and sourcing discipline, (2) operating leverage from overhead absorption, and (3) working-capital control (inventory and receivables). Over time, the mix shift toward licensing/digital can improve the earnings profile by reducing manufacturing intensity.

🧠 Competitive Advantages & Market Positioning

Hasbro’s moat is primarily driven by Intangible Assets (IP) and multi-format monetisation. Classic franchises and storytelling ecosystems (e.g., tabletop roleplaying, collectible game experiences, and widely recognized game brands) create durable consumer recognition and partner interest. While any single product cycle can be volatile, the ability to extend a franchise across physical formats, digital experiences, and licensing raises the economic value of the underlying IP base.

Competitive benchmarking:

  • Mattel: stronger emphasis on proprietary consumer characters and broad retail execution; less reliant on third-party entertainment tie-ins than an IP-license-heavy model.
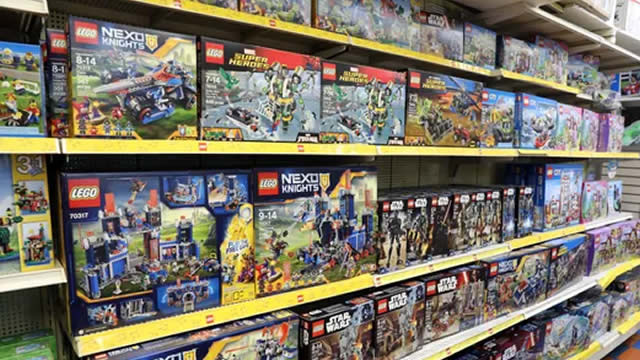
  • LEGO (LEGO Group): a highly efficient construction system with deep consumer engagement; competition is often won through product-engine design and franchise stickiness rather than licensing alone.
  • Spin Master: notable franchise development and toy-gaming synergies; competes for shelf space and seasonal demand with a portfolio that can refresh quickly.

Positioning contrast: Hasbro’s differentiated focus is the monetization of a portfolio of globally recognized games and storytelling IP across multiple channels (retail products plus licensing/digital). In contrast, Mattel and LEGO tend to leverage proprietary brand ecosystems and product systems with durable merchandising advantages. Hasbro’s competitive strength is the breadth and reusability of its IP franchises, which enables it to repackage value across formats and partners.

🚀 Multi-Year Growth Drivers

  • Franchise lifecycle monetization: multi-year extension of game and entertainment IP into new product lines, content releases, and partner activations.
  • Licensing and entertainment tie-in opportunities: rights-driven demand can expand through continued media presence and cross-promotional partnerships.
  • Digital and adjacent experiences: digital games and media-adjacent formats can increase lifetime value per franchise holder when product-market fit is achieved.
  • Board games and tabletop engagement trends: sustained consumer interest in in-home social entertainment supports TAM expansion beyond traditional toy cycles.
  • Operational discipline and portfolio focus: reallocating resources toward higher-velocity franchises and improving supply-chain efficiency supports structural margin resilience.

Over a 5–10 year horizon, the principal TAM expansion comes from greater share of leisure spending directed to branded in-home entertainment and from extending the value of IP franchises across more formats and distribution partners.

⚠ Risk Factors to Monitor

  • IP concentration and franchise durability risk: monetization depends on maintaining franchise relevance and successful cycles of content/product alignment.
  • Consumer demand cyclicality: discretionary spending swings can pressure sell-through and increase promotional intensity.
  • Retail and channel bargaining power: reliance on major retail partners can limit pricing power and increase inventory-related risk.
  • Supply-chain and working-capital volatility: manufacturing lead times, transportation costs, and forecasting errors can affect cash generation.
  • Intellectual property and rights management: licensing terms, partner performance, and IP litigation/infringement outcomes can alter expected monetization.
  • Product safety and regulatory compliance: consumer product regulations and safety standards can drive costs and restrict SKUs.

📊 Valuation & Market View

Equity markets for consumer brands with entertainment/IP exposure often apply a blend of valuation frameworks, including EV/EBITDA and P/E, with periodic reference to P/S when near-term earnings visibility is constrained by product-cycle dynamics. Key drivers that typically move valuation expectations include:

  • Quality of earnings: whether operating results show durability from IP-driven demand and mix improvement.
  • Gross margin and operating leverage: evidence of sustained cost control and better product mix.
  • Free cash flow conversion: working-capital discipline and reduced inventory drag.
  • Franchise monetization momentum: licensing and digital contributions that reduce manufacturing intensity.

A constructive market view typically aligns with a path toward more stable franchise cash flows and reduced earnings volatility from manufacturing exposure.

🔍 Investment Takeaway

Hasbro’s long-term investment case rests on intangible IP assets and the company’s capability to monetize franchises across physical, digital, and licensing channels. While the company operates in a cyclical consumer environment, the economic rationale strengthens when franchise durability and mix shift toward less manufacturing-intensive revenue streams support resilient margins and cash generation. The primary diligence focus is the durability of the IP portfolio, the execution of franchise cycles, and the discipline of working-capital management.


⚠ AI-generated — informational only. Validate using filings before investing.

📰 Market News & Coverage

15 Stories Available

Real-time institutional reporting and market updates for HAS.

zacks.com2026-06-04

Best Consumer Dividend Stocks to Buy Now: HAS, KVUE, MOV

Here are three top-rated consumer dividend stocks that have yields above 3% and have made their way onto the coveted Zacks Rank #1 (Strong Buy) list.

wsj.com2026-06-03

Hasbro's New AI Studio Looks to Bring Its Iconic Characters to Next-Generation Experiences

Hasbro launched Sixth Wall, a new artificial-intelligence studio aiming to bring the toymaker's cast of characters into the new technological era.

forbes.com2026-06-03

Hasbro AI Studio Unveils Interactive AI Versions Of Iconic Characters

Toymaker Hasbro today unveiled a project it has been working on in stealth mode for the past year - an AI studio tasked with giving iconic Hasbro properties like Mr. Potato Head interactive, AI-powered personas.

businesswire.com2026-06-03

Hasbro Launches Sixth Wall, a New AI Studio Building the Next Generation of Character Experiences

LOS ANGELES--(BUSINESS WIRE)---- $HAS #Hasbro--Hasbro Launches Sixth Wall, a New AI Studio Building the Next Generation of Character Experiences.

zacks.com2026-06-02

Can Hasbro's Digital Push Unlock a New Growth Runway for MAGIC?

HAS' MAGIC goes deeper into digital: Arena gets Marvel rights as Wizards & Digital Gaming revenues jump 26% and margins hit 51.2%.

zacks.com2026-06-02

All You Need to Know About Hasbro (HAS) Rating Upgrade to Strong Buy

Hasbro (HAS) might move higher on growing optimism about its earnings prospects, which is reflected by its upgrade to a Zacks Rank #1 (Strong Buy).

zacks.com2026-06-02

Bears are Losing Control Over Hasbro (HAS), Here's Why It's a 'Buy' Now

Hasbro (HAS) appears to have found support after losing some value lately, as indicated by the formation of a hammer chart. In addition to this technical chart pattern, strong agreement among Wall Street analysts in revising earnings estimates higher enhances the stock's potential for a turnaround in the near term.

zacks.com2026-06-02

Are Consumer Discretionary Stocks Lagging Hasbro (HAS) This Year?

Here is how Hasbro (HAS) and Honest (HNST) have performed compared to their sector so far this year.

zacks.com2026-06-02

Best Income Stocks to Buy for June 2nd

CRGY, HAS and PLGO made it to the Zacks Rank #1 (Strong Buy) income stocks list on June 2nd, 2026.

247wallst.com2026-05-29

If Spider-Man Wins 2026's Box Office Crown, These Stocks Win Too

Prediction market traders have a clear favorite for 2026's box office crown, and the ripple effects extend well beyond Hollywood.

zacks.com2026-05-28

Hasbro (HAS) Stock Falls Amid Market Uptick: What Investors Need to Know

The latest trading day saw Hasbro (HAS) settling at $86.33, representing a -1.89% change from its previous close.

zacks.com2026-05-28

Wall Street Analysts See Hasbro (HAS) as a Buy: Should You Invest?

When deciding whether to buy, sell, or hold a stock, investors often rely on analyst recommendations. Media reports about rating changes by these brokerage-firm-employed (or sell-side) analysts often influence a stock's price, but are they really important?

zacks.com2026-05-28

Best Income Stocks to Buy for May 28th

HAS, LXFR and SBUX made it to the Zacks Rank #1 (Strong Buy) income stocks list on May 28, 2026.

zacks.com2026-05-26

Do Options Traders Know Something About Hasbro Stock We Don't?

Investors need to pay close attention to HAS stock based on the movements in the options market lately.

gurufocus.com2026-05-20

Hasbro Inc (HAS) Q1 2026 Earnings Call Highlights: Strong Revenue Growth Amid Challenges

Revenue: $1 billion, up 13% year-over-year.Adjusted Operating Profit: $287 million, increased 29%.Adjusted Operating Margin: 28.7%, up 360 basis points.Adjuste

📊 AI Financial Analysis

Powered by StockMarketInfo
Earnings Data: Q Ending 2026-03-29

"HAS reported Q1’26 Revenue of $1.00B and Net Income of $199.5M, with diluted EPS of $1.39 (reported GAAP EPS $1.41). YoY, Revenue rose ~12.8% (from $887.1M in Q1’25) and Net Income grew ~102.2% (from $98.6M). QoQ, Revenue fell ~30.8% versus Q4’25 ($1.45B), but profitability remains far above Q4: Net Income declined only ~0.6% QoQ ($201.6M in Q4’25). Margins strengthened across the year but were volatile sequentially. Gross margin was ~68.2% in Q1’26 vs ~70.5% in Q1’25 and ~68.9% in Q4’25. Operating margin improved sharply YoY (27.0% vs 19.2%), translating into much higher earnings power, though the company faced higher operating expense levels sequentially. Cash flow was solid: operating cash flow was $337.7M and free cash flow was $315.5M. The company continues to return capital via dividends (~$98.5M in the quarter) and modest buybacks (−$7.7M). Balance sheet resilience is moderate: total assets were $5.93B with equity of $648M; however, leverage remains high with net debt of ~$3.02B. Total shareholder returns appear strongly positive given the stock’s ~+87% 1-year price change."

Revenue Growth

Positive

YoY Revenue growth of ~+12.8% in Q1’26 (to $1.00B). QoQ Revenue declined ~-30.8% from Q4’25 ($1.45B), indicating seasonality/volatility rather than sustained quarter-to-quarter momentum.

Profitability

Strong

Net Income increased ~+102.2% YoY to $199.5M. Operating margin improved YoY to ~27.0% (from ~19.2% in Q1’25), though sequentially margins were mixed given the QoQ Revenue drop.

Cash Flow Quality

Good

Q1’26 Operating Cash Flow of $337.7M and Free Cash Flow of $315.5M with earnings conversion supportive. Capital returns remain active: dividends ~-$98.5M and small buybacks (−$7.7M).

Leverage & Balance Sheet

Fair

Assets of $5.93B with equity of $648M; leverage is still high (net debt ~$3.02B, total debt ~$3.87B). Leverage improved versus earlier quarters (net debt down from ~$2.74–$2.80B in Q1/Q2’25), which is not ideal but not deteriorating dramatically.

Shareholder Returns

Strong

Strong momentum: price is up ~+87% over 1Y (well above +20% threshold). Ongoing dividends provide additional yield (~0.78% dividend yield in the provided ratios). Buybacks are smaller, but total return profile is positive.

Analyst Sentiment & Valuation

Neutral

Consensus target (about $111.83) vs current price ~$97.15 implies modest upside (~15%). Valuation metrics shown are elevated (e.g., P/E ~15.7), suggesting sentiment is constructive but not without risk.

Disclaimer:This analysis is AI-generated for informational purposes only. Accuracy is not guaranteed and this does not constitute financial advice.

Fundamentals Overview

Loading fundamentals overview...

Hasbro reported a strong Q1 2026, with revenue up 13% to $1.0B and adjusted EPS of $1.47 (+41% YoY), driven by Wizards of the Coast’s Magic momentum (Lorwyn Eclipsed record performance, robust Backlist, and expanding organized play through 11,000+ WPN stores). Adjusted operating margin expanded 360 bps to 28.7%, including a 140 bps Wizards margin lift to 51.2%. Consumer Products was stable at $398M, but absorbed incremental tariffs, royalties, and cyber-driven timing disruptions, resulting in a $41M adjusted operating loss. Management maintained full-year guidance (revenue +3% to +5% CC; adjusted op margin 24% to 25%; EBITDA $1.4B-$1.45B), emphasizing cost transformation and productivity offsets against oil-driven input pressures. The key financial swing factors are the $40M-$60M CP revenue delay from Q2 into Q3 and potential tariff claim refund timing (roughly $50M) not embedded in outlook. Cyber remediation is on track by a June systems restoration timeline.

AI IconGrowth Catalysts

  • Magic: Lorwyn Eclipsed best-selling Magic Premier set of all time; outperformed prior best-selling set by a “handsome margin”
  • Magic: Teenage Mutant Ninja Universe is Beyond Collaboration outpaced internal expectations
  • Magic: Record quarterly Backlist sales; demand extending beyond tabletop/digital into live experiences; MagicCon Las Vegas sold 23,000+ badges (largest ever)
  • Magic: Magic Arena “full digital rights” announced for upcoming Marvel Super Heroes launch with The Walt Disney Company
  • Wizards: Organized play distribution gains across 11,000+ Wizards Play Network stores supporting player acquisition/retention flywheel
  • Consumer Products: Gen Square categories driving POS share gains; upcoming tentpoles including Star Wars theatrical return with The Mandalorian and Grogu

Business Development

  • The Walt Disney Company: Magic Arena will feature full digital rights for the upcoming Marvel Super Heroes launch
  • Universe Beyond partners/franchises cited: Teenage Mutant Ninja Turtles (TMN Universe beyond collab), Avatar: The Last Airbender, Final Fantasy
  • Scopely: MONOPOLY GO partnership described as “meaningfully” driving fan engagement and incremental licensing/product sales
  • Entertainment content franchise cadence cited: Marvel superheroes, The Hobbit, Star Trek (upcoming Wizards of the Coast lineup)

AI IconFinancial Highlights

  • Net revenue $1.0B, up 13% YoY; adjusted operating profit $287M, up 29% YoY
  • Adjusted operating margin 28.7%, up 360 bps vs prior year on favorable mix and cost savings
  • Wizards segment revenue $582M, up 26%; Wizards adjusted operating margin 51.2%, up 140 bps
  • Adjusted EPS (diluted) $1.47, up 41% YoY due to operating leverage and disciplined execution
  • Consumer Products revenue $398M essentially flat YoY; adjusted operating loss $41M, ~flat magnitude improvement of ~$10M on an adjusted basis
  • Consumer Products headwinds included higher royalty expense, incremental tariffs, and lapping prior-year licensing strength
  • Cost transformation: $37M gross savings; on track for full-year $150M commitment
  • Operating cash flow $338M (strategic investments $50M; dividends $99M) plus initiation of share repurchases; cyclicality: $50M-$60M CP revenue delayed from Q2 to back half due to cyber event
  • Tax/tariff/oil: maintained full-year guidance; tariff uncertainty managed via “lower tariff expense” benefit (explicitly cited later as ~$15M good guide from when started year) offset by oil-driven input pressure (~$30M assumed with $100/bbl oil)

AI IconCapital Funding

  • Issued $400M of new notes: proceeds used to fully repay November 2026 maturities and apply remainder to repurchase of higher-rate longer-dated debt
  • Returned $99M to shareholders via dividend in Q1; authorized Q2 dividend (amount not stated)
  • Started share repurchases under recently authorized program (repurchase dollar amount not stated)

AI IconStrategy & Ops

  • Cyber incident remediation: prioritized restoring financial systems first; turning back on other systems (order management/shipping/invoicing) targeted by “June timeline”
  • Quarterly setup: owned and retail inventory described as healthy with lean retailer inventories; “good setup” ahead of key theatrical windows and seasonal builds
  • Supply chain resilience for Magic trading cards: multiple paper/card-stock sources across U.S., Germany, Japan; mitigated reprint lead time now 3-4 months vs prior ~6 weeks
  • Inventory/reprint rotation optimization: extended card rotation from ~18-24 months to ~32-36 months to accommodate supply constraints
  • Cost mitigation levers: freight optimization, mix management, operating spend reductions; productivity and accelerated operating expense savings cited
  • Cash-flow phasing from cyber/invoicing disruption: cash collection lumpiness expected with invoicing shut off for a period; shift into Q3

AI IconMarket Outlook

  • Full-year consolidated guidance maintained: revenue +3% to +5% YoY on constant currency
  • Full-year adjusted operating margins: 24% to 25%; adjusted EBITDA: $1.4B to $1.45B
  • Segment expectations: Wizards mid-single-digit revenue growth with operating margins low 40% range; Consumer Products low single-digit revenue growth with operating margins 6% to 8%; Entertainment revenue slightly positive with operating margins ~50%
  • Phasing guidance: revenue growth robust in first half supported by Marvel Super Heroes release; moderates in back half due to tougher Q4 compares
  • Q2 CP outlook: “low single-digit rate” growth (cyber shifted revenue impact into Q3)
  • Q2 Wizards outlook: “quite robust” behind Strixhaven and superheroes launch; Q4 described as most likely to be down versus a big prior-year comp

AI IconRisks & Headwinds

  • Cyber remediation impacts embedded in guidance: ~$20M onetime additional operating expenses (remediation); ~$40M-$60M Consumer Products revenue delayed from Q2 to back half; receivables timing shift from Q2 to Q3 impacting cash flow
  • Tariffs: uncertainty around timing/amount of refunds; tariff claim described as roughly $50M with no embedded refund timeline in outlook
  • Oil/input costs: rising oil impacts freight/resin/packaging; rough annual gross margin impact assumed ~$30M if oil stays around $100/bbl; mitigations via productivity and mix/pricing
  • Magic supply constraints: trading card supply challenge; ability to reprint compressed response time now 3-4 months; risk if demand “vaporizes” or sells out quickly
  • Wizards growth comps risk: back-half growth expected to moderate; Q4 comp described as down most likely due to tougher comparisons

Q&A: Analyst Interest

  • Guidance confidence vs new information: Management said holding full-year guidance is “consistent with typical practice” because it is early in the year with multiple new releases and entertainment on tap; they emphasized improving cost navigation for oil/tariffs and noted cyber remediation is still in final phases.
  • CP revenue shift and segment phasing: Analysts asked for Q2 math and risk to outlook. Management guided Consumer Products to grow in Q2 at a “low single-digit rate,” with most of the $40M-$60M revenue delay moving into Q3; Q3 expected to deliver double-digit growth and some carry into Q4.
  • Network breach operational scope and timing: Analysts requested specifics on the breach and whether shelf-date risk exists. Management declined breach details but stated no impact to suppliers (co-manufacturers), systems were taken down to protect environment, financial systems restored first, and full order/invoicing/shipping systems targeted by June with no foreseeable future risk.

Sentiment: POSITIVE

Note: This summary was synthesized by AI from the HAS Q1 2026 earnings transcript. Financial data is complex; please verify all metrics against official SEC filings before making investment decisions.

📋 Official Regulatory 10-K / 10-Q SEC Filings

Direct authenticated documentation links to audited SEC database reports for HAS.

SEC EDGAR Live Feed
Loading financial data and tables...
📁

SEC Filings (HAS)

© 2026 Stock Market Info — Hasbro, Inc. (HAS) Financial Profile