Perma-Fix Environmental Services, Inc.

Perma-Fix Environmental Services, Inc. (PESI) Market Cap

Perma-Fix Environmental Services, Inc. has a market capitalization of $179.7M.

Price: $9.68

0.05 (0.52%)

Market Cap: 179.71M

NASDAQ · time unavailable

CEO: Mark J. Duff

Sector: Industrials

Industry: Waste Management

IPO Date: 1992-12-08

Website: https://www.perma-fix.com

Perma-Fix Environmental Services, Inc. (PESI) - Company Information

Market Cap: 179.71M|Sector: Industrials

Company Profile

Perma-Fix Environmental Services, Inc., through its subsidiaries, operates as an environmental and technology know-how company in the United States. It operates in three segments: Treatment, Services, and Medical. The Treatment segment offers nuclear, low-level radioactive, mixed waste, hazardous and non-hazardous waste treatment, and processing and disposal services through treatment and storage facilities. This segment is also involved in the research and development activities to identify, develop, and implement waste processing techniques for problematic waste streams. The Services segment provides technical services, including professional radiological measurement and site survey of government and commercial installations; integrated occupational safety and health services; and consulting, engineering, project and waste management, environmental, decontamination and decommissioning (D&D) field, technical, on-site waste management services, and management personnel and services. This segment also offers nuclear services, including technology-based services comprising engineering, D&D, specialty, construction, logistics, transportation, processing, and disposal; offers remediation of nuclear licensed and federal facilities, as well as cleanup of nuclear legacy sites; and owns an equipment calibration and maintenance laboratory that services, maintains, calibrates, and sources health physics, industrial hygiene, and customized nuclear, environmental, and occupational safety and health instrumentation. The Medical segment is involved in the research and development of medical isotope production technology. The company provides its services to research institutions, commercial companies, public utilities, and governmental agencies through direct sales to customers or through intermediaries. Perma-Fix Environmental Services, Inc. was incorporated in 1990 and is based in Atlanta, Georgia.

Analyst Sentiment

92%
Strong Buy

From 1 Active Polls

1Y Forecast: $18.00

▲ +86.0% Potential Upside

Consensus Target Metrics

Low Bound

$18

Median

$18

High Bound

$18

Average

$18

Price & Moving Averages

Loading chart...

🎯 Wall Street Analyst Intelligence Report

1-Year structural target targets, chart projections, and sentiment maps.

Average 1Y Target
$18.00
▲ +85.95% Upside
Low Target
$18.00
86% Risk
Median Target
$18.00
86% Mid
High Target
$18.00
86% Max
Consensus
Hold
0 / 1 Buys

Consensus Trend Projection

Trailing closures vs. 12-month metrics map.

Analyst Vote Distribution

Aggregate institutional coverage sentiment weights.

📊 Historical Valuation Multiples

Real-time Trailing Twelve Month (TTM) momentum side-by-side with discrete quarterly metrics.

Fiscal QuarterTTMQ1 2026Q4 2025Q3 2025Q2 2025Q1 2025Q4 2024Q3 2024Q2 2024
Period EndingTrailing 12MMar 31, 2026Dec 31, 2025Sep 30, 2025Jun 30, 2025Mar 31, 2025Dec 31, 2024Sep 30, 2024Jun 30, 2024
Market Cap ($M)180198233187194134167194133
Enterprise Value ($M)177196226174176113143188121
Price to Earnings Ratio (P/E)-10.14-6.62-10.29-25.42-17.86-9.37-11.96-5.40-8.43
Price/Earnings-to-Growth Ratio (PEG)-1.29-3.73-0.27-3.11
Price to Sales Ratio (P/S)3.0517.8214.8310.6913.319.6211.3511.539.53
Price to Book Ratio (P/B)4.184.614.653.373.422.262.674.582.61
Price to Free Cash Flow Ratio (P/FCF)-10.22-42.69-53.74-32.11-69.31-50.99-36.41-27.38-57.35
Enterprise Value to Sales (EV/Sales)17.5914.369.9812.068.119.7111.218.62
Enterprise Value to EBITDA (EV/EBITDA)-13.18-27.98-81.45-142.85-71.55-38.50-46.07-86.94-26.20
Debt to Equity Ratio0.190.100.090.070.080.080.080.120.11
⚠️

Valuation Model Suspended

API Payload Error: Inverted or negative baseline Free Cash Flow margin detected (-6.9%).

Troubleshooting Notice: The upstream financial data supplier has uploaded corrupted or inverted baseline metrics for PESI. The server sandbox cannot calculate an intrinsic value path from negative cash generation baselines.

📘 Full Research Report

ℹ️

AI-Generated Research: This report is for informational purposes only.

📘 PERMA FIX ENVIRONMENTAL SERVICES I (PESI) — Investment Overview

🧩 Business Model Overview

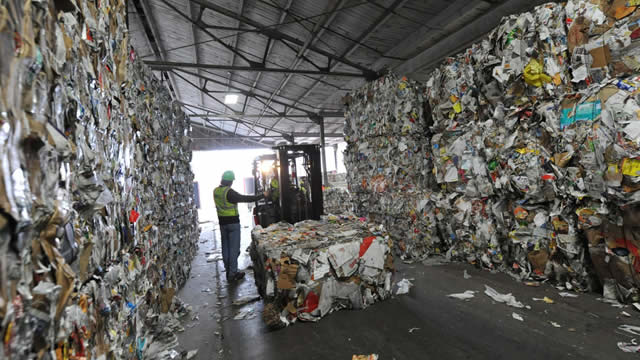
PERMA FIX Environmental Services I provides specialized treatment, storage, and disposal services for regulated waste streams, including hazardous industrial waste and other highly regulated categories that require compliant handling, permitting, and treatment capabilities. The company’s value proposition is operational: it receives waste from generators, manages safe transportation/receipt protocols, treats and processes materials using approved methods, and ultimately disposes of residues at permitted facilities—or transfers waste through licensed channels where appropriate.

Because customers must meet strict regulatory requirements and often face significant consequences if waste is mishandled, the company’s “how it works” is built around (1) compliant intake and documentation, (2) permitted treatment pathways, (3) secure handling and throughput at fixed infrastructure, and (4) repeat qualification of generators and intermediaries that rely on predictable, auditable outcomes.

💰 Revenue Streams & Monetisation Model

Revenue is primarily driven by per-ton/per-load service pricing tied to volume and waste complexity. Monetisation typically includes:

  • Treatment and disposal fees for hazardous and regulated waste handled through the company’s facility network.
  • Storage-related and processing services where waste requires approved interim handling before treatment or disposal.
  • Remediation and specialty services that can be contract-based and tied to project scope, waste characterisation, and remediation deliverables.
  • Ancillary revenues (e.g., permitting-related logistics support and compliance documentation services) that support the primary waste management activity.

Margin drivers tend to be (1) facility utilization and throughput discipline, (2) waste mix (volume of easier-to-treat streams versus higher-cost treatment streams), (3) pricing versus disposal/treatment costs, and (4) execution on permitted processes that avoid costly rework and regulatory non-compliance. Competitive dynamics matter: pricing and utilization often move together in this industry, but defensible specialty capabilities can moderate pricing pressure.

🧠 Competitive Advantages & Market Positioning

PESI’s structural advantages most closely align with Regulatory Moats and Switching Costs:

  • Regulatory Moat (Permitting + operational qualification): Operating in hazardous and highly regulated waste categories requires permits, approved treatment pathways, and ongoing compliance. Recreating these capabilities generally takes time, capital, and institutional know-how.
  • Switching Costs (Qualification + compliance risk): Waste generators and intermediaries must qualify disposal/treatment vendors across documentation, safety practices, waste acceptance criteria, and audit requirements. Switching away introduces compliance and operational risk, and often requires renegotiation of intake parameters.
  • Capacity and execution discipline: Specialty infrastructure supports reliable service delivery, which can be valued by customers seeking continuity of waste disposition.

Competitive benchmarking:

  • Clean Harbors (CLH): broader hazardous waste services with meaningful scale across industrial and specialty segments. PESI generally competes by emphasizing compliance-intensive specialty waste handling and treatment/disposal pathways.
  • Stericycle (SRCL): stronger presence in healthcare and regulated waste streams with a different end-market mix. PESI is positioned more toward hazardous/industrial specialty treatment and disposal capabilities.
  • Heritage-Crystal Clean (HCCI): more focused on used oil, industrial services, and certain recycling-related categories. PESI’s differentiation is more tied to regulated treatment/disposal requirements rather than purely commoditized industrial services.

In this competitive set, the key differentiator for PESI is the ability to serve waste categories where permitting, qualification, and operational compliance barriers remain elevated—reducing the ease with which competitors can displace qualified incumbents.

🚀 Multi-Year Growth Drivers

Sustained growth prospects in environmental services are supported by secular demand drivers rather than cyclical “one-off” catalysts:

  • Regulatory tightening and compliance complexity: Ongoing enforcement and evolving waste classification standards can increase the addressable set of waste streams requiring permitted treatment and disposal.
  • Industrial waste generation from reshoring, infrastructure, and manufacturing activity: Broader industrial output increases total waste volumes requiring responsible disposition.
  • Specialty waste outsourcing: Many generators prefer to outsource compliant treatment/disposal rather than maintain in-house infrastructure, benefiting permitted operators.
  • Capacity discipline and service reliability: As long as permitted capacity and execution quality remain scarce relative to demand in certain categories, vendor reliability can support pricing power or at least protect utilization.
  • Remediation and environmental compliance programs: Infrastructure and industrial remediation cycles can support project-based services, extending demand beyond simple disposal.

Over a 5–10 year horizon, the central TAM expansion thesis is that the “regulated waste services” market grows with both industrial activity and compliance intensity, while barriers to entry remain meaningfully high due to permitting and operational qualification.

⚠ Risk Factors to Monitor

  • Regulatory and permitting risk: Permit modifications, facility compliance requirements, or adverse rulings can constrain throughput and increase cost of operations.
  • Environmental liability and legacy exposure: Hazardous waste operators carry reputational and legal exposure; claims, remediation obligations, or settlement costs can be material.
  • Utilization and pricing pressure: Capacity additions across the industry or temporary demand softness can pressure disposal/treatment pricing and margins.
  • Capital intensity and maintenance requirements: Treatment and disposal infrastructure requires ongoing investment to sustain compliance and performance.
  • Operational execution risk: Treatment failures, safety incidents, or documentation lapses can trigger costly remediation, enforcement actions, or customer loss.
  • Customer concentration and qualification dynamics: Loss of key generator/intermediary relationships or changes in waste acceptance criteria can reduce volumes.

📊 Valuation & Market View

Equity valuation for specialized environmental service providers typically reflects:

  • EV/EBITDA and earnings power: The market often focuses on sustainable margins and cash generation tied to utilization and waste mix.
  • EV/Sales for visibility narratives: In segments where contract structure and throughput can create perceived earnings stability, price-to-sales can be a secondary lens.
  • Credit and working capital sensitivity: Waste services can involve working-capital swings driven by receivables, payment terms, and disposal logistics costs.
  • Quality of throughput and compliance history: Better compliance records and lower risk premiums can support higher multiple valuation relative to peers.

Key valuation “needle movers” generally include sustained utilization, normalized treatment costs, disciplined capital spending, and evidence that regulatory/compliance costs remain predictable relative to pricing.

🔍 Investment Takeaway

PERMA FIX Environmental Services I offers an institutional-style investment thesis centered on regulatory barriers and customer switching costs in specialized hazardous waste treatment and disposal. The core moat is not product branding; it is the ability to operate permitted infrastructure reliably, maintain compliance, and remain qualified for complex waste streams. The multi-year outlook is supported by secular regulatory complexity and ongoing outsourcing of regulated waste handling, while risks remain concentrated in environmental liability, permitting, utilization/price dynamics, and execution discipline.


⚠ AI-generated — informational only. Validate using filings before investing.

📰 Market News & Coverage

15 Stories Available

Real-time institutional reporting and market updates for PESI.

globenewswire.com2026-05-15

Perma-Fix Announces Pricing of $20.0 Million Public Offering of Common Stock

ATLANTA, May 15, 2026 (GLOBE NEWSWIRE) -- Perma-Fix Environmental Services, Inc. (Nasdaq: PESI) (“Perma-Fix” or the “Company”) today announced the pricing of its previously announced underwritten public offering of 2,285,714 shares of its common stock at a price to the public of $8.75 per share. Perma-Fix expects the gross proceeds from the offering to be approximately $20.0 million before deducting the underwriting discount and other estimated offering expenses. In connection with the offering, Perma-Fix has granted the underwriter a 30-day option to purchase up to 342,857 additional shares of its common stock at the public offering price, less the underwriting discount. The offering is expected to close on or about May 18, 2026, subject to the satisfaction of customary closing conditions.

globenewswire.com2026-05-14

Perma-Fix Announces Proposed Public Offering of Common Stock

ATLANTA, May 14, 2026 (GLOBE NEWSWIRE) -- Perma-Fix Environmental Services, Inc. (Nasdaq: PESI) (“Perma-Fix” or the “Company”) today announced that it has commenced an underwritten public offering of shares of its common stock. The proposed offering is subject to market and other conditions and there can be no assurance as to whether or when the offering may be completed, or as to the actual size or terms of the proposed offering.

seekingalpha.com2026-05-07

Perma-Fix Environmental Services, Inc. (PESI) Q1 2026 Earnings Call Transcript

Perma-Fix Environmental Services, Inc. (PESI) Q1 2026 Earnings Call Transcript

globenewswire.com2026-05-06

Perma-Fix Reports First Quarter 2026 Results and Strategic Outlook

Hanford waste receipts, Nuclear Services project mobilization,  PFAS technology expansion, and long-term grouting opportunities support improved outlook for 2026 ATLANTA, May 06, 2026 (GLOBE NEWSWIRE) -- Perma-Fix Environmental Services, Inc. (NASDAQ: PESI) (the “Company”) today announced financial results and provided a business update for the first quarter ended March 31, 2026. “As expected, the first quarter represented a transitional period as we deliberately positioned the Company for what we believe will be a significant step-up in activity beginning in the second quarter,” commented Mark Duff, President and Chief Executive Officer of Perma-Fix.

globenewswire.com2026-05-05

Perma-Fix Schedules First Quarter 2026 Business Update Conference Call

ATLANTA, May 05, 2026 (GLOBE NEWSWIRE) -- Perma-Fix Environmental Services, Inc. (NASDAQ: PESI) (the “Company”) today announced it will host a conference call at 10:00 AM Eastern Time on Wednesday, May 6, 2026. A webcast of the call may be accessed at https://www.webcaster5.com/Webcast/Page/2243/53965 or in the investor section of the Company's website at https://ir.perma-fix.com/conference-calls.

globenewswire.com2026-04-08

Perma-Fix to Present at Gabelli Funds' 12th Annual Waste & Environmental Services Symposium in New York City on April 9th

ATLANTA, April 08, 2026 (GLOBE NEWSWIRE) -- Perma-Fix Environmental Services, Inc. (NASDAQ: PESI) (the “ Company”) today announced that Mark Duff, Chief Executive Officer, and Ben Naccarato, Chief Financial Officer, will be presenting at Gabelli Funds' 12th Annual Waste & Environmental Services Symposium, being held on Thursday, April 9th, 2026 in Midtown Manhattan, New York City. Mr. Duff and Mr. Naccarato are scheduled to present at 1:30 PM ET. Management will also be participating in one-on-one meetings with qualified investors throughout the conference.

globenewswire.com2026-04-06

Perma-Fix Successfully Completes PFAS Treatment Project for U.S. Department of Energy (DOE) Contractor Using Proprietary Perma-FAS Destruction Technology

Execution of critical DOE cleanup work highlights Perma-Fix's leadership in PFAS destruction and positions the Company to address growing government and commercial remediation demand Execution of critical DOE cleanup work highlights Perma-Fix's leadership in PFAS destruction and positions the Company to address growing government and commercial remediation demand

seekingalpha.com2026-03-27

Perma-Fix Set To Do Much Better In H2 '26

Perma-Fix Environmental Services, Inc. is rated a Buy at $11, with an anticipated inflection point and profitability return in Q2 as Hanford and PFAS businesses scale. PESI's Hanford-related waste treatment is ramping, with DOE contracts and supplemental grouting programs expected to drive revenue and backlog growth through 2040. PFAS destruction capacity is set to triple with new technology, targeting high incremental margins and offering a cost-effective, emission-free alternative to incineration.

seekingalpha.com2026-03-24

Perma-Fix Environmental Services, Inc. (PESI) Q4 2025 Earnings Call Transcript

Perma-Fix Environmental Services, Inc. (PESI) Q4 2025 Earnings Call Transcript

globenewswire.com2026-03-24

Perma-Fix Reports 2025 Results as Expanded Capacity and Growing Backlog Support Hanford Cleanup Mission

PFNW permit renewal triples liquid processing capacity to 1.2 million gallons annually while backlog growth and international activity strengthen the Company's growth platform PFNW permit renewal triples liquid processing capacity to 1.2 million gallons annually while backlog growth and international activity strengthen the Company's growth platform

globenewswire.com2026-03-20

Perma-Fix Schedules Fourth Quarter and Fiscal 2025 Business Update Conference Call

ATLANTA, March 20, 2026 (GLOBE NEWSWIRE) -- Perma-Fix Environmental Services, Inc. (NASDAQ: PESI) (the “Company”) today announced it will host a conference call at 10:00 AM Eastern Time on Tuesday, March 24, 2026.

defenseworld.net2026-02-25

Perma-Fix Environmental Services (NASDAQ:PESI) Stock Price Passes Above 200-Day Moving Average – Here’s What Happened

Perma-Fix Environmental Services, Inc. (NASDAQ: PESI - Get Free Report) shares crossed above its 200-day moving average during trading on Tuesday. The stock has a 200-day moving average of $12.70 and traded as high as $13.50. Perma-Fix Environmental Services shares last traded at $13.00, with a volume of 162,916 shares traded. Wall Street Analyst Weigh

defenseworld.net2026-02-10

Critical Comparison: Perma-Fix Environmental Services (NASDAQ:PESI) & CECO Environmental (NASDAQ:CECO)

CECO Environmental (NASDAQ: CECO - Get Free Report) and Perma-Fix Environmental Services (NASDAQ: PESI - Get Free Report) are both industrials companies, but which is the better stock? We will compare the two businesses based on the strength of their profitability, dividends, institutional ownership, risk, valuation, earnings and analyst recommendations. Volatility and Risk CECO Environmental has a

globenewswire.com2026-01-09

Perma-Fix Environmental Services Receives Expanded Permit for Richland Facility, Approximately Tripling Liquid Mixed Waste Processing Capacity

Permit Renewal Increases Potential Throughput to Approximately 1.2 Million Gallons Annually and Strengthens Long-Term Strategic Positioning at Perma-Fix Northwest Permit Renewal Increases Potential Throughput to Approximately 1.2 Million Gallons Annually and Strengthens Long-Term Strategic Positioning at Perma-Fix Northwest

defenseworld.net2025-12-25

ARS Investment Partners LLC Sells 43,265 Shares of Perma-Fix Environmental Services, Inc. $PESI

ARS Investment Partners LLC lowered its position in Perma-Fix Environmental Services, Inc. (NASDAQ: PESI) by 51.4% in the undefined quarter, according to its most recent disclosure with the Securities and Exchange Commission (SEC). The firm owned 40,960 shares of the industrial products company's stock after selling 43,265 shares during the period. ARS Investment

📊 AI Financial Analysis

Powered by StockMarketInfo
Earnings Data: Q Ending 2026-03-31

"PESI reported Q1’26 (ended 2026-03-31) revenue of $11.13M and net loss of $(7.49)M, resulting in EPS of $(0.40). Gross margin turned sharply negative at -25.9% versus +7.6% in Q4’25, and net margin was -67.3%. QoQ, revenue declined from $15.72M (Q4’25) to $11.13M (Q1’26), a drop of -29.2%. Net loss widened from $(5.66)M to $(7.49)M, or -32.2% lower (more negative). YoY, revenue fell from $13.92M (Q1’25) to $11.13M, down -20.1%, while net loss increased (worsened) from $(3.57)M to $(7.49)M (about -109.6% larger losses). Over the four-quarter window, profitability deteriorated materially, with margins compressing and losses deepening after a brief improvement in gross profit earlier in 2025. Cash flow remains weak: operating cash flow is not shown positively for Q1’26 and free cash flow is about -$0.86M after capex. Balance sheet liquidity remains the key positive—cash and equivalents of ~$6.66M vs short-term obligations, but total assets decreased to $81.7M and retained earnings remain deeply negative (equity ~ $43.0M). Total shareholder returns look strong given the stock is up +67.97% over the past year; however, fundamentals in the latest quarter remain loss-making. Revenue and Earnings-based metrics show deterioration, suggesting the rally is likely sentiment/momentum-driven rather than earnings power. "

Revenue Growth

Neutral

Q1’26 revenue fell QoQ -29.2% ($15.72M to $11.13M) and YoY -20.1% ($13.92M to $11.13M), indicating a clear downtrend into the latest quarter.

Profitability

Neutral

Margins deteriorated sharply: gross margin -25.9% in Q1’26 vs +7.6% in Q4’25 and +4.7% in Q1’25. Net margin -67.3% in Q1’26 vs -36.0% (Q4’25) and -25.7% (Q1’25). EPS was $(0.40), worse than $(0.31) in Q4’25 and $(0.19) in Q1’25.

Cash Flow Quality

Caution

Loss-making cash generation: Q1’26 free cash flow roughly -$0.86M (after capex) with operating cash flow reported as 0 in the dataset. No dividends; buybacks are absent in Q1’26.

Leverage & Balance Sheet

Fair

Balance sheet leverage is low in absolute debt terms (short-term + long-term debt ~ $2.90M total debt; net debt -$3.76M). Liquidity has weakened since prior quarters (cash fell from $11.77M in Q4’25 to $6.66M in Q1’26), but the company retains positive total equity (~$43.0M).

Shareholder Returns

Good

Strong momentum: price is up +67.97% over 1 year. Dividend yield is 0 and buybacks are minimal/none in the quarter, so the high return appears driven primarily by capital appreciation.

Analyst Sentiment & Valuation

Neutral

Street implied upside is modest: consensus price target is $18 vs current price $12.9 (~+39%). Valuation multiples are negative on earnings due to losses, limiting interpretability of typical P/E-based signals.

Disclaimer:This analysis is AI-generated for informational purposes only. Accuracy is not guaranteed and this does not constitute financial advice.

Fundamentals Overview

Loading fundamentals overview...

Management is positioning 2H growth as “an inflection point,” citing a May start for DFLAW liquids, April start of a ~$1.5M/month brine stream, and TRU expansion adding ~$0.75M–$1.0M/month, plus PFAS Gen 2 capacity to ~3,000 gallons/day. However, the analyst-pressure reality is sharper: Q1 2026 is expected to be loss-heavy, with negative EBITDA exceeding $4M on ~$13M revenue, largely driven by DFLAW affluent receipt delays, seasonal field weakness, and a revenue-recognition swing of about $2M from Q1 into Q2 (even though processing occurred in Q1). In Q&A, DFLAW visibility is explicitly called difficult because DOE punch-list completion and actual throughput timing are unclear—confirming schedule risk despite management confidence. Net: long-duration Hanford opportunity is credible and quantified, but near-term profitability and earnings timing remain constrained by execution and regulatory/punch-list uncertainty.

AI IconGrowth Catalysts

  • Hanford DFLAW ramp: liquids expected to begin receiving in May (Northwest facility); dry waste expected in April
  • Northwest brine program (surface water evaporation from Hanford settling ponds): start planned April 1; ~$1.5M/month revenue stream
  • DFLAW additional waste via grouting approach: expected liquids/effluent streams grow up to ~20% above original DOE estimates; supplemental analysis under review with shipment expected mid/late April and receipts in May
  • TRU waste processing doubled from 1 shift to 2 shifts starting this month (added ~$0.75M to ~$1.0M/month)
  • PFAS Gen 2.0 system commissioning: delayed a couple months due to supply chain; testing targeted late April/early May; capacity to ~3,000 gallons/day after startup
  • Services segment recovery via new awards: demolition project award for radiological facility at a National Lab; 3 new projects mobilized into the field in last 2 weeks; better margins noted

Business Development

  • Hanford-related DOE program execution via DFLAW and supplemental grouting (regulatory supplemental analysis under review; public comment mid/late April)
  • Hanford tank contractor RFP for commercial grouting/offsite disposition: contract beginning January 2028; volume up to 50 million gallons to be grouted at commercial facilities; estimated RFP value discussed as ~$4B
  • International: Canada liquid treatment work at Florida facility and DSSI facility in Oak Ridge expected to begin mid-April and run through summer; additional Canada projects likely begin Q3; Mexico tranche out for bid (expected Q3/Q4 start); Germany waste expected through latter part of year
  • PFAS technology partnering/competitive displacement: focus on capturing incineration-competitor waste; Gen 1 backlog strong; ongoing partnerships for PFAS remediation/AFFF removal

AI IconFinancial Highlights

  • Q4 revenue: $15.7M vs $14.7M prior year (+$1.0M, +6.9%)
  • Q4 Treatment revenue: +$2.6M; Services revenue: -$1.6M (Treatment growth driven by higher volume, offset by lower average price due to waste-mix)
  • Q4 gross profit: $1.2M vs $0.594M (Q4 2024)
  • Q4 net loss: $5.7M vs $3.5M prior year; FY net loss improved to $13.8M vs $20.0M (2024)
  • Q4 EBITDA (continuing ops): loss of $2.7M vs loss of $3.0M prior year
  • Cash: $11.8M at quarter end vs $29.0M at year-end 2024
  • Revenue timing shift: ~$2.0M of revenue generated at Perma-Fix Northwest in Q1 will be recognized in Q2 due to revenue recognition rules (stored waste timing)
  • Q1 2026 operating pressure: losses likely exceed $4.0M in negative EBITDA on about $13M in revenue
  • Guidance-style expectation (informal): $1.0M to $1.5M to $2.0M per month revenue starting in Q2 (Mark’s script); analyst Q/A reiteration tied to DFLAW-derived streams
  • International revenue growth: foreign entities revenue increased ~163% YoY to ~$6.4M (FY 2025)

AI IconCapital Funding

  • Total debt at quarter end: $2.0M (excluding issuance costs; owed mostly to PNC Bank)
  • Cash used: continuing operations $10.3M in 2025; investing in continuing operations $4.9M (capex/permits); financing $981k (monthly payments, finance lease/other debt, partially offset by option exercises)
  • No buyback mentioned

AI IconStrategy & Ops

  • Perma-Fix Northwest permit renewal expanded capacity to ~1.2 million gallons/liquid mixed waste annually (tripling liquid processing capacity) and authorizes up to ~175,000 tons of waste via macro encapsulation annually
  • Automation/information systems investments and workforce expansion to support higher-throughput operations
  • Q1 softness drivers: (1) delayed DFLAW affluent receipts by several months, (2) normal seasonal field-activity weakness in Jan/Feb, (3) ongoing efforts to process stored waste and prepare resources
  • PFAS Gen 2.0 system: supply chain delays (new systems delayed a couple months); concrete poured; installation ongoing; late April/early May targeted testing
  • TRU: operational change from 1 shift to 2 shifts to double processing

AI IconMarket Outlook

  • DFLAW timing: supplemental analysis public comment mid/late April; receipts expected to start sometime in May (liquid); dry waste expected in April
  • Capacity ramp at Hanford (planning docs cited): after hot commissioning start in Oct 2025, expect ~40% capacity operational phase within 12–18 months, then increasing toward ~80% as additional systems come online; required within 3 years under tri-party agreement
  • Q2/ Q3 expectation: management states Q2 should represent an inflection point and April looks like a great month; April 1 start for surface water/pond brine program
  • PFAS: new system to enable ~3,000 gallons/day total capacity (Gen 2.0 online) and leverage higher storage/throughput to grow backlog

AI IconRisks & Headwinds

  • DFLAW operational uncertainty: DOE not very public on operations/punch list progress; difficult to project volumes and schedules (Aaron: clarity increases as punch list items clear)
  • Q1 margin/cash pressure: negative EBITDA likely exceeds $4.0M on ~$13M revenue (despite March strength) due to DFLAW receipt delays + seasonal weakness + stored waste revenue recognition shift
  • Revenue recognition lag: ~$2.0M moved from Q1 to Q2 (stored waste processed in Q1 but recognized in Q2)
  • Supply chain risk to PFAS equipment: Gen 2.0 systems delayed a couple months; installation and commissioning timing pushed to late April/early May testing
  • International revenue timing variability: Italy TRC scope is characterization while another contractor does drone removal; waste start expected Q1’27, implying 2026 may be ~25–30% below 2025 international revenue levels (though ramping into Q4)
  • Services project timing risk: federal shutdown and new-administration transition/policy adjustments impacted procurement and mobilizations; Services backlog/bids cited as improving but execution timing remains a key driver

Sentiment: CAUTIOUS

Note: This summary was synthesized by AI from the PESI Q4 2025 (FY ended Dec 2025) — call dated 2026-03-24 earnings transcript. Financial data is complex; please verify all metrics against official SEC filings before making investment decisions.

📋 Official Regulatory 10-K / 10-Q SEC Filings

Direct authenticated documentation links to audited SEC database reports for PESI.

SEC EDGAR Live Feed
Loading financial data and tables...
📁

SEC Filings (PESI)

© 2026 Stock Market Info — Perma-Fix Environmental Services, Inc. (PESI) Financial Profile